
I’ve been going over past posts, projecting forward my coming topics. I thought I would share some of the best and some of the topics I want to develop.
Recommendations From Early in 2014
I would recommend Forecasting in Data-Limited Situations – A New Day. There, I illustrate the power of bagging to “bring up” the influence of weakly significant predictors with a regression example. This is fairly profound. Weakly significant predictors need not be weak predictors in an absolute sense, providing you can bag the sample to hone in on their values.
There also are several posts on asset bubbles.
Asset Bubbles contains an intriguing chart which proposes a way to “standardize” asset bubbles, highlighting their different phases.
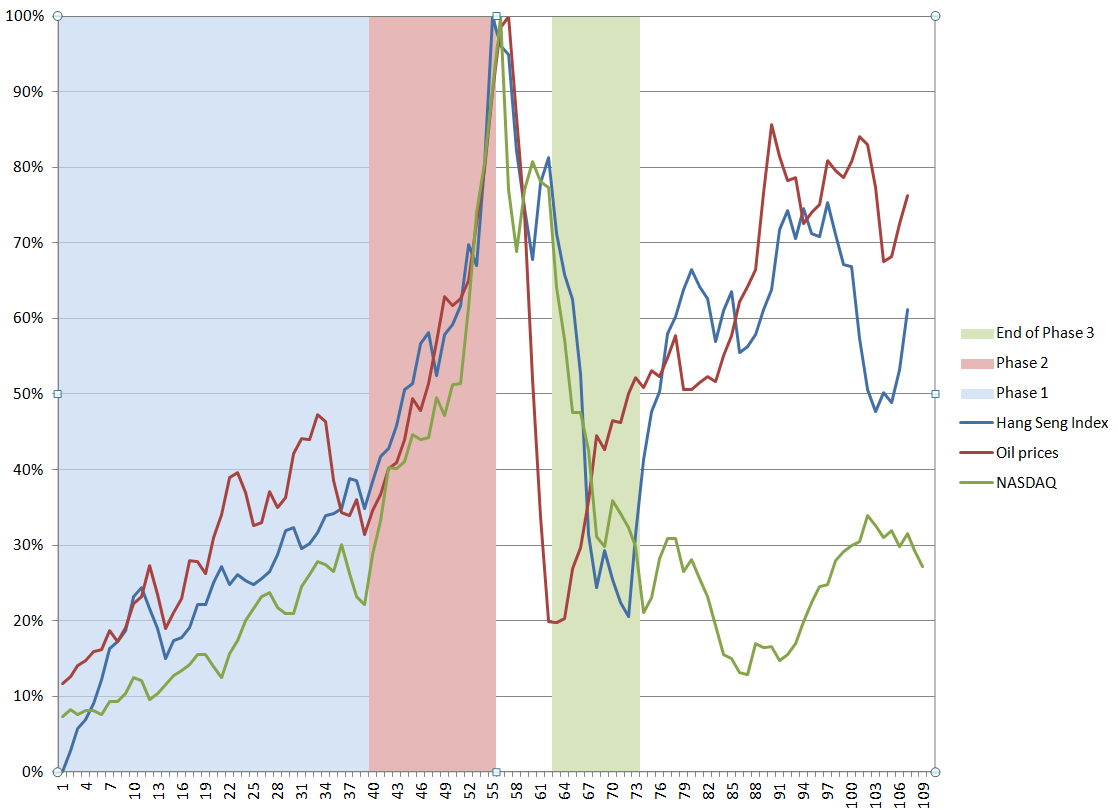
The data are from the Hong Kong Hang Seng Index, oil prices to refiners (combined), and the NASDAQ 100 Index. I arrange the series so their peak prices – the peak of the bubble – coincide, despite the fact that the peaks occurred at different times (October 2007, August 2008, March 2000, respectively). Including approximately 5 years of prior values of each time series, and scaling the vertical dimensions so the peaks equal 100 percent, suggesting three distinct phases. These might be called the ramp-up, faster-than-exponential growth, and faster-than-exponential decline. Clearly, I am influenced by Didier Sornette in choice of these names.
I’ve also posted several times on climate change, but I think, hands down, the most amazing single item is this clip from “Chasing Ice” showing calving of a Greenland glacier with shards of ice three times taller than the skyscrapers in Lower Manhattan.
See also Possibilities for Abrupt Climate Change.
I’ve been told that Forecasting and Data Analysis – Principal Component Regression is a helpful introduction. Principal component regression is one of the several ways one can approach the problem of “many predictors.”
In terms of slide presentations, the Business Insider presentation on the “Digital Future” is outstanding, commented on in The Future of Digital – I.
Threads I Want to Build On
There are threads from early in the year I want to follow up in Crime Prediction. Just how are these systems continuing to perform?
Another topic I want to build on is in Using Math to Cure Cancer. I’d like to find a sensitive discussion of how MD’s respond to predictive analytics sometime. It seems to me that US physicians are sometimes way behind the curve on what could be possible, if we could merge medical databases and bring some machine learning to bear on diagnosis and treatment.
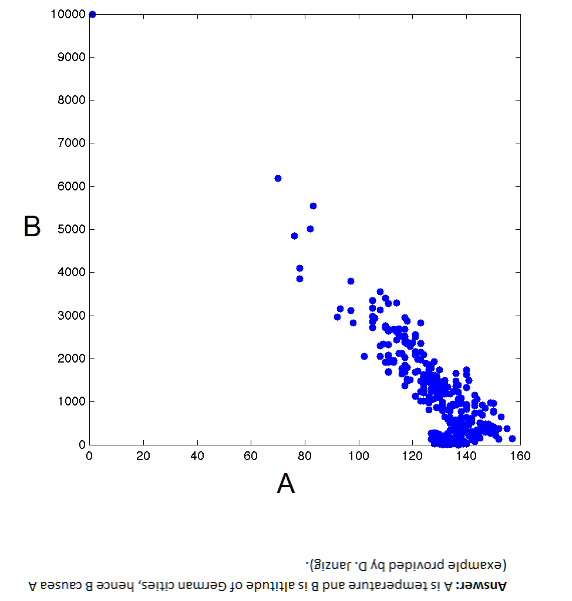
I am intrigued by the issues in Causal Discovery. You can get the idea from this chart. Here, B → A but A does not cause B – Why?
I tried to write an informed post on power laws. The holy grail here is, as Xavier Gabaix says, robust, detail-independent economic laws.
Federal Reserve Policies
Federal Reserve policies are of vital importance to business forecasting. In the past two or three years, I’ve come to understand the Federal Reserve Balance sheet better, available from Treasury Department reports. What stands out is this chart, which anyone surfing finance articles on the net has seen time and again.
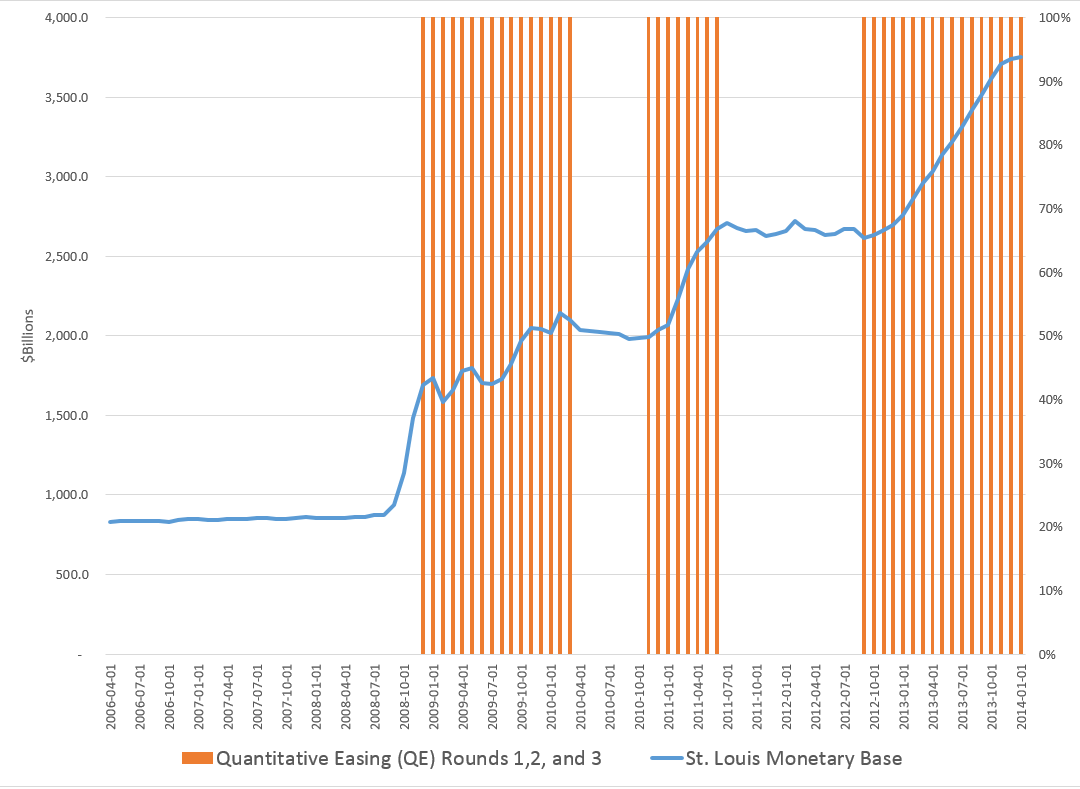
This shows the total of the “monetary base” dating from the beginning of 2006. The red shaded areas of the graph indicate the time windows in which the various “Quantitative Easing” (QE) policies have been in effect – now three QE’s, QE1, QE2, and QE3.
Obviously, something is going on.
I had fun with this chart in a post called Rhino and Tapers in the Room – Janet Yellen’s Menagerie.
OK, folks, for this intermission, you might want to take a look at Malcolm Gladwell on the 10,000 Hour Rule
So what happens if you immerse yourself in all aspects of the forecasting field?
Coming – how posts in Business Forecast Blog pretty much establish that rational expectations is a concept way past its sell date.
Guy contemplating with wine at top from dreamstime.