It seems only yesterday when “rational expectations” ruled serious discussions of financial economics. Value was determined by the CAPM – capital asset pricing model. Markets reflected the operation of rational agents who bought or sold assets, based largely on fundamentals. Although imprudent, stupid investors were acknowledged to exist, it was impossible for a market in general to be seized by medium- to longer term speculative movements or “bubbles.”
This view of financial and economic dynamics is at the same time complacent and intellectually aggressive. Thus, proponents of the efficient market hypothesis contest the accuracy of earlier discussions of the Dutch tulip mania.
Now, however, there seems no doubt that bubbles in asset markets are both real and intractable to regulation and management, despite their catastrophic impacts.
But asset bubbles are so huge now that Larry Summers suggests, before the International Monetary Fund (IMF) recently, that the US is in a secular stagnation, and that the true, “market-clearing” interest rate is negative. Thus, given the unreality of implementing a negative interest rate, we face a long future of the zero bound – essentially zero interest rates.
Furthermore, as Paul Krugman highlights in a follow-on blog post – Summers says the economy needs bubbles to generate growth.
We now know that the economic expansion of 2003-2007 was driven by a bubble. You can say the same about the latter part of the 90s expansion; and you can in fact say the same about the later years of the Reagan expansion, which was driven at that point by runaway thrift institutions and a large bubble in commercial real estate.
So you might be tempted to say that monetary policy has consistently been too loose. After all, haven’t low interest rates been encouraging repeated bubbles?
But as Larry emphasizes, there’s a big problem with the claim that monetary policy has been too loose: where’s the inflation? Where has the overheated economy been visible?
So how can you reconcile repeated bubbles with an economy showing no sign of inflationary pressures? Summers’s answer is that we may be an economy that needs bubbles just to achieve something near full employment – that in the absence of bubbles the economy has a negative natural rate of interest. And this hasn’t just been true since the 2008 financial crisis; it has arguably been true, although perhaps with increasing severity, since the 1980s.
Re-enter the redoubtable “liquidity trap” stage left.
Summers and Krugman move at a fairly abstract and theoretical level, regarding asset bubbles and the current manifestation.
But more and more, the global financial press points the finger at the US Federal Reserve and its Quantitative Easing (QE) as the cause of emerging bubbles around the world.
One of the latest to chime in is the Chinese financial magazine Caixin with Heading Toward a Cliff.
The Fed’s QE policy has caused a gigantic liquidity bubble in the global economy, especially in emerging economies and asset markets. The improvement in the global economy since 2008 is a bubble phenomenon, centering around the demand from bubble goods or wealth effect. Hence, real Fed tightening would prick the bubble and trigger another recession. This is why some talk of the Fed tightening could trigger the global economy to trend down…
The odds are that the world is experiencing a bigger bubble than the one that unleashed the 2008 Global Financial Crisis. The United States’ household net wealth is much higher than at the peak in the last bubble. China’s property rental yields are similar to what Japan experienced at the peak of its property bubble. The biggest part of today’s bubble is in government bonds valued at about 100 percent of global GDP. Such a vast amount of assets is priced at a negative real yield. Its low yield also benefits other borrowers. My guesstimate is that this bubble subsidizes debtors to the tune of 10 percent of GDP or US$ 7 trillion dollars per annum. The transfer of income from savers to debtors has never happened on such a vast scale, not even close. This is the reason that so many bubbles are forming around the world, because speculation is viewed as an escape route for savers.The property market in emerging economies is the second-largest bubble. It is probably 100 percent overvalued. My guesstimate is that it is US$ 50 trillion overvalued.Stocks, especially in the United States, are significantly overvalued too. The overvaluation could be one-third or about US$ 20 trillion.There are other bubbles too. Credit risk, for example, is underpriced. The art market is bubbly again. These bubbles are not significant compared to the big three above.
The Caixin author – Andy Xie – goes on to predict inflation as the eventual outcome – a prediction I find far-fetched given the coming reaction to Fed tapering.
And the reach of the Chinese real estate bubble is highlighted by a CBS 60 Minutes video filmed some months ago.
Anatomy of a Bubble
The Great Recession of 2008-2009 alerted us – what goes up, can come down. But are there common patterns in asset bubbles? Can the identification of these patterns help predict the peak and subsequent point of rapid decline?
Macrotrends is an interesting resource in this regard. The following is a screenshot of a Macrotrends chart which, in the original, has interactive features.
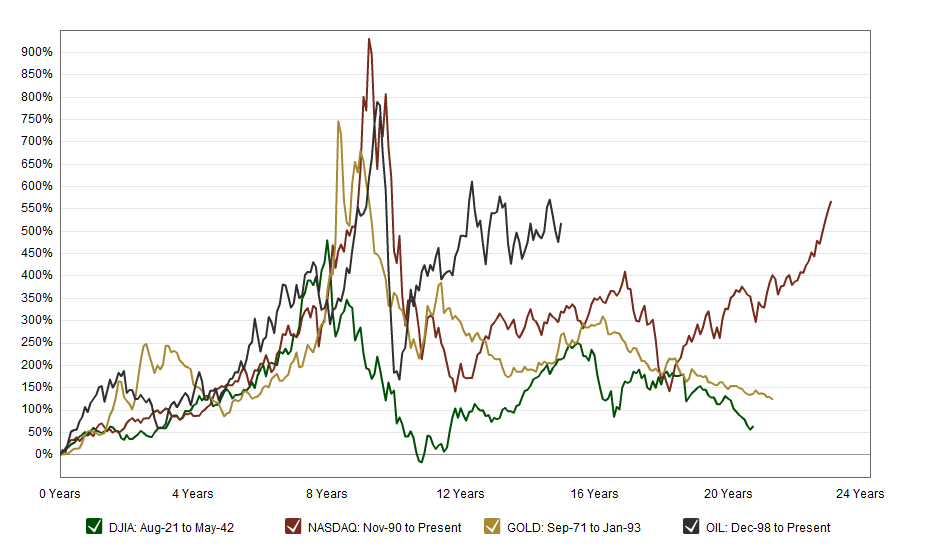
Scaling the NASDAQ, gold, and oil prices in terms of percentage changes from points several years preceding price peaks suggests bubbles share the same cadence, in some sense.
These curves highlight that asset bubbles can occur over significant periods – several years to a decade. This is the part of the seduction. At first, when commentators cry “bubble,” prudent investors stand aside to let prices peak and crash. Yet prices may continue to rise for years, leaving investors increasingly feeling they are “being left behind.”
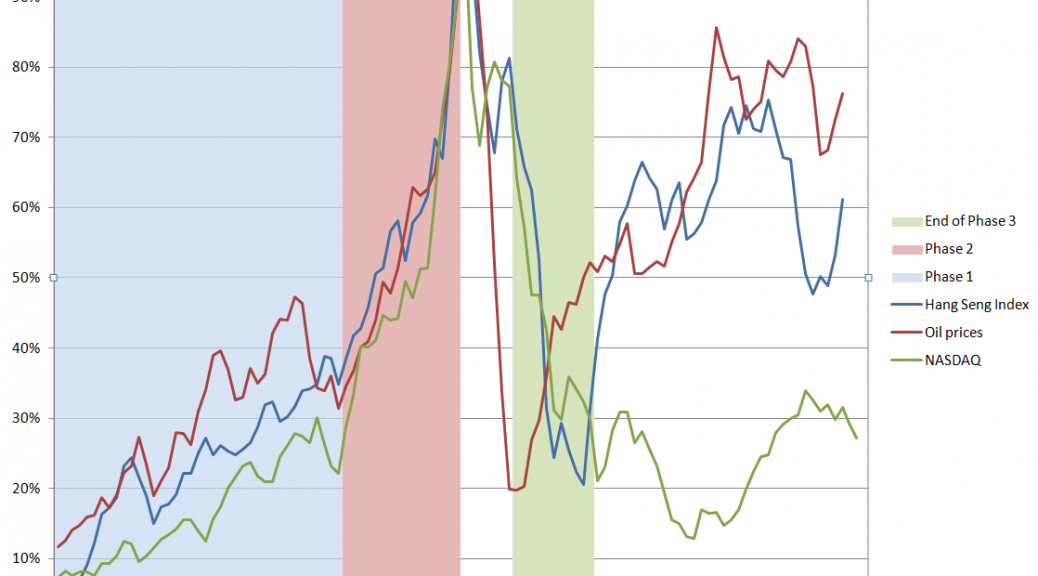
Here are data from three asset bubbles – the Hong Kong Hang Seng Index, oil prices to refiners (combined), and the NASDAQ 100 Index. Click to enlarge.
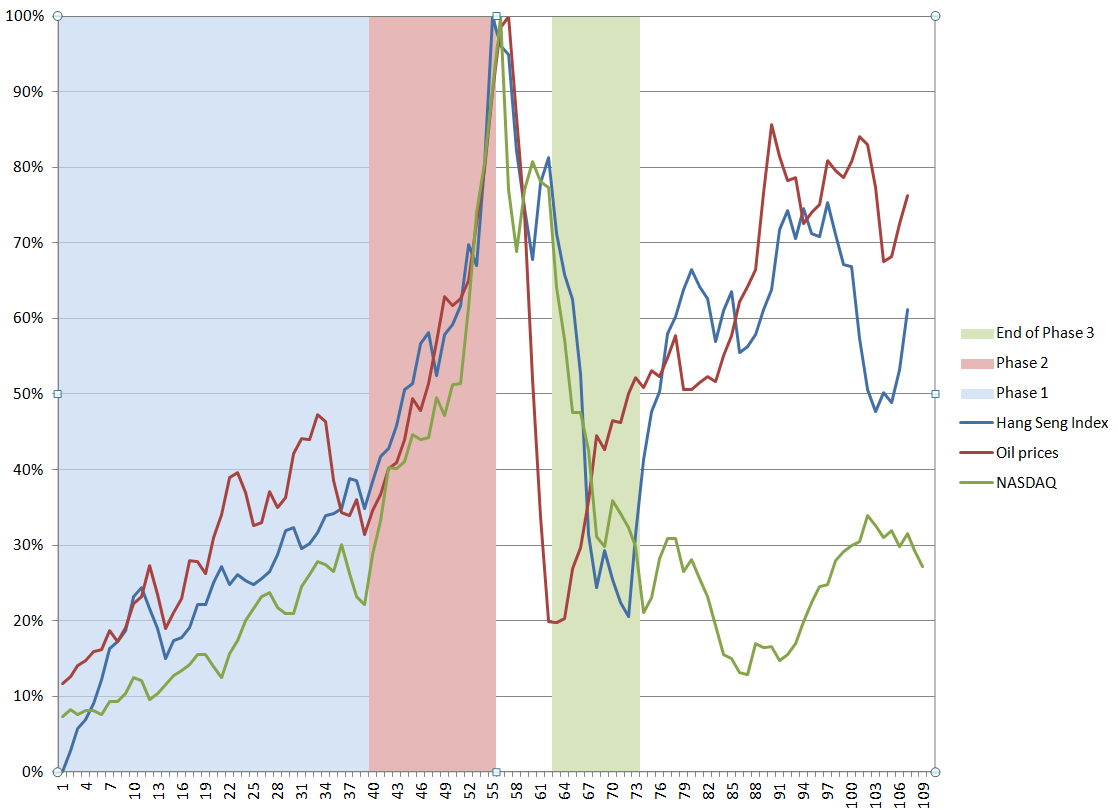
I arrange these time series so their peak prices – the peak of the bubble – coincide, despite the fact that these peaks occurred at different historical times (October 2007, August 2008, March 2000, respectively).
I include approximately 5 years of prior values of each time series, and scale the vertical dimensions so the peaks equal 100 percent.
This produces a chart which suggests three distinct phases to an asset bubble.
Phase 1 is a ramp-up. In this initial phase, prices surge for 2-3 years, then experience a relatively minor drop.
Phase 2 is the beginning of a sustained period of faster-than-exponential growth, culminating in the market peak, followed immediately by the market collapse. Within a few months of the peak, the rates of growth of prices in all three series are quite similar, indeed almost identical. These rates of price growth are associated with “an accelerating acceleration” of growth, in fact – as a study of first and second differences of the rates of growth show.
The critical time point, at which peak price occurs, looks like the point at which traders can see the vertical asymptote just a month or two in front of them, given the underlying dynamics.
Phase 3 is the market collapse. Prices drop maybe 80 percent of the value they rose from the initial point, and rapidly – in the course of 1-2 years. This is sometimes modeled as a “negative bubble.” It is commonly considered that the correction overshoots, and then adjusts back.
There also seems to be a Phase 4, when prices can recover some or perhaps almost all of their lost glory, but where volatility can be substantial.
Predictability
It seems reasonable that the critical point, or peak price, should be more or less predictable, a few months into Phase 2.
The extent of the drop from the peak in Phase 3 seems more or less predictable, also.
The question really is whether the dynamics of Phase 1 are truly informative. Is there something going on in Phase 1 that is different than in immediately preceding periods? Phase 1 seems to “set the stage.”
But there is no question the lure of quick riches involved in the advanced stages of an asset bubble can dazzle the most intelligent among us – and as a case in point, I give you Sir Isaac Newton, co-inventor with Liebnitz of the calculus, discoverer of the law of gravitation, and exponent of a vast new science, in his time, of mathematical physics.

A post on Business Insider highlights his unhappy case with the South Seas stock bubble. Newton was in this scam early, and then got out. But the Bubble kept levitating, so he entered the market again near the top – in Didier Sornette’s terminology, near the critical point of the process, only to lose what in his time was vast fortune of worth $2.4 million dollars in today’s money.