Category Archives: global business forecasts

Video Friday – the Outlook for the Rest of the Year

Here is the latest Wells Fargo economic outlook video, featuring John Silvia – one of the top forecasters, according to Bloomberg.

 Then, there is David Stockman, reminding us all about geopolitical and financial risks just at the time the Malaysian airliners got shot out of the sky.

Stockman, former Reagan Budget Director and Wall Street operator, has really become what commentators generally call an “iconoclast.”

And, I’m sorry, but I find it most useful to draw opinions from across a wide range. “Triangulation” is my best method to arrive at a perspective on the future.

Seasonal Sales Patterns – Stylized Facts

Seasonal sales patterns in the United States are more or less synchronized with Europe, Japan, China, and, to a lesser extent, the rest of the world.

Here are some stylized facts:

  1. Sales tend to peak at the end of the calendar year. This is the well-known “Christmas effect,” and is a strong enough factor to “cannibalize” demand, to an extent, at the first of the following year.
  2. Sales of final goods tend to be lower – in terms of growth rates and, in some cases, absolutely, in the first calendar quarter of the year.
  3. Supply chain effects, related to pulses of sales of final goods, can be identified for various lines of production depending on production lead times. Semiconductor orders, for example, tend to peak earlier than sales of consumer electronics, which are sharply influenced by the Christmas season.

To validate this picture, let me offer some evidence.

First, consider retail and food service sales data for the US, a benchmark of consumer activity – the recently discussed data downloaded from FRED.

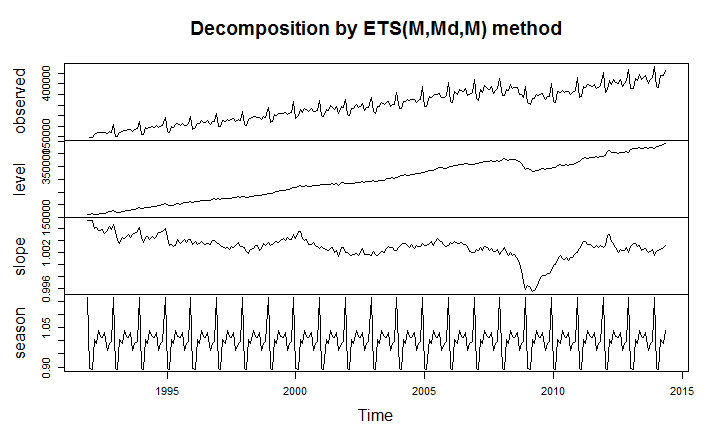
Applying the automatic model selection of the Hyndman R Forecast package, we get a decomposition of this time series into level, trend, and seasonals, as shown in the following diagram.

Rplotrs

The optimal exponential smoothing forecast model is a model with a damped trend and multiplicative seasonals.

If we look at the lower part of this diagram, we see that the seasonal factor for December – which is shown by the major peaks in the curve – is a multiple of more than 1.15. On the other hand, the immediately following month – January – shows a multiple of 0.9. These factors are multiplied into the product of the level and trend to get the sales for December and January. In other words, you can suppose that, roughly speaking, December retail sales will be 15 percent above trend, while January sales will be 90 percent of trend.

And, if you inspect this diagram in the lower panel carefully, you can detect the lull in late summer and fall in retail sales.

With “just-in-time” inventories and lean production models, actual production activity closely tracks these patterns in final demand – although it does take some lead time to produce stuff.

These stylized facts have not changed in their outlines since the ground-breaking research of Jeffrey Miron in the the late 1980’s. Miron refers to a worldwide seasonal cycle in aggregate economic activity whose major features are a fourth quarter boom in output.., a third quarter trough in manufacturing production, and a first quarter trough in all economic activity.

The Effects of Different Calendars – the Chinese New Year and Ramadan

The Gregorian calendar has achieved worldwide authority, and almost every country follows on the conventions of counting the year (currently 2014).

The Chinese calendar, however, is still important for determining the timing of festivals for Chinese communities around the world, and, especially, in China.

GRAPHICS TEMPLATE 2006

Similarly, the Islamic calendar governs the timing of important ritual periods and religious festivals – such as the month of Ramadan, which falls in June and July in 2014.

Because these festival periods overlap with multiple Gregorian months, there can be significant localized impacts on estimates of seasonal variation of economic activity.

Taiwanese researchers looking at this issue find significant holiday effects, related the fact that,

The three most important Chinese holidays, Chinese New Year, the Dragon-boat Festival, and Mid-Autumn Holiday have dates determined by a lunar calendar and move between two solar months. Consumption, production, and other economic behavior in countries with large Chinese population including Taiwan are strongly affected by these holidays. For example, production accelerates before lunar new year, almost completely stops during the holidays and gradually rises to an average level after the holidays.

Similarly, researchers in Pakistan consider the impacts of the Islamic festivals on standard macroeconomic and financial time series.

Mid-Year Economic Projections and Some Fireworks

Greetings and Happy Fourth of July! Always one of my favorite holidays.

Practically every American kid loves the Fourth, because there are fireworks. Of course, back in the day, we had cherry bombs and really big firecrackers. Lots of thumbs and fingers were blown off. But it’s still fun for kids, and safer no doubt.

Before that, here are two mid-year forecasts from Goldman Sachs’ Chief Economist Jan Hatzius and an equity outlook from Wells Fargo Bank.

Jan Hatzius Goldman Sachs – mid-year forecast (June 12) 

And Wells Fargo (June 23rd). 

Both these, unfortunately, did not have the information about the additional write-down of the 1st quarter real GDP that came out June 25, so we will be looking for futher updates.

Meanwhile, some fireworks.

First, Happy Fourth from the US Navy. 

And some ordinary fireworks from the National Mall, US Capitol, 2012. 

Surprising Revision of First Quarter GDP

I showed a relative this blog a couple of days ago, and, wanting “something spicy,” I pulled up The Record of Failure to Predict Recessions is Virtually Unblemished. The lead picture, as for this post, is Peter Sellers in his role as “Chauncey Gardiner” in Being There. Sellers played a simpleton mistaken for a savant, who would say things that everyone thought was brilliant, such as “There will be growth in the Spring.”

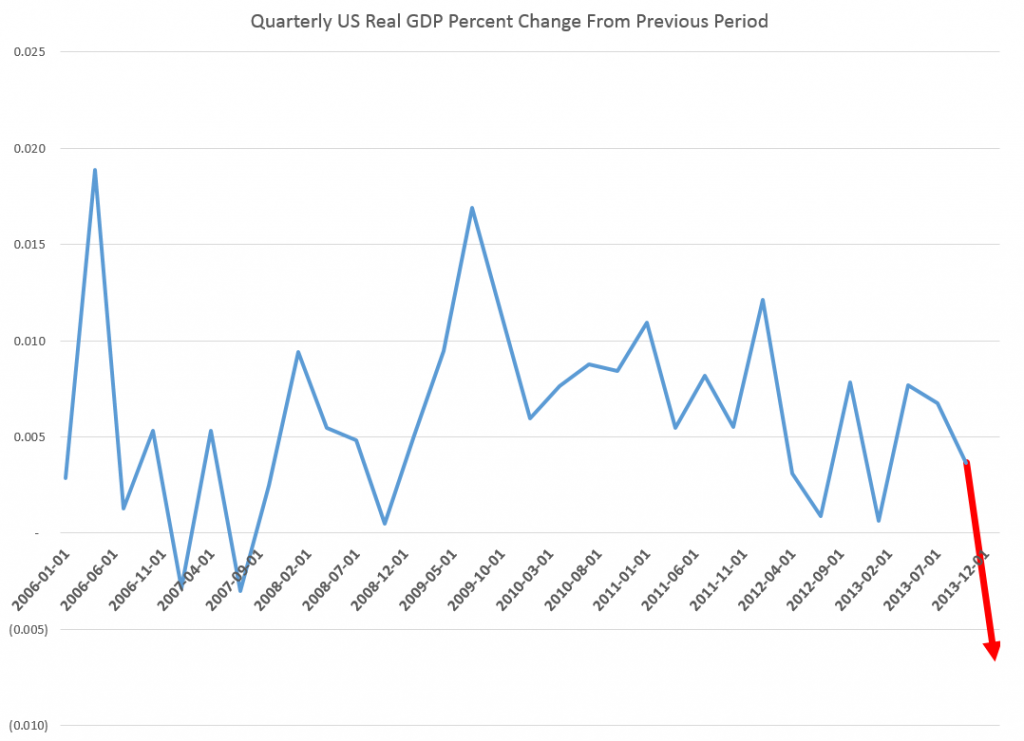
Well, last Wednesday, the US Bureau of Economic Analysis released a third revision of its estimate of the 1st quarter 2014 real GDP growthdown from an initial estimate of a positive .1 percent to -2.9 percent growth at an annual rate.

The BEA News Release says,

Real gross domestic product — the output of goods and services produced by labor and property located in the United States — decreased at an annual rate of 2.9 percent in the first quarter of 2014 according to the “third” estimate released by the Bureau of Economic Analysis….

The decrease in real GDP in the first quarter primarily reflected negative contributions from private inventory investment, exports, state and local government spending, nonresidential fixed investment, and residential fixed investment that were partly offset by a positive contribution from PCE. Imports, which are a subtraction in the calculation of GDP, increased.

Looking at this graph of quarterly real GDP growth rates for the past several years, it’s clear that a -2.9 percent quarter-over-quarter change is a significant size.

usgdpchartcustom

Again, macroeconomic forecasters were caught off guard.

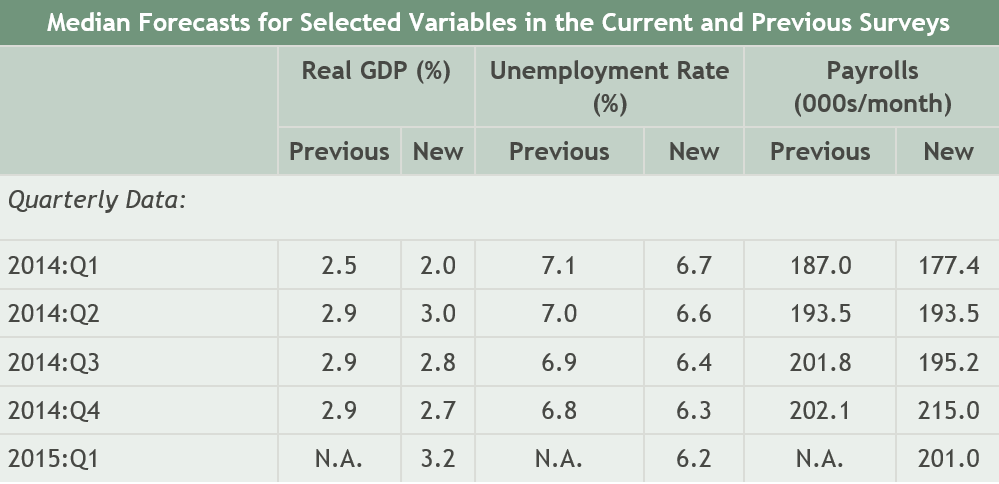
In February of this year, the Survey of Professional Forecasters released its 1st Quarter 2014 consensus forecasts with numbers like –

SPF

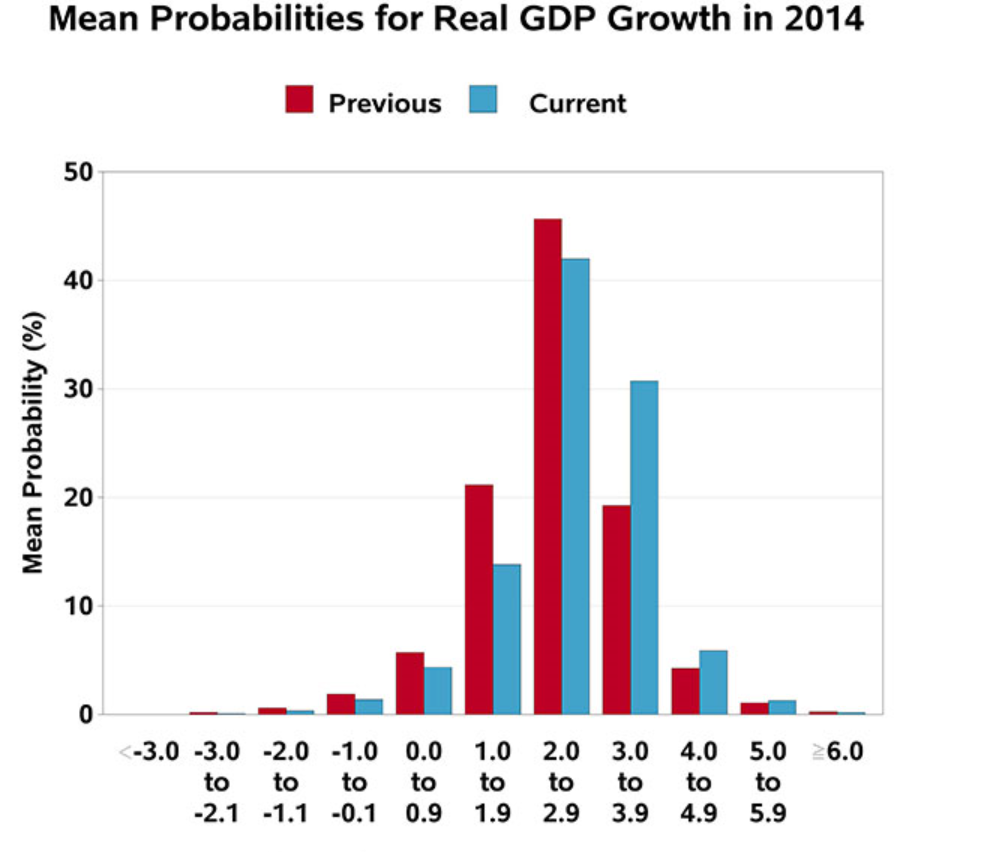
Some SPF participants do predict 2014 overall will be a year of recession, as the following chart shows, but they are a tiny minority.

spfrange

A downward revision of almost 3 percentage points on the part of the BEA and almost 5 percent change for the median SPF forecast is poor performance indeed.

One hears things sped up in Q2, but on what basis I do not really know – and I am thinking of tracking key markets in future posts, such as housing, consumer spending, and so forth.

My feeling is that the quandary of the Fed – its desperate need to wind down asset purchases and restore interest rates to historic levels –creates an environment for a kind of “happy talk.”

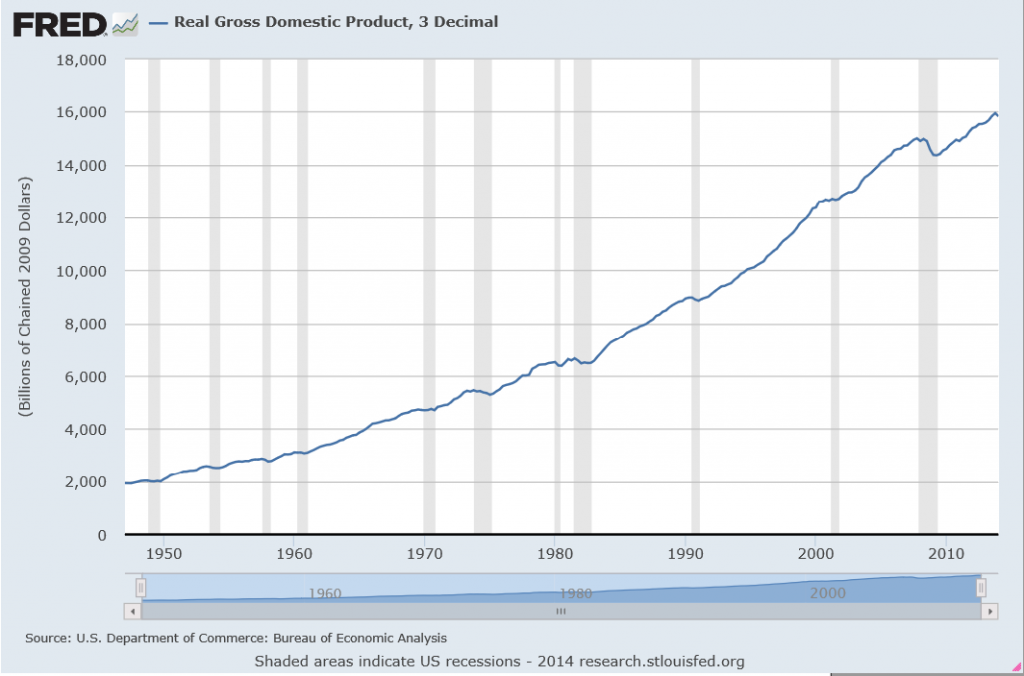
Here’s some history on the real GDP.

USGDPnew


Energy Forecasts – the Controversy

Here’s a forecasting controversy that has analysts in the Kremlin, Beijing, Venezuela, and certainly in the US environmental community taking note.

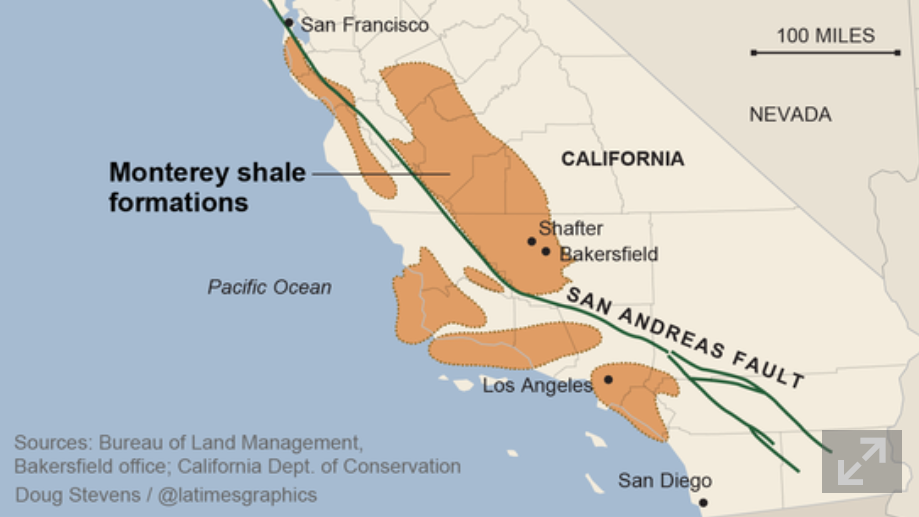
May 21st, Reuters ran a story UPDATE 2-U.S. EIA cuts recoverable Monterey shale oil estimate by 96 pct from 15.4 billion to 600 million barrels.

Monterey

The next day the Guardian took up the thread with Write-down of two-thirds of US shale oil explodes fracking myth. This article took a hammer to findings of a USC March 2013 study which claimed huge economic benefits for California pursuing advanced extraction technologies in the Monterey Formation (The Monterey Shale & California’s Economic Future).

But wait. Every year the US Energy Information Agency (EIA) releases its Annual Energy Outlook about this time of the year.

Strangely, the just-released Annual Energy Outlook 2014 With Projections to 2014 do not show any cutback in shale oil production projections.

Quite the contrary –

The downgrade [did] not impact near term production in the Monterey, estimates of which have increased to 57,000 barrels per day on average between 2010 and 2040.. Last year’s estimate for 2010 to 2040 was 14,000 barrels per day.

The head of the EIA, Adam Sieminski, in emails with industry sources, emphasizes Technically Recoverable Reserves (TRR) are not (somehow) not linked with estimates of actual production.

At the same time, some claim the boom is actually a bubble.

What’s the bottom line here?

It’s going to take a deep dive into documents. The 2014 Energy Outlook is 269 pages long, and it’s probably necessary to dig into several years reports. I’m hoping someone has done this. But I want to followup on this story.

How did the Monterey Formation reserve estimates get so overblown? How can taking such a huge volume of reserves out of the immediate future not affect production estimates for the next decade or two? What is the typical accuracy of the EIA energy projections anyway?

According to the EIA, the US will briefly – for a decade or two – be energy independent, because of shale oil and other nonstandard fossil fuel sources. This looms even larger with geopolitical developments in Crimea, the Ukraine, Europe’s dependence on Russian natural gas supplies, and the recently concluded agreements between Russia and China.

It’s a great example of how politics can enter into forecasting, or vice versa.

Coming Attractions

While shale/fracking and the global geopolitics of natural gas are hot stories, there is a lot more to the topic of energy forecasting.

Electric power planning is a rich source of challenges for forecasting – from short term load forecasts identifying seasonal patterns of usage. Real innovation can be found here.

And what about peak oil? Was that just another temporary delusion in the energy futures discussion?

I hope to put up posts on these sorts of questions in coming days.

The Next Recession – Will It Be A Global Meltdown?

One my focuses is the global economy and any cracks in the firmament which might presage the next recession. I rely a lot on my Twitter account to keep me on the crest of the wave, in this regard.

I’m really concerned, as are many of my colleagues and contacts in business and government.

We’ve hardly escaped the effects of last recession 2008-2009. Those are US dates, of course, set by the National Bureau of Economic Research (NBER) the official recession “dater” in this country.

There have been a series of rolling impacts and consequences of this so-called “Great Recession.”

Europe

Housing or real estate bubbles were present in Europe, too, particularly in Spain and Ireland. Then, there was the problem of the Greek economy and state, which did not support the level of public debt that had been garnered by, in some cases, corrupt public officials. And European problems were complicated by the currency union of the euro in a context where there is not, as yet, a centralized EU state. Anyway, not to reprise the whole matter blow-by-blow, but most of Europe, with the exception of Germany, plunged into recession and struggled with austerity policies that made things worse for Main Street or, as they like to say in Britain, “High Street.”

Many European countries are just now coming out of recession, and overall, the growth rate in the EU area is almost indistinguishable from zero.

So another recession in the next one to two years would really set them back.

China

Part of the problem China has been experiencing is related to the persisting downturn in most of Europe, since Europe is a big trading partner. And so, for that matter is the United States, which bought less from China during the recession years.

But another problem is that China now is experiencing a mojo big property bubble of its own.

Newly wealthy Chinese do not really have any place to put their money, except real estate. The Chinese, like the Japanese, are big savers, and for many middle class families, buying the second apartment or even a house is an investment for the future. Yet Chinese real estate prices have skyrocketed, leaving the average Chinese wage earner in the dust, with less and less hope of ever owning a residence.

Apparently, in connection with this real estate speculation, a large shadow banking system has emerged. Some estimates circulate on Twitter suggesting this rivals the size of the official Chinese banking system.

Can “market socialism” or “market Leninism” experience a financial crisis, based on too many debts that cannot be paid?

I’ve been to China a few times, and done some business there – all the while trying to understand how things are set up. My feeling is that one should not impute banking practices that seem pro forma in, say, Great Britain or the US, to the Chinese. I think they are much more ready to “break the rules” in order to keep the party going (which is sort of a pun).

Having said that, I do think a Chinese crisis could develop if property values collapse, as they are wont to do in bubble mode.

Again, it’s hard to say how this might play out, since the victims and suffering would be among the nouveau riche of China, of whom there are millions, and many more average families who have invested their nest egg in a hot property.

But I can’t think that collapse of real estate values in modern China would not have worldwide repurcussions.

The Rest of the World

Regrettably, I cannot go through other major regions, one-by-one, but I’d have to say that things are not so good. The BRIC’s as a group all have more problems than a few years back, when they were hailed as the bright new centers of economic growth by that Goldman Sachs analyst. That’s Brazil, Russia, India, and China, of course.

Possibilities of Increased Conflict

There is a kind of axiom of geopolitics and social interaction that when the pie is growing and everybody can get more, even though their slice may not have been very big to begin with, there is a tendency for people to make do, go about their business and so forth. Reverse this and you have the concept that shrinking the pie – as austerity policies and the Great Recession have done – tends to increase levels of conflict. At first, to the extent that people have the idea that “we are all in this together” there may be increased cooperation. But that is not the current situation in almost any society. Quite the contrary, as Piketty and the Occupy Movement highlight, there is growing awareness of inequality of wealth and income.

There are armed conflicts in Syria, the Ukraine, Afghanistan (resurgent Taliban), and areas and regions in Africa. The Indian elections recently installed a Hindu nationalist who hopefully will be a reformer, but may, if the going gets tough, revert or acquiesce to more conflict with Pakistan and with non-Hindu populations within India. Pakistan, one of the world’s nuclear powers, appears to be extremely unstable politically. There are deep civil divisions in Thailand between city and rural areas that parallel class divisions. China is flexing its muscles in the South China Sea.

And we may be moving from an era of US-centric global capitalism to a time when the Eurasian supercontinent will become significantly more important and perhaps decoupled from Wall Street and the City of London. Already, there are threats to dollar supremacy, and, historically, as US economic power is eclipsed by the more rapidly growing economies of Asia, some adjustment seems predictable.

In all this, Hollywood can be counted on to roll out some really corking new international intrigue films, perhaps (although I doubt it) with more complex plots.

The Situation with the US Federal Reserve Bank

The point of this international survey and reprise of recent business history is to highlight areas where surprises may originate, shaking the markets, and perhaps triggering the next recession.

But the most likely suspect is the US Federal Reserve Bank.

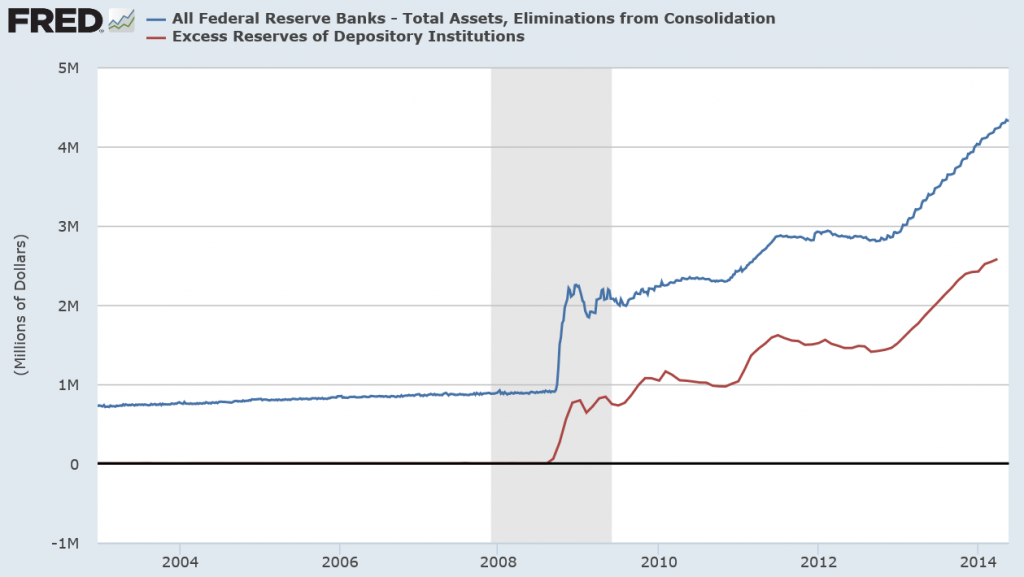
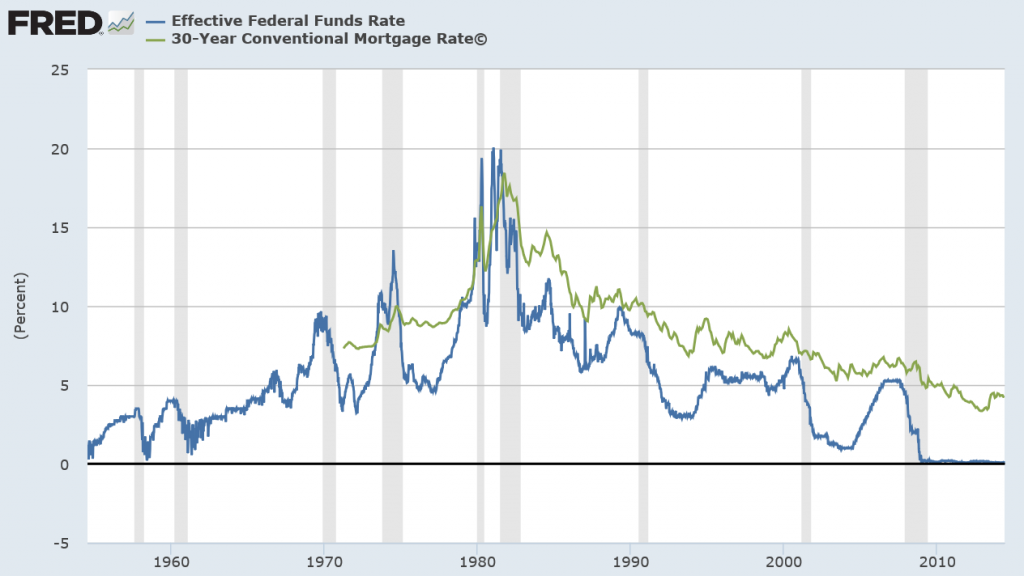
Two graphs speak volumes.
interestratesnew

Fedassets

Seeking to encourage economic recovery, the US Federal Reserve dropped the federal funds rate to a number effectively almost zero – a historically low number. This zero bound federal funds rate has persisted since the end of 2009, or for about five years.

The Fed also has engaged in new policies, whereby it goes into private bond markets and buys long term bonds – primarily mortgage-backed securities. The second chart tracks this inasmuch as a good portion of the more than 4 trillion in Fed assets (for which there are corresponding liabilities, of course) are these mortgage-backed securities. In effect, the Fed has purchased a sizeable portion of the US housing market – one might say “nationalize” except that would be forgetting the fact that the Fed is actually a private institution whose governance is appointed by the Executive Branch of the US government.

In any case, this bond-buying is the famous “quantitative easing” (QE) and is mirrored in the accumulation of excess reserves by the banking system. Generally, that is, banks and financial institutions issue mortgages, sell them among themselves to be packaged in mortgage-backed securities, and the Fed has been buying these.

Banks can easily loan these excess reserves, but they consistently have not. Why is an interesting question beyond the scope of this discussion, but the consequence is that the Fed’s actions are “firewalled” from increasing the rate of inflation, which is what ordinarily you might think would occur given that various metrics of money supply also have surged upward.

Now “Fed-watching” is its own little cottage industry among financial commentators, and I am not going to second-guess the media here. The Fed has announced a plan to “taper” these purchases of long term bonds. This is likely to increase the mortgage rates and, probably to some extent, based on expectations already has.

So, the long and the short of it are that this set of policies – zero federal funds rate and bond buying cannot go on forever.

If economic growth has been low-grade since 2010 with these low interest rates, what is the reasonable outlook for a higher interest rate regime?

Timing of the Next Recession

When is the most likely time for a recession, for example? Would it be later in 2014, in 2015, or thereafter, maybe in 2016.

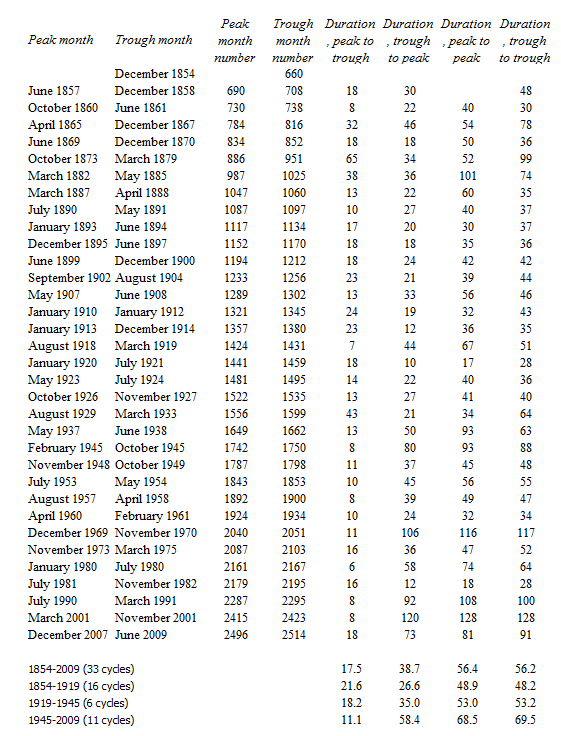
Here is a table of all the recessions in the US since the middle 1850’s along with facts about their duration (source: NBER).
NBERRecess

Without even considering averages, the maximum period of trough to trough – that is, from the bottom of one recession to the bottom of the next – has been 128 months or ten years and eight months. Here, incidentally, the month numbers begin January 1800, for what that’s worth.

Thus, at the outside, based on these empirics, the trough of the next recession is likely to occur no later than early 2020.

Note that we have already blown through the average length from trough to trough of about 58.4 months or about five years from June 2009.

On a simple probabilistic basis, therefore, we are moving into the tail of the distribution of business cycle durations, suggesting that the chances of a downturn are in some sense already above 50 percent.

And note that the experience of the current business recovery is nothing like this historically maximum span in the 1990’s between the trough of the recession of 1990-1991 and the trough of November 2001.

This business recovery persistently seems to move ahead just above or, in the last quarter of 2013, below “stall speed.”

Seemingly, a fairly minor perturbation could set off a chain reaction, given the advanced frothiness in the stock market and softness in housing prices.

More of the Same, Worse

Neil Baroifsky was special inspector with oversight authority for the TARP during the bailout phase of the Great Recession, and currently is a partner in the Litigation Department of national law firm Jenner & Block LLP.

He’s also an author and often is called on for his opinion about developments in malfeasance writ large among the finance giants – such as the Credit Suisse settlement. In connection with a recent NPR interview, Barofsky said,

Although it is good that we averted a catastrophe back in 2008, the way that we did so I believe has unfortunately set the stage for an even more devastating financial crisis in the future.

HOBSON: In the future? How far?

BAROFSKY: Well, if I knew that, Michael Lewis would be writing his next book about people who made billions on timing the markets perfectly about me, which would be great.

(LAUGHTER)

BAROFSKY: But if you look, a lot of the same broken incentives from 2008 are still there. It’s just a question of when, not if. You can’t look at the fundamental broken incentives in the financial system and really come to a conclusion other than that we’re headed down the same dangerous path that we were that culminated in the explosion of ’08.

Barofsky’s point is readily supported by facts, such as –

The US and global financial system is even more concentrated today than in 2007, making “too big to fail”and even bigger potential problem now, than before the Great Recession. Even Alan Greenspan has taken note.

And the “pass the buck” system, whereby bond rating agencies are paid by the originators to evaluate exotic securities (“financial innovations”) created by the banking and shadow banking industries, securities which are then passed on to pension funds and hapless investors – this system appears to still be completely in place. Talk about the concept of “moral hazard.”

Global Impact

I think you get the picture.

For one reason or another, some fairly minor event is likely to set off a cascade of consequences in US and global financial markets, leading to the next recession. Probably, within one, two, or three years, as a matter of fact. Because the US Fed, and, for that matter, other central banks will still be working their way out of the last recession, there may be fewer “policy tools” to halt the stampede to sell, cutback, and so forth. Governments could respond with aggressive fiscal policy, but that option appears limited unless there are major changes in the political climate in the US and Europe.

Personally, I think wholly new directions of policy should be contemplated at the personal, local, regional, and of course at national levels.

We need to create what I have started to call “islands of stability.” This is the old idea of local self-reliance, but in new packaging. I really think there should be discussions widely across the US at least about how to decouple from the global economy and, indeed, from the financial concentrations on Wall Street. As a matter of self-preservation, until such time as more courageous national policies can be undertaken to reign in such obvious risks.

Credit Spreads As Predictors of Real-Time Economic Activity

Several distinguished macroeconomic researchers, including Ben Bernanke, highlight the predictive power of the “paper-bill” spread.

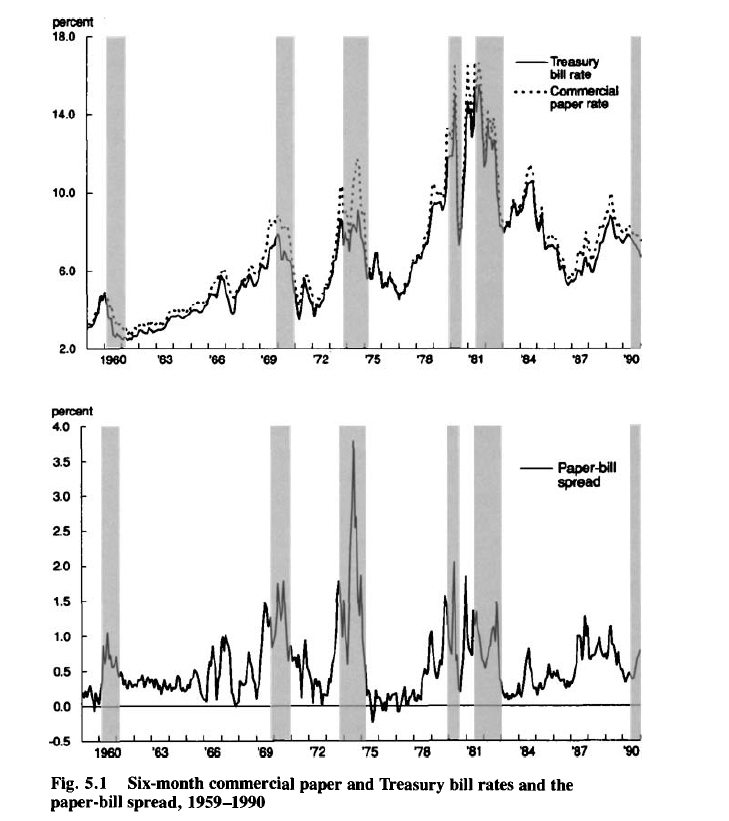
The following graphs, from a 1993 article by Benjamin M. Friedman and Kenneth N. Kuttner, show the promise of credit spreads in forecasting recessions – indicated by the shaded blocks in the charts.

CPTBspread

Credit spreads, of course, are the differences in yields between various corporate debt instruments and government securities of comparable maturity.

The classic credit spread illustrated above is the difference between six-month commercial paper rates and 6 month Treasury bill rates.

Recent Research

More recent research underlines the importance of building up credit spreads from metrics relating to individual corporate bonds , rather than a mishmash of bonds with different duration, credit risk and other characteristics.

Credit Spreads as Predictors of Real-Time Economic Activity: A Bayesian Model-Averaging Approach is key research in this regard.

The authors first note that,

the “paper-bill” spread—the difference between yields on nonfinancial commercial paper and comparable-maturity Treasury bills—had substantial forecasting power for economic activity during the 1970s and the 1980s, but its predictive ability vanished in the subsequent decade

They then acknowledge that credit spreads based on indexes of speculative-grade or “junk” corporate bonds work fairly well for the 1990s, but their performance is uneven.

Accordingly, Faust, Gilchrist, Wright, and Zakrajsek (GYZ) write that

In part to address these problems, GYZ constructed 20 monthly credit spread indexes for different maturity and credit risk categories using secondary market prices of individual senior unsecured corporate bonds.. [measuring]..the underlying credit risk by the issuer’s expected default frequency (EDF™), a market-based default-risk indicator calculated by Moody’s/KMV that is more timely that the issuer’s credit rating]

Their findings indicate that these credit spread indexes have substantial predictive power, at both short- and longer-term horizons, for the growth of payroll employment and industrial production. Moreover, they significantly outperform the predictive ability of the standard default-risk indicators, a result that suggests that using “cleaner” measures of credit spreads may, indeed, lead to more accurate forecasts of economic activity.

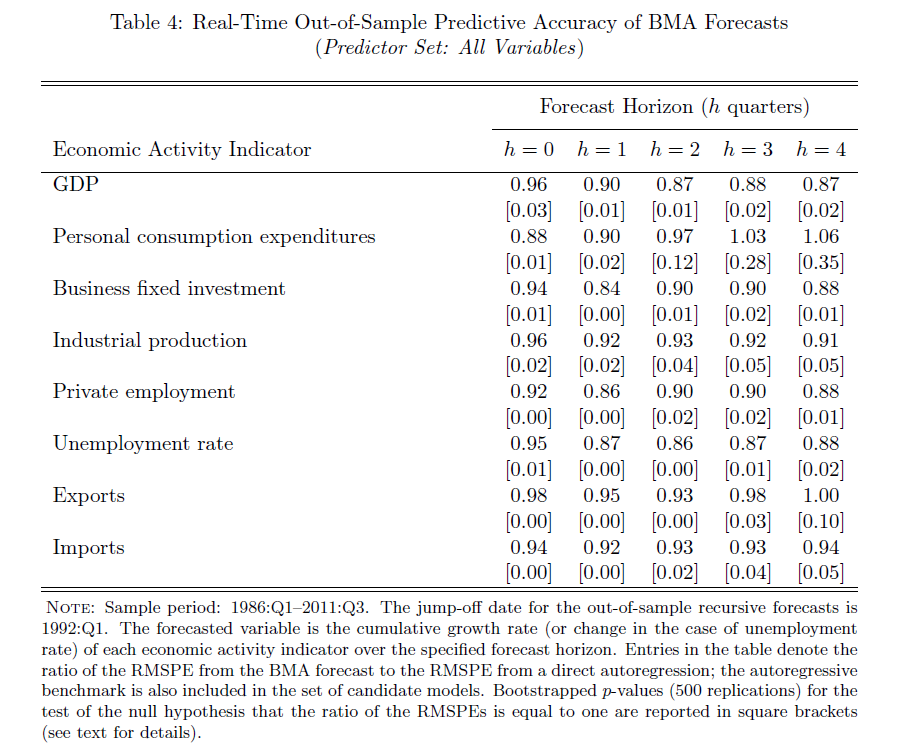
Their research applies credit spreads constructed from the ground up, as it were, to out-of-sample forecasts of

…real economic activity, as measured by real GDP, real personal consumption expenditures (PCE), real business fixed investment, industrial production, private payroll employment, the civilian unemployment rate, real exports, and real imports over the period from 1986:Q1 to 2011:Q3. All of these series are in quarter-over-quarter growth rates (actually 400 times log first differences), except for the unemployment rate, which is simply in first differences

The results are forecasts which significantly beat univariate (autoregressive) model forecass, as shown in the following table.

Cspreadresults

Here BMA is an abbreviation for Bayesian Model Averaging, the author’s method of incorporating these calculated credit spreads in predictive relationships.

Additional research validates the usefulness of credit spreads so constructed for predicting macroeconomic dynamics in several European economies –

We find that credit spreads and excess bond premiums, when used alongside monetary policy tightness indicators and leading indicators of economic performance, are highly significant for predicting the growth in the index of industrial production, employment growth, the unemployment rate and real GDP growth at horizons ranging from one quarter to two years ahead. These results are confirmed for individual countries in the euroarea and for the United Kingdom, and are robust to different measures of the credit spread. It is the unpredictable part associated with the excess bond premium that has greater influence on real activity compared to the predictable part of the credit spread. The implications of our results are that careful selection of the bonds used to construct the credit spreads, excluding those with embedded options and or illiquid secondary markets, delivers a robust indicator of financial market tightness that is distinct from tightness due to monetary policy measures or leading indicators of economic activity.

The Situation Today

A Morgan Stanley Credit Report for fixed income, released March 21, 2014, notes that

Spreads in both IG and HY are at the lowest levels we have seen since 2007, roughly 110bp for IG and 415bp for HY. A question we are commonly asked is how much tighter can spreads go in this cycle

So this is definitely something to watch. 

And Now – David Stockman

David Stockman, according to his new website Contra Corner,

is the ultimate Washington insider turned iconoclast. He began his career in Washington as a young man and quickly rose through the ranks of the Republican Party to become the Director of the Office of Management and Budget under President Ronald Reagan. After leaving the White House, Stockman had a 20-year career on Wall Street.

Currently, Stockman takes the contrarian view that the US Federal Reserve Bank is feeding a giant bubble which is bound to collapse

He states his opinions with humor and wit, as some of article titles on Contra Corner indicate –

Fed’s Taper Kabuki is Farce; Gong Show of Cacophony, Confusion and Calamity Coming

Or

General John McCain Strikes Again!

Forecasting the Price of Gold – 1

I’m planning posts on forecasting the price of gold this week. This is an introductory post.

The Question of Price

What is the “price” of gold, or, rather, is there a single, integrated global gold market?

This is partly an anthropological question. Clearly in some locales, perhaps in rural India, people bring their gold jewelry to some local merchant or craftsman, and get widely varying prices. Presumably, though this merchant negotiates with a broker in a larger city of India, and trades at prices which converge to some global average. Very similar considerations apply to interest rates, which are significantly higher at pawnbrokers and so forth.

The World Gold Council uses the London PM fix, which at the time of this writing was $1,379 per troy ounce.

The Wikipedia article on gold fixing recounts the history of this twice daily price setting, dating back, with breaks for wars, to 1919.

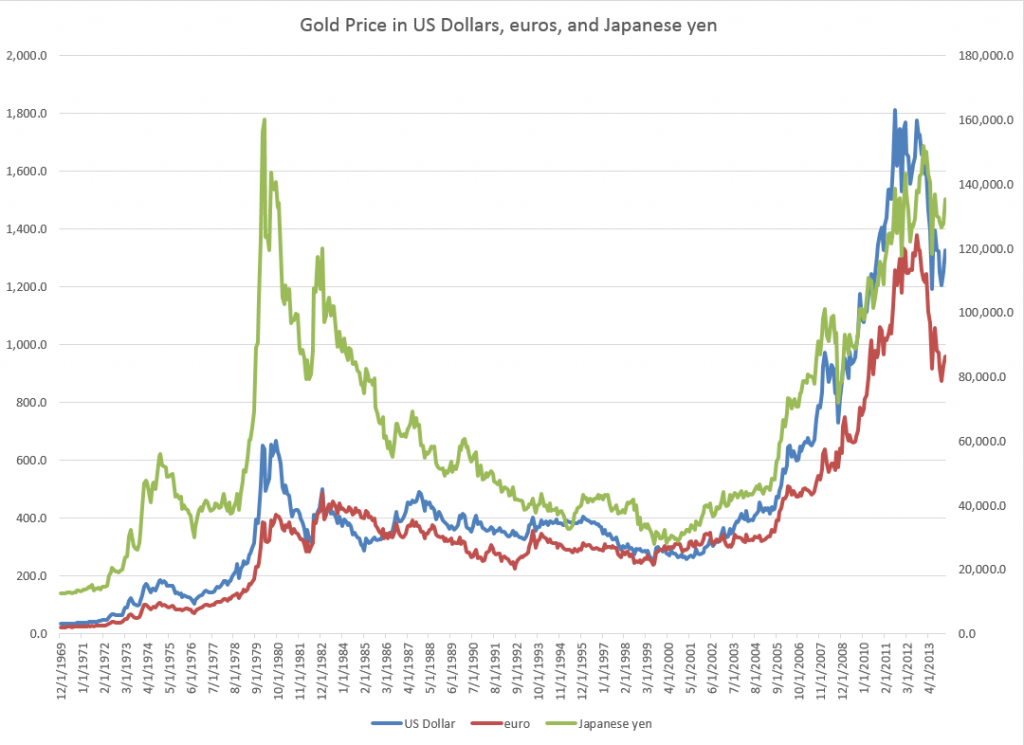
One thing is clear, however. The “price of gold” varies with the currency unit in which it is stated. The World Gold Council, for example, supplies extensive historical data upon registering with them. Here is a chart of the monthly gold prices based on the PM or afternoon fix, dating back to 1970.

Goldprices

Another insight from this chart is that the price of gold may be correlated with the price of oil, which also ramped up at the end of the 1970’s and again in 2007, recovering quickly from the Great Recession in 2008-09 to surge up again by 2010-11.

But that gets ahead of our story.

The Supply and Demand for Gold

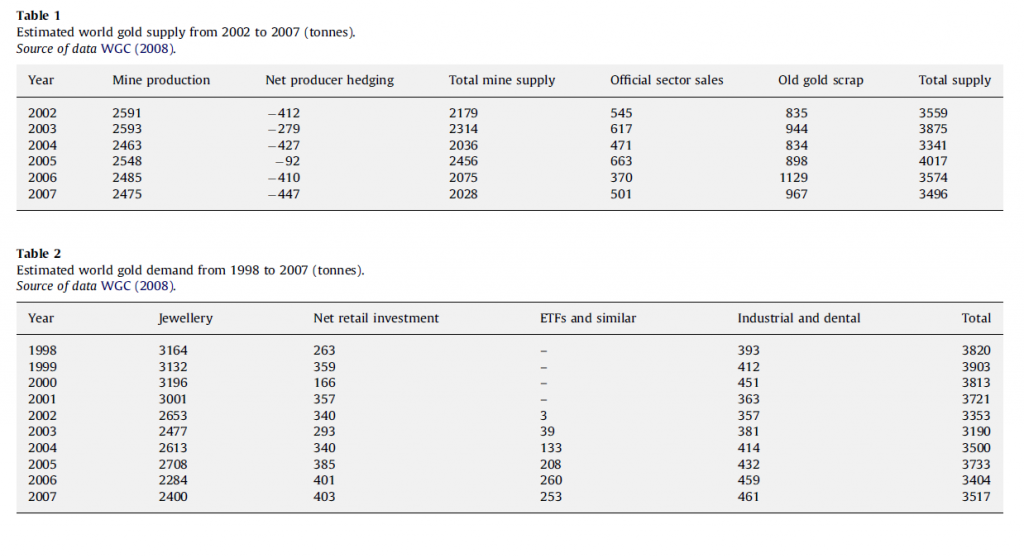
Here are two valuable tables on gold supply and demand fundamentals, based on World Gold Council sources, via an  An overview of global gold market and gold price forecasting. I’ve more to say about the forecasting model in that article, but the descriptive material is helpful (click to enlarge).

Tab1and2These tables give an idea of the main components of gold supply and demand over a several years recently.

Gold is an unusual commodity in that one of its primary demand components – jewelry – can contribute to the supply-side. Thus, gold is in some sense renewable and recyclable.

Table 1 above shows the annual supplies in this period in the last decade ran on the order of three to four thousand tonnes, where a tonne is 2,240 pounds and equal conveniently to 1000 kilograms.

Demand for jewelry is a good proportion of this annual supply, with demands by ETF’s or exchange traded funds rising rapidly in this period. The industrial and dental demand is an order of magnitude lower and steady.

One of the basic distinctions is between the monetary versus nonmonetary uses or demands for gold.

In total, central banks held about 30,000 tonnes of gold as reserves in 2008.

Another estimated 30,000 tonnes was held in inventory for industrial uses, with a whopping 100,000 tonnes being held as jewelry.

India and China constitute the largest single countries in terms of consumer holdings of gold, where it clearly functions as a store of value and hedge against uncertainty.

Gold Market Activity

In addition to actual purchases of gold, there are gold futures. The CME Group hosts a website with gold future listings. The site states,

Gold futures are hedging tools for commercial producers and users of gold. They also provide global gold price discovery and opportunities for portfolio diversification. In addition, they: Offer ongoing trading opportunities, since gold prices respond quickly to political and economic events, Serve as an alternative to investing in gold bullion, coins, and mining stocks

Some of these contracts are recorded at exchanges, but it seems the bulk of them are over-the-counter.

A study by the London Bullion Market Association estimates that 10.9bn ounces of gold, worth $15,200bn, changed hands in the first quarter of 2011 just in London’s markets. That’s 125 times the annual output of the world’s gold mines – and twice the quantity of gold that has ever been mined.

The Forecasting Problem

The forecasting problem for gold prices, accordingly, is complex. Extant series for gold prices do exist and underpin a lot of the market activity at central exchanges, but the total volume of contracts and gold exchanging hands is many times the actual physical quantity of the product. And there is a definite political dimension to gold pricing, because of the monetary uses of gold and the actions of central banks increasing and decreasing their reserves.

But the standard approaches to the forecasting problem are the same as can be witnessed in any number of other markets. These include the usual time series methods, focused around arima or autoregressive moving average models and multivariate regression models. More up-to-date tactics revolve around tests of cointegration of time series and VAR models. And, of course, one of the fundamental questions is whether gold prices in their many incarnations are best considered to be a random walk.

Geopolitical Outlook 2014

One service forecasting “staff” can provide executives and managers is a sort of list of global geopolitical risks. This is compelling only at certain times – and 2014 and maybe 2015 seem to be shaping up as one of these periods.

Just a theory, but, in my opinion, the sustained lackluster economic performance in the global economy, especially in Europe and also, by historic standards, the United States adds fuel to the fire of many conflicts. Conflict intensifies as people fight over an economic pie that is shrinking, or at least, not getting appreciably bigger, despite population growth and the arrival of new generations of young people on the scene.

Some Hotspots

Asia

First, the recent election in Thailand solved nothing, so far. The tally of results looks like it is going to take months – sustaining a kind of political vacuum after many violent protests. Economic growth is impacted, and the situation looks to be fluid.

But the big issue is whether China is going to experience significantly slower economic growth in 2014-2015, and perhaps some type of debt crisis.

For the first time, we are seeing municipal bond defaults and the run-on effects are not pretty.

The default on a bond payment by China’s Chaori Solar last week signalled a reassessment of credit risk in a market where even high-yielding debt had been seen as carrying an implicit state guarantee. On Tuesday, another solar company announced a second year of net losses, leading to a suspension of its stock and bonds on the Shanghai stock exchange and stoking fears that it, too, may default.

There are internal and external forces at work in the Chinese situation. It’s important to remember lackluster growth in Europe, one of China’s biggest customers, is bound to exert continuing downward pressure on Chinese economic growth.

Chinapic

Michael Pettis addresses some of these issues in his recent post Will emerging markets come back? Concluding that –

Emerging markets may well rebound strongly in the coming months, but any rebound will face the same ugly arithmetic. Ordinary households in too many countries have seen their share of total GDP plunge. Until it rebounds, the global imbalances will only remain in place, and without a global New Deal, the only alternative to weak demand will be soaring debt. Add to this continued political uncertainty, not just in the developing world but also in peripheral Europe, and it is clear that we should expect developing country woes only to get worse over the next two to three years.

Indonesia is experiencing persisting issues with the stability of its currency.

Europe

In general, economic growth in Europe is very slow, tapering to static and negative growth in key economies and the geographic periphery.

The European Commission, the executive arm of the European Union, on Tuesday forecast growth in the 28-county EU at 1.5 per cent this year and 2 per cent in 2015. But growth in the 18 euro zone countries, many of which are weighed down by high debt and lingering austerity, is forecast at only 1.2 per cent this year, up marginally from 1.1 per cent in the previous forecast, and 1.8 per cent next year.

France avoided recession by posting 0.3 % GDP in the final quarter of calendar year 2013.

Since margin of error for real GDP forecasts is on the order of +/- 2 percent, current forecasts are, in many cases, indistinguishable from a prediction of another recession.

And what could cause such a wobble?

Well, possibly increases in natural gas prices, as a result of political conflict between Russia and the west, or perhaps the outbreak of civil war in various eastern European locales?

The Ukraine

The issue of the Ukraine is intensely ideological and politicized and hard to evaluate without devolving into propaganda.

The population of the Ukraine has been in radical decline. Between 1991 and 2011 the Ukrainian population decreased by 11.8%, from 51.6 million to 45.5 million, apparently the result of very low fertility rates and high death rates. Transparency International also rates the Ukraine 144th out of 177th in terms of corruption – with 177th being worst.

ukraine

“Market reforms” such as would come with an International Monetary Fund (IMF) loan package would probably cause further hardship in the industrialized eastern areas of the country.

Stratfor and other emphasize the role of certain “oligarchs” in the Ukraine, operating more or less behind the scenes. I take it these immensely rich individuals in many cases were the beneficiaries of privatization of former state enterprise assets.

The Middle East

Again, politics is supreme. Political alliances between Saudi Arabia and others seeking to overturn Assad in Syria create special conditions, for sure. The successive governments in Egypt, apparently returning to rule by a strongman, are one layer – another layer is the increasingly challenged economic condition in the country – where fuel subsidies are commonly doled out to many citizens. Israel, of course, is a focus of action and reaction, and under Netanyahu is more than ready to rattle the sword. After Iraq and Afghanistan, it seems always possible for conflict to break out in unexpected directions in this region of the world.

A situation seems to be evolving in Turkey, which I do not understand, but may be involved with corruption scandals and spillovers from conflicts not only Syria but also the Crimea.

The United States

A good part of the US TV viewing audience has watched part or all of House of Cards, the dark, intricate story of corruption and intrigue at the highest levels of the US Congress. This show reinforces the view, already widely prevalent, that US politicians are just interested in fund-raising and feathering their own nest, and that they operate more or less in callous disregard or clear antagonism to the welfare of the people at large.

HC

This is really too bad, in a way, since more than ever the US needs people to participate in the political process.

I wonder whether the consequence of this general loss of faith in the powers that be might fall naturally into the laps of more libertarian forces in US politics. State control and policies are so odious – how about trimming back the size of the central government significantly, including its ability to engage in foreign military and espionage escapades? Shades of Ron Paul and maybe his son, Senator Rand Paul of Kentucky. 

South and Central America

Brazil snagged the Summer 2016 Olympics and is rushing to construct an ambitious number of venues around that vast country.

While the United States was absorbed in wars in the Middle East, an indigenous, socialist movement emerged in South American – centered around Venezuela and perhaps Bolivia, or Chile and Argentina. At least in Venezuela, sustaining these left governments after the charismatic leader passes from the scene is proving difficult.

Africa

Observing the ground rule that this sort of inventory has to be fairly easy, in order to be convincing – it seems that conflict is the order of the day across Africa. At the same time, the continent is moving forward, experiencing economic development, dealing with AIDS. Perhaps the currency situation in South Africa is the biggest geopolitical risk.

Bottom Line

The most optimistic take is that the outlook and risks now define a sort of interim period, perhaps lasting several years, when the level of conflict will increase at various hotspots. The endpoint, hopefully, will be the emergence of new technologies and products, new industries, which will absorb everyone in more constructive growth – perhaps growth defined ecologically, rather than merely in counting objects.