Category Archives: technology forecasting

Links early August 2014

Economy/Business

Economists React to July’s Jobs Report: ‘Not Weak, But…’

U.S. nonfarm employers added 209,000 jobs in July, slightly below forecasts and slower than earlier gains, while the unemployment rate ticked up to 6.2% from June. But employers have now added 200,000 or more jobs in six consecutive months for the first time since 1997.

The most important charts to see before the huge July jobs report – interesting to see what analysts were looking at just before the jobs announcement.

Despite sharp selloff, too early to worry about a correction

Venture Capital: Deals Beyond the Valley

7 Most Expensive Luxury Cars

BMW

Base price $136,000.

Contango And Backwardation Strategy For VIX ETFs Here you go!

Climate/Weather

Horrid California Drought Gets Worse Has a map showing drought conditions at intervals since 2011, dramatic.

IT

Amazon’s Cloud Is Growing So Fast It’s Scaring Shareholders

Amazon has pulled off a pretty amazing trick over the past decade. It’s invented and then built a nearly $5 billion cloud computing business catering to fickle software developers and put the rest of the technology industry on the defensive. Big enterprise software companies such as IBM and HP and even Google are playing catchup, even as they acknowledge that cloud computing is the tech industry’s future.

But what kind of a future is that to be? Yesterday Amazon said that while its cloud business grew by 90 percent last year, it was significantly less profitable. Amazon’s AWS cloud business makes up the majority of a balance sheet item it labels as “other” (along with its credit card and advertising revenue) and that revenue from that line of business grew by 38 percent. Last quarter, revenue grew by 60 percent. In other words, Amazon is piling on customers faster than it’s adding dollars to its bottom line.

The Current Threat

Infographic: Ebola By the Numbers

ebola

Data Science

Statistical inference in massive data sets Interesting and applicable procedure illustrated with Internet traffic numbers.

Semiconductor Cycles

I’ve been exploring cycles in the semiconductor, computer and IT industries generally for quite some time.

Here is an exhibit I prepared in 2000 for a magazine serving the printed circuit board industry.

semicycle

The data come from two sources – the Semiconductor Industry Association (SIA) World Semiconductor Trade Statistics database and the Census Bureau manufacturing series for computer equipment.

This sort of analytics spawned a spate of academic research, beginning more or less with the work of Tan and Mathews in Australia.

One of my favorites is a working paper released by DRUID – the Danish Research Unit for Industrial Dynamics called Cyclical Dynamics in Three Industries. Tan and Mathews consider cycles in semiconductors, computers, and what they call the flat panel display industry. They start with quoting “industry experts” and, specifically, some of my work with Economic Data Resources on the computer (PC) cycle. These researchers went on to publish in the Journal of Business Research and Technological Forecasting and Social Change in 2010. A year later in 2011, Tan published an interesting article on the sequencing of cyclical dynamics in semiconductors.

Essentially, the appearance of cycles and what I have called quasi-cycles or pseudo-cycles in the semiconductor industry and other IT categories, like computers, result from the interplay of innovation, investment, and pricing. In semiconductors, for example, Moore’s law – which everyone always predicts will fail at some imminent future point – indicates that continuing miniaturization will lead to periodic reductions in the cost of information processing. At some point in the 1980’s, this cadence was firmly established by introductions of new microprocessors by Intel roughly every 18 months. The enhanced speed and capacity of these microprocessors – the “central nervous system” of the computer – was complemented by continuing software upgrades, and, of course, by the movement to graphical interfaces with Windows and the succession of Windows releases.

Back along the supply chain, semiconductor fabs were retooling periodically to produce chips with more and more transitors per volume of silicon. These fabs were, simply put, fabulously expensive and the investment dynamics factors into pricing in semiconductors. There were famous gluts, for example, of memory chips in 1996, and overall the whole IT industry led the recession of 2001 with massive inventory overhang, resulting from double booking and the infamous Y2K scare.

Statistical Modeling of IT Cycles

A number of papers, summarized in Aubrey deploy VAR (vector autoregression) models to capture leading indicators of global semiconductor sales. A variant of these is the Bayesian VAR or BVAR model. Basically, VAR models sort of blindly specify all possible lags for all possible variables in a system of autoregressive models. Of course, some cutoff point has to be established, and the variables to be included in the VAR system have to be selected by one means or another. A BVAR simply reduces the number of possibilities by imposing, for example, sign constraints on the resulting coefficients, or, more ambitiously, employs some type of prior distribution for key variables.

Typical variables included in these models include:

  • WSTS monthly semiconductor shipments (now by subscription only from SIA)
  • Philadelphia semiconductor index (SOX) data
  • US data on various IT shipments, orders, inventories from M3
  • data from SEMI, the association of semiconductor equipment manufacturers

Another tactic is to filter out low and high frequency variability in a semiconductor sales series with something like the Hodrick-Prescott (HP) filter, and then conduct a spectral analysis.

Does the Semiconductor/Computer/IT Cycle Still Exist?

I wonder whether academic research into IT cycles is a case of “redoubling one’s efforts when you lose sight of the goal,” or more specifically, whether new configurations of forces are blurring the formerly fairly cleanly delineated pulses in sales growth for semiconductors, computers, and other IT hardware.

“Hardware” is probably a key here, since there have been big changes since the 1990’s and early years of this brave new century.

For one thing, complementarities between software and hardware upgrades seem to be breaking down. This began in earnest with the development of virtual servers – software which enabled many virtual machines on the same hardware frame, in part because the underlying circuitry was so massively powerful and high capacity now. Significant declines in the growth of sales of these machines followed on wide deployment of this software designed to achieve higher efficiencies of utilization of individual machines.

Another development is cloud computing. Running the data side of things is gradually being taken away from in-house IT departments in companies and moved over to cloud computing services. Of course, critical data for a company is always likely to be maintained in-house, but the need for expanding the number of big desktops with the number of employees is going away – or has indeed gone away.

At the same time, tablets, Apple products and Android machines, created a wave of destructive creation in people’s access to the Internet, and, more and more, for everyday functions like keeping calendars, taking notes, even writing and processing photos.

But note – I am not studding this discussion with numbers as of yet.

I suspect that underneath all this change it should be possible to identify some IT invariants, perhaps in usage categories, which continue to reflect a kind of pulse and cycle of activity.

Video Friday – Quantum Computing

I’m instituting Video Friday. It’s the end of the work week, and videos introduce novelty and pleasant change in communications.

And we can keep focusing on matters related to forecasting applications and data analytics, or more generally on algorithmic guides to action.

Today I’m focusing on D-Wave and quantum computing. This could well could take up several Friday’s, with cool videos on underlying principles and panel discussions with analysts from D-Wave, Google and NASA. We’ll see. Probably, I will treat it as a theme, returning to it from time to time.

A couple of introductory comments.

First of all, David Wineland won a Nobel Prize in physics in 2012 for his work with quantum computing. I’ve heard him speak, and know members of his family. Wineland did his work at the NIST Laboratories in Boulder, the location for Eric Cornell’s work which was awarded a Nobel Prize in 2001.

I mention this because understanding quantum computing is more or less like trying to understand quantum physics, and, there, I think engineering has a role to play.

The basic concept is to exploit quantum superimposition, or perhaps quantum entanglement, as a kind of parallel processor. The qubit, or quantum bit, is unlike the bit of classical computing. A qubit can be both 0 and 1 simultaneously, until it’s quantum wave equation is collapsed or dispersed by measurement. Accordingly, the argument goes, qubits scale as powers of 2, and a mere 500 qubits could more than encode all atoms in the universe. Thus, quantum computers may really shine at problems where you have to search through all different combinations of things.

But while I can write the quantum wave equation of Schrodinger, I don’t really understand it in any basic sense. It refers to a probability wave, whatever that is.

Feynman, whose lectures (and tapes or CD’s) on physics I proudly own, says it is pointless to try to “understand” quantum weirdness. You have to be content with being able to predict outcomes of quantum experiments with the apparatus of the theory. The theory is highly predictive and quite successful, in that regard.

So I think D-Wave is really onto something. They are approaching the problem of developing a quantum computer technologically.

Here is a piece of fluff Google and others put together about their purchase of a D-Wave computer and what’s involved with quantum computing.

OK, so now here is Eric Ladizinsky in a talk from April of this year on Evolving Scalable Quantum Computers. I can see why Eric gets support from DARPA and Bezos, a range indeed. You really get the “ah ha” effect listening to him. For example, I have never before heard a coherent explanation of how the quantum weirdness typical for small particles gets dispersed with macroscopic scale objects, like us. But this explanation, which is mathematically based on the wave equation, is essential to the D-Wave technology.

It takes more than an hour to listen to this video, but, maybe bookmark it if you pass on from a full viewing, since I assure you that this is probably the most substantive discussion I have yet found on this topic.

But is D-Wave’s machine a quantum computer?

Well, they keep raising money.

D-Wave Systems raises $30M to keep commercializing its quantum computer

But this infuriates some in the academic community, I suspect, who distrust the announcement of scientific discovery by the Press Release.

There is a brilliant article recently in Wired on D-Wave, which touches on a recent challenge to its computational prowess (See Is D-Wave’s quantum computer actually a quantum computer?)

The Wired article gives Geordie Rose, a D-Wave founder, space to rebut at which point these excellent comments can be found:

Rose’s response to the new tests: “It’s total bullshit.”

D-Wave, he says, is a scrappy startup pushing a radical new computer, crafted from nothing by a handful of folks in Canada. From this point of view, Troyer had the edge. Sure, he was using standard Intel machines and classical software, but those benefited from decades’ and trillions of dollars’ worth of investment. The D-Wave acquitted itself admirably just by keeping pace. Troyer “had the best algorithm ever developed by a team of the top scientists in the world, finely tuned to compete on what this processor does, running on the fastest processors that humans have ever been able to build,” Rose says. And the D-Wave “is now competitive with those things, which is a remarkable step.”

But what about the speed issues? “Calibration errors,” he says. Programming a problem into the D-Wave is a manual process, tuning each qubit to the right level on the problem-solving landscape. If you don’t set those dials precisely right, “you might be specifying the wrong problem on the chip,” Rose says. As for noise, he admits it’s still an issue, but the next chip—the 1,000-qubit version codenamed Washington, coming out this fall—will reduce noise yet more. His team plans to replace the niobium loops with aluminum to reduce oxide buildup….

Or here’s another way to look at it…. Maybe the real problem with people trying to assess D-Wave is that they’re asking the wrong questions. Maybe his machine needs harder problems.

On its face, this sounds crazy. If plain old Intels are beating the D-Wave, why would the D-Wave win if the problems got tougher? Because the tests Troyer threw at the machine were random. On a tiny subset of those problems, the D-Wave system did better. Rose thinks the key will be zooming in on those success stories and figuring out what sets them apart—what advantage D-Wave had in those cases over the classical machine…. Helmut Katzgraber, a quantum scientist at Texas A&M, cowrote a paper in April bolstering Rose’s point of view. Katzgraber argued that the optimization problems everyone was tossing at the D-Wave were, indeed, too simple. The Intel machines could easily keep pace..

In one sense, this sounds like a classic case of moving the goalposts…. But D-Wave’s customers believe this is, in fact, what they need to do. They’re testing and retesting the machine to figure out what it’s good at. At Lockheed Martin, Greg Tallant has found that some problems run faster on the D-Wave and some don’t. At Google, Neven has run over 500,000 problems on his D-Wave and finds the same....

..it may be that quantum computing arrives in a slower, sideways fashion: as a set of devices used rarely, in the odd places where the problems we have are spoken in their curious language. Quantum computing won’t run on your phone—but maybe some quantum process of Google’s will be key in training the phone to recognize your vocal quirks and make voice recognition better. Maybe it’ll finally teach computers to recognize faces or luggage. Or maybe, like the integrated circuit before it, no one will figure out the best-use cases until they have hardware that works reliably. It’s a more modest way to look at this long-heralded thunderbolt of a technology. But this may be how the quantum era begins: not with a bang, but a glimmer.

Data Analytics Reverses Grandiose Claims for California’s Monterey Shale Formation

In May, “federal officials” contacted the Los Angeles Times with advance news of a radical revision of estimates of reserves in the Monterey Formation,

Just 600 million barrels of oil can be extracted with existing technology, far below the 13.7 billion barrels once thought recoverable from the jumbled layers of subterranean rock spread across much of Central California, the U.S. Energy Information Administration said.

The LA Times continues with a bizarre story of how “an independent firm under contract with the government” made the mistake of assuming that deposits in the Monterey Shale formation were as easily recoverable as those found in shale formations elsewhere.

There was a lot more too, such as the information that –

The Monterey Shale formation contains about two-thirds of the nation’s shale oil reserves. It had been seen as an enormous bonanza, reducing the nation’s need for foreign oil imports through the use of the latest in extraction techniques, including acid treatments, horizontal drilling and fracking…

The estimate touched off a speculation boom among oil companies.

Well, I’ve combed the web trying to find more about this “mistake,” deciding that, probably, it was the analysis of David Hughes in “Drilling California,” released in March of this year, that turned the trick.

Hughes – a geoscientist working decades with the Geological Survey of Canada – utterly demolishes studies which project 15 billion barrels in reserve in the Monterey Formation. And he does this by analyzing an extensive database (Big Data) of wells drilled in the Formation.

The video below is well worth the twenty minutes or so. It’s a tour de force of data analysis, but it takes a little patience at points.

First, though, check out a sample of the hype associated with all this, before the overblown estimates were retracted.

Monterey Shale: California’s Trillion-Dollar Energy Source

Here’s a video on Hughes’ research in Drilling California

Finally, here’s the head of the US Energy Information Agency in December 2013, discussing a preliminary release of figures in the 2014 Energy Outlook, also released in May 2014.

Natural Gas 2014 Projections by the EIA’s Adam Sieminski

One question is whether the EIA projections eventually will be acknowledged to be affected by a revision of reserves for a formation that is thought to contain two thirds of all shale oil in the US.

Energy Forecasts – the Controversy

Here’s a forecasting controversy that has analysts in the Kremlin, Beijing, Venezuela, and certainly in the US environmental community taking note.

May 21st, Reuters ran a story UPDATE 2-U.S. EIA cuts recoverable Monterey shale oil estimate by 96 pct from 15.4 billion to 600 million barrels.

Monterey

The next day the Guardian took up the thread with Write-down of two-thirds of US shale oil explodes fracking myth. This article took a hammer to findings of a USC March 2013 study which claimed huge economic benefits for California pursuing advanced extraction technologies in the Monterey Formation (The Monterey Shale & California’s Economic Future).

But wait. Every year the US Energy Information Agency (EIA) releases its Annual Energy Outlook about this time of the year.

Strangely, the just-released Annual Energy Outlook 2014 With Projections to 2014 do not show any cutback in shale oil production projections.

Quite the contrary –

The downgrade [did] not impact near term production in the Monterey, estimates of which have increased to 57,000 barrels per day on average between 2010 and 2040.. Last year’s estimate for 2010 to 2040 was 14,000 barrels per day.

The head of the EIA, Adam Sieminski, in emails with industry sources, emphasizes Technically Recoverable Reserves (TRR) are not (somehow) not linked with estimates of actual production.

At the same time, some claim the boom is actually a bubble.

What’s the bottom line here?

It’s going to take a deep dive into documents. The 2014 Energy Outlook is 269 pages long, and it’s probably necessary to dig into several years reports. I’m hoping someone has done this. But I want to followup on this story.

How did the Monterey Formation reserve estimates get so overblown? How can taking such a huge volume of reserves out of the immediate future not affect production estimates for the next decade or two? What is the typical accuracy of the EIA energy projections anyway?

According to the EIA, the US will briefly – for a decade or two – be energy independent, because of shale oil and other nonstandard fossil fuel sources. This looms even larger with geopolitical developments in Crimea, the Ukraine, Europe’s dependence on Russian natural gas supplies, and the recently concluded agreements between Russia and China.

It’s a great example of how politics can enter into forecasting, or vice versa.

Coming Attractions

While shale/fracking and the global geopolitics of natural gas are hot stories, there is a lot more to the topic of energy forecasting.

Electric power planning is a rich source of challenges for forecasting – from short term load forecasts identifying seasonal patterns of usage. Real innovation can be found here.

And what about peak oil? Was that just another temporary delusion in the energy futures discussion?

I hope to put up posts on these sorts of questions in coming days.

Links, middle of June

Optimizing the current business setup does not appear to be triggering significant new growth – more like a convergence to secular stagnation, as Larry Summers has suggested.

So it’s important to document where the trends in new business and venture capital, as well as patents, are going.

The good news is you are looking at this, and via the Internet we can – with enough fumbling around – probably find a way out of this low to negative growth puzzle.

Declining Business Dynamism in the United States: A Look at States and Metros– Brookings Institution research shows more firms exited than entered business in all states and in virtually all metropolitan areas for more than a decade.

Businesentryexit

Job reallocation is another measure of new business formation, since startups mean new hires. It has fallen too.

jobreallocation

The Atlantic monthly blog on this topic is a nice read, if you don’t go through the Brookings report directly. It’s at The Rate of New Business Formation Has Fallen By Almost Half Since 1978.

The policy recommendation is reforming immigration. Apparently, about half Silicon Valley startups over some recent period were headed by entrepreneurs who were not born in the US. Currently, many positions in US graduate schools of engineering and science are occupied by foreign students. This seems like a promising proposal, but, of course, drat, Eric Cantor lost his bid in the Virginia Republican primary.

The Kauffman Foundation has an update for 2013 Entrepreneurial Activity Declines Again in 2013 as Labor Market Strengthens. There is an interesting report attached to this story exploring the concept that people starting new businesses is related to the level of unemployment.

National Venture Capital Association statistics show that venture capital funding recovered from the Great Recession and has stabilized, but by no means has taken up the slack in new business formation.

VC1

There’s also this chart on venture capital funds –

VC2

Of course, EY or what used to be called Ernst and Young produces a fairly authoritative annual report on venture capital activity globally. See Global Venture Capital Insights and Trends, 2014. This report shows global venture capital activity to have stabilized at about $50 billion in 2013.

EY

U.S. Firms Hold Record $1.64 Trillion in Cash With Apple in Lead – meanwhile, the largest US corporations amass huge cash reserves, much of it head abroad to take advantage of tax provisions.

Apple, whose cash pile surged to $158.8 billion from $5.46 billion in 2004, now holds 9.7 percent of total corporate cash outside the financial industry..

Firms in the technology industry kept $450 billion overseas — 47 percent of the total corporate cash pile held outside the U.S.

Federal Spending on Science, Already Down, Would Remain Tight

The Obama administration, constrained by spending caps imposed by Congress, suggested on Tuesday a federal budget for 2015 that would mean another year of cuts in the government’s spending on basic scientific research.

The budget of the National Institutes of Health, the largest provider of basic research money to universities, would be $30.4-billion, an increase of just $200-million from the current year. After accounting for inflation, that would be a cut of about 1 percent.

Three other leading sources of research money to universities—the National Science Foundation, the Department of Defense, and the National Aeronautics and Space Administration—also would see their science budgets shrink or grow slower than the expected 1.7-percent rate of inflation.

Over all, federal spending on research and development would increase only 1.2 percent, before inflation, in the 2015 fiscal year, which begins on October 1. The portion for basic research would fall 1 percent, a reduction that inflation would nearly triple.

Latest Patent Filing Figures – World Intellectual Property Organization The infographic pertains to filings under the Patent Cooperation (PC) Treaty, under covers the largest number of patents. The World Intellectual Property Organization also provides information on Madrid and Hague System filings. Note the US and Japan are still at the top of the list, but that China has moved to number 3.

Patents

In general, a WIPO report for 2013 documents, IP [intellectual property] filings sharply rebounded in 2012, following a decrease in 2009, at the height of the financial crisis, and are now even exceeding pre-global economic crisis rates of growth.

Predicting the Singularity, the Advent of Superintelligence

From thinking about robotics, automation, and artificial intelligence (AI) this week, I’m evolving a picture of the future – the next few years. I think you have to define a super-technological core, so to speak, and understand how the systems of production, communication, and control mesh and interpenetrate across the globe. And how this sets in motion multiple dynamics.

But then there is the “singularity” –  whose main publicizer is Ray Kurzweil, current Director of Engineering at Google. Here’s a particularly clear exposition of his view.

There’s a sort of rebuttal by Paul Root Wolpe.

Part of the controversy, as in many arguments, is a problem of definition. Kurzweil emphasizes a “singularity” of superintelligence of machines. For him, the singularity is at first the point at which the processes of the human brain will be well understood and thinking machines will be available that surpass human capabilities in every respect. Wolpe, on the other hand, emphasizes the “event horizon” connotation of the singularity – that point beyond which out technological powers will have become so immense that it is impossible to see beyond.

And Wolpe’s point about the human brain is probably well-taken. Think, for instance, of how decoding the human genome was supposed to unlock the secrets of genetic engineering, only to find that there were even more complex systems of proteins and so forth.

And the brain may be much more complicated than the current mechanical models suggest – a view espoused by Roger Penrose, English mathematical genius. Penrose advocates a  quantum theory of consciousness. His point, made first in his book The Emperor’s New Mind, is that machines will never overtake human consciousness, because, in fact, human consciousness is, at the limit, nonalgorithmic. Basically, Penrose has been working on the idea that the brain is a quantum computer in some respect.

I think there is no question, however, that superintelligence in the sense of fast computation, fast assimilation of vast amounts of data, as well as implementation of structures resembling emotion and judgment – all these, combined with the already highly developed physical capabilities of machines, mean that we are going to meet some mojo smart machines in the next ten to twenty years, tops.

The dysutopian consequences are enormous. Bill Joy, co-founder of Sun Microsystems, wrote famously about why the future does not need us. I think Joy’s singularity is a sort of devilish mirror image of Kurzweil’s – for Joy the singularity could be a time when nanotechnology, biotechnology, and robotics link together to make human life more or less impossible, or significantly at risk.

There’s is much more to say and think on this topic, to which I hope to return from time to time.

Meanwhile, I am reminded of Voltaire’s Candide who, at the end of pursuing the theories of Dr. Pangloss, concludes “we must cultivate our garden.”

Robotics – the Present, the Future

A picture is worth one thousand words. Here are several videos, mostly from Youtube, discussing robotics and artificial intelligence (AI) and showing present and future capabilities. The videos fall in five areas – concepts with Andrew Ng, Industrial Robots and their primary uses, Military Robotics, including a presentation on predator drones, and some state-of-the-art innovations in robotics which mimic the human approach to a degree.

Andrew Ng  – The Future of Robotics and Artificial Intelligence

Car Factory – Kia Sportage factory production line

ABB Robotics – 10 most popular applications for robots


Predator Drones


Innovators: The Future of Robotic Warfare


Bionic kangaroo


The Duel: Timo Boll vs. KUKA Robot


The “Hollowing Out” of Middle Class America

Two charts in a 2013 American Economic Review (AER) article put numbers to the “hollowing out” of middle class America – a topic celebrated with profuse anecdotes in the media.

Autor1

The top figure shows the change in employment 1980-2005 by skill level, based on Census IPUMS and American Community Survey (ACS) data. Occupations are ranked by skill level, approximated by wages in each occupation in 1980.

The lower figure documents the changes in wages of these skill levels 1980-2005.

These charts are from David Autor and David Dorn – The Growth of Low-Skill Service Jobs and the Polarization of the US Labor Market – who write that,

Consistent with the conventional view of skill-biased technological change, employment growth is differentially rapid in occupations in the upper two skill quartiles. More surprising in light of the canonical model are the employment shifts seen below the median skill level. While occupations in the second skill quartile fell as a share of employment, those in the lowest skill quartile expanded sharply. In net, employment changes in the United States during this period were strongly U-shaped in skill level, with relative employment declines in the middle of the distribution and relative gains at the tails. Notably, this pattern of employment polarization is not unique to the United States. Although not recognized until recently, a similar “polarization” of employment by skill level has been underway in numerous industrialized economies in the last 20 to 30 years.

So, employment and wage growth has been fastest in the past three or so decades (extrapolating to the present) in low skill and high skill occupations.

Among lower skill occupations, such as food service workers, security guards, janitors and gardeners, cleaners, home health aides, child care workers, hairdressers and beauticians, and recreational workers, employment grew 30 percent 1980-2005.

Among the highest paid occupations – classified as managers, professionals, technicians, and workers in finance, and public safety – the share of employment also grew by about 30 percent, but so did wages – which increased at about double the pace of the lower skill occupations over this period.

Professor Autor is in the MIT economics department, and seems to be the nexus of a lot of interesting research casting light on changes in US labor markets.

DavidAutor

In addition to “doing Big Data” as the above charts suggest, David Autor is closely associated with a new, common sense model of production activities, based on tasks and skills.

This model of the production process, enables Autor and his coresearchers to conclude that,

…recent technological developments have enabled information and communication technologies to either directly perform or permit the offshoring of a subset of the core job tasks previously performed by middle skill workers, thus causing a substantial change in the returns to certain types of skills and a measurable shift in the assignment of skills to tasks.

So it’s either a computer (robot) or a Chinaman who gets the middle-class bloke’s job these days.

And to drive that point home – (and, please, I consider the achievements of the PRC in lifting hundreds of millions out of extreme poverty to be of truly historic dimension) Autor with David Dorn and Gordon Hansen publihsed another 2013 article in the AER titled The China Syndrome: Local Labor Market Effects of Import Competition in the United States.

This study analyzes local labor markets and trade shocks to these markets, according to initial patterns of industry specialization.

The findings are truly staggering – or at least have been equivocated or obfuscated for years by special pleaders and lobbyists.

Dorn et al write,

The value of annual US goods imports from China increased by a staggering 1,156 percent from 1991 to 2007, whereas US exports to China grew by much less…. 

Our analysis finds that exposure to Chinese import competition affects local labor markets not just through manufacturing employment, which unsurprisingly is adversely affected, but also along numerous other margins. Import shocks trigger a decline in wages that is primarily observed outside of the manufacturing sector. Reductions in both employment and wage levels lead to a steep drop in the average earnings of households. These changes contribute to rising transfer payments through multiple federal and state programs, revealing an important margin of adjustment to trade that the literature has largely overlooked,

This research – conducted in terms of ordinary least squares (OLS), two stage least squares (2SLS) as well as “instrumental” regressions – is definitely not something a former trade unionist is going to ponder in the easy chair after work at the convenience store. So it’s kind of safe in terms of arousing the ire of the masses.

But I digress.

For my purposes here, Autor and his co-researchers put pieces of the puzzle in place so we can see the picture.

The US occupational environment has changed profoundly since the 1980’s. Middle class jobs have simply vanished over large parts of the landscape. More specifically, good-paying production jobs, along with a lot of other more highly paid, but routinized work, has been the target of outsourcing, often to China it seems it can be demonstrated. Higher paid work by professionals in business and finance benefits from complementarities with the advances in data processing and information technology (IT) generally. In addition, there are a small number of highly paid production workers whose job skills have been updated to run more automated assembly operations which seem to be the chief beneficiaries of new investment in production in the US these days.

There you have it.

Market away, and include these facts in any forecasts you develop for the US market.

Of course, there are issues of dynamics.

Jobs and the Next Wave of Computerization

A duo of researchers from Oxford University (Frey and Osborne) made a splash with their analysis of employment and computerization in the US (English spelling). Their research, released September of last year, projects that –

47 percent of total US employment is in the high risk category, meaning that associated occupations are potentially automatable over some unspecified number of years, perhaps a decade or two..

Based on US Bureau of Labor Statistics (BLS) classifications from O*NET Online, their model predicts that most workers in transportation and logistics occupations, together with the bulk of office and administrative support workers, and labour in production occupations, are at risk.

This research deserves attention, if for no other reason than masterful discussions of the impact of technology on employment and many specific examples of new areas for computerization and automation.

For example, I did not know,

Oncologists at Memorial Sloan-Kettering Cancer Center are, for example, using IBM’s Watson computer to provide chronic care and cancer treatment diagnostics. Knowledge from 600,000 medical evidence reports, 1.5 million patient records and clinical trials, and two million pages of text from medical journals, are used for benchmarking and pattern recognition purposes. This allows the computer to compare each patient’s individual symptoms, genetics, family and medication history, etc., to diagnose and develop a treatment plan with the highest probability of success..

There are also specifics of computerized condition monitoring and novelty detection -substituting for closed-circuit TV operators, workers examining equipment defects, and clinical staff in intensive care units.

A followup Atlantic Monthly article – What Jobs Will the Robots Take? – writes,

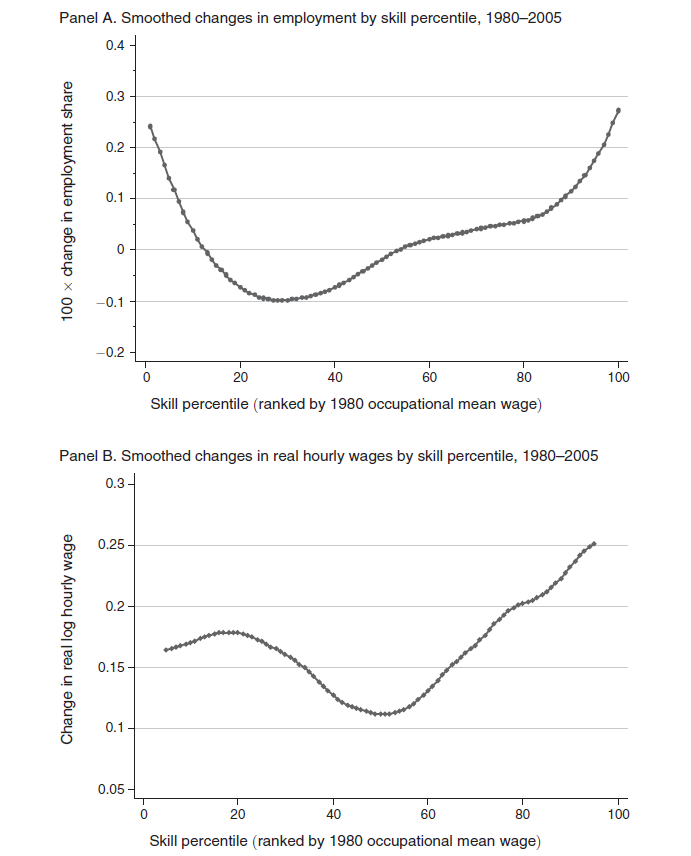
We might be on the edge of a breakthrough moment in robotics and artificial intelligence. Although the past 30 years have hollowed out the middle, high- and low-skill jobs have actually increased, as if protected from the invading armies of robots by their own moats. Higher-skill workers have been protected by a kind of social-intelligence moat. Computers are historically good at executing routines, but they’re bad at finding patterns, communicating with people, and making decisions, which is what managers are paid to do. This is why some people think managers are, for the moment, one of the largest categories immune to the rushing wave of AI.

Meanwhile, lower-skill workers have been protected by the Moravec moat. Hans Moravec was a futurist who pointed out that machine technology mimicked a savant infant: Machines could do long math equations instantly and beat anybody in chess, but they can’t answer a simple question or walk up a flight of stairs. As a result, menial work done by people without much education (like home health care workers, or fast-food attendants) have been spared, too.

What Frey and Osborne at Oxford suggest is an inflection point, where machine learning (ML) and what they call mobile robotics (MR) have advanced to the point where new areas for applications will open up – including a lot of menial, service tasks that were not sufficiently routinized for the first wave.

In addition, artificial intelligence (AI) and Big Data algorithms are prying open up areas formerly dominated by intellectual workers.

The Atlantic Monthly article cited above has an interesting graphic –

jobsautomation
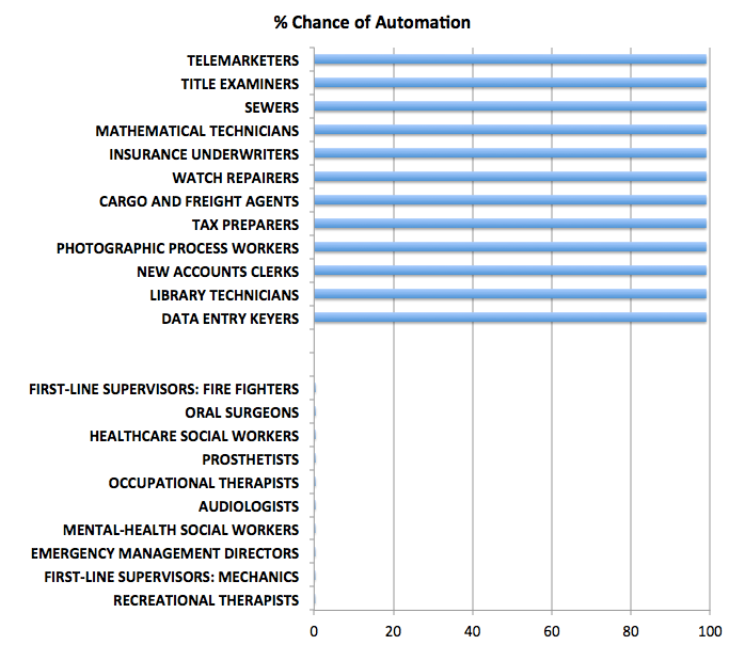
So at the top of this chart are the jobs which are at 100 percent risk of being automated, while at the bottom are jobs which probably will never be automated (although I do think counseling can be done to a certain degree by AI applications).

The Final Frontier

This blog focuses on many of the relevant techniques in machine learning – basically unsupervised learning of patterns – which in the future will change everything.

Driverless cars are the wow example, of course.

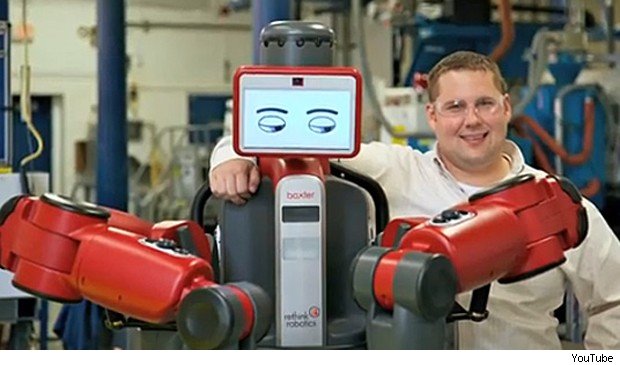
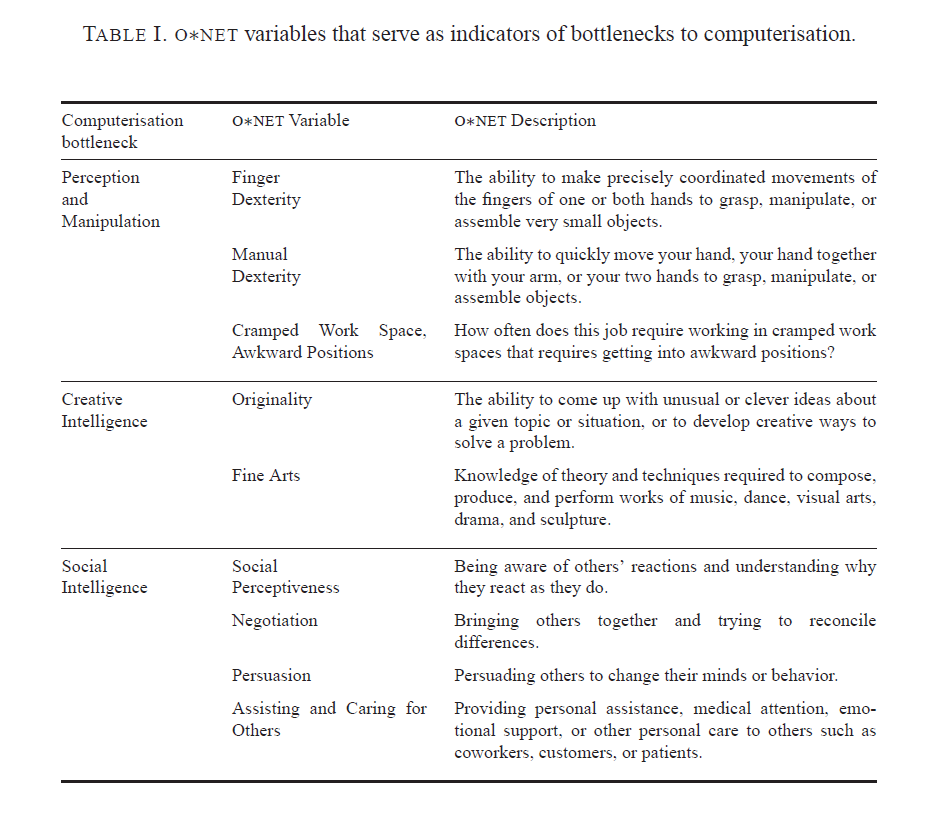
Bottlenecks to moving further up the curve of computerization are highlighted in the following table from the Oxford U report.

ONETvars

As far as dexterity and flexibility goes, Baxter shows great promise, as the following YouTube from his innovators illustrates.

There also are some wonderful examples of apparent creativity by computers or automatic systems, which I plan to detail in a future post.

Frey and Osborn, reflecting on their research in a 2014 discussion, conclude

So, if a computer can drive better than you, respond to requests as well as you and track down information better than you, what tasks will be left for labour? Our research suggests that human social intelligence and creativity are the domains were labour will still have a comparative advantage. Not least, because these are domains where computers complement our abilities rather than substitute for them. This is because creativity and social intelligence is embedded in human values, meaning that computers would not only have to become better, but also increasingly human, to substitute for labour performing such work.

Our findings thus imply that as technology races ahead, low-skill workers will need to reallocate to tasks that are non-susceptible to computerisation – i.e., tasks requiring creative and social intelligence. For workers to win the race, however, they will have to acquire creative and social skills. Development strategies thus ought to leverage the complementarity between computer capital and creativity by helping workers transition into new work, involving working with computers and creative and social ways.

Specifically, we recommend investing in transferable computer-related skills that are not particular to specific businesses or industries. Examples of such skills are computer programming and statistical modeling. These skills are used in a wide range of industries and occupations, spanning from the financial sector, to business services and ICT.

Implications For Business Forecasting

People specializing in forecasting for enterprise level business have some responsibility to “get ahead of the curve” – conceptually, at least.

Not everybody feels comfortable doing this, I realize.

However, I’m coming to the realization that these discussions of how many jobs are susceptible to “automation” or whatever you want to call it (not to mention jobs at risk for “offshoring”) – these discussions are really kind of the canary in the coal mine.

Something is definitely going on here.

But what are the metrics? Can you backdate the analysis Frey and Osborne offer, for example, to account for the coupling of productivity growth and slower employment gains since the last recession?

Getting a handle on this dynamic in the US, Europe, and even China has huge implications for marketing, and, indeed, social control.