
Look at it this way. There are lots of business and finance blogs, but how many provide real-time forecasts, along with updates on how prior predictions performed?
Here on BusinessForecastBlog – we roll out forecasts of the highs and lows of a growing list of securities for the coming week on Monday morning, along with an update on past performance.
It’s a good discipline, if you think you have discovered a pattern which captures some part of the variation in future values of a variable. Do the backtesting, but also predict in real-time. It’s very unforgiving.
Here is today’s forecast, along with a recap for last week (click to enlarge).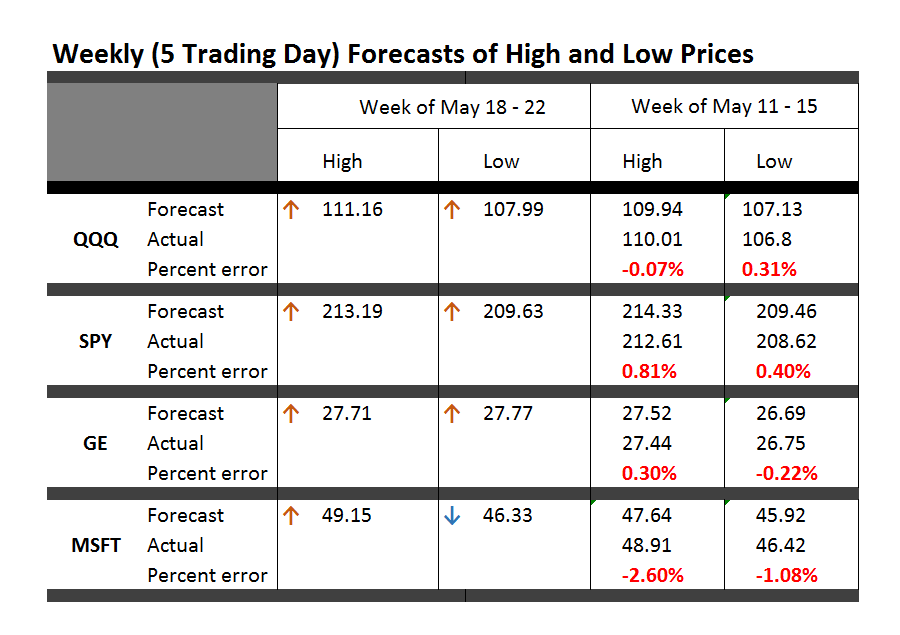
There is an inevitable tendency to narrate these in “Nightly Business Report” fashion.
So the highs are going higher this week, and so are the lows, except perhaps for a slight drop in Microsoft’s low – almost within the margin of statistical noise. Not only that, but predicted increases in the high for QQQ are fairly substantial.
Last week’s forecasts were solid, in terms of forecast error, except Microsoft’s high came in above what was forecast. Still, -2.6 percent error is within the range of variation in the backtests for this security. Recall, too, that in the previous week, the forecast error for the high of MSFT was only .04 percent, almost spot on.
Since the market moved sideways for many securities, No Change forecasts were a strong competitor to the NPV (new proximity variable) forecasts. In fact, there was an 50:50 split. In half the four cases, the NPV forecasts performed better; in the other half, No Change forecasts had lower errors.
Direction of change predictions also came in about 50:50. They were correct for QQQ and SPY, and wrong for the two stocks.
Where is the Market Going?
This tool – forecasts based on the NPV algorithms – provides longer terms looks into the future, probably effectively up to one month ahead.
So in two weeks, I’m going to add that forecast to the mix. I think it may be important, incidentally, to conform to the standard practice of taking stock at the beginning of the month, rather than, say, simply going out four weeks from today.
To preview the power of this monthly NPV model, here are the backtests for the crisis months before and during the 2008 financial crisis.
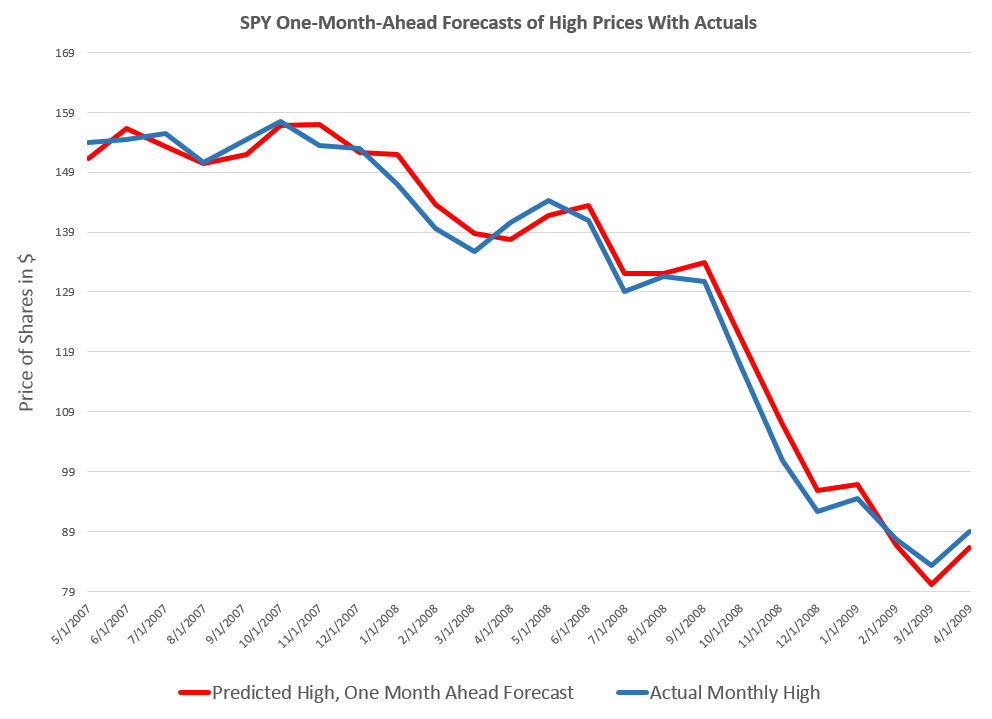
This is a remarkable performance, really. Once the crash really gets underway in late Summer-Fall 2008, the NPV forecast drops in a straight-line descent, as do the actual monthly highs. There are some turning points in common, too, between the two series. And generally, even at the start of the process, the monthly NPV model provides good guidance as to the direction and magnitude of changes.
Over the next two weeks, I’m collecting high frequency data to see whether I can improve these forecasts with supplemental information – such as interest rates spreads and other variables available on a weekly or monthly basis.
In closing, let me plug Barry Eichengreen’s article in Syndicate An Economics to Fit the Facts.
Eichengreen writes,
While older members of the economics establishment continue to debate the merits of competing analytical frameworks, younger economists are bringing to bear important new evidence about how the economy operates.
It’s all about dealing with the wealth of data that is being collected everywhere now, and much less about theoretical disputes involving formal models.
Finally, it’s always necessary to insert a disclaimer, whenever one provides real-time, actionable forecasts. This stuff is for informational and scientific purposes only. It is not intended to provide recommendations for specific stock trading, and what you do on that score is strictly your own business and responsibility.
Mountain climbing pic from Blink.