
Here is a chart showing backtests and a prediction for the midpoints of the monthly trading ranges of the SPY exchange traded fund.
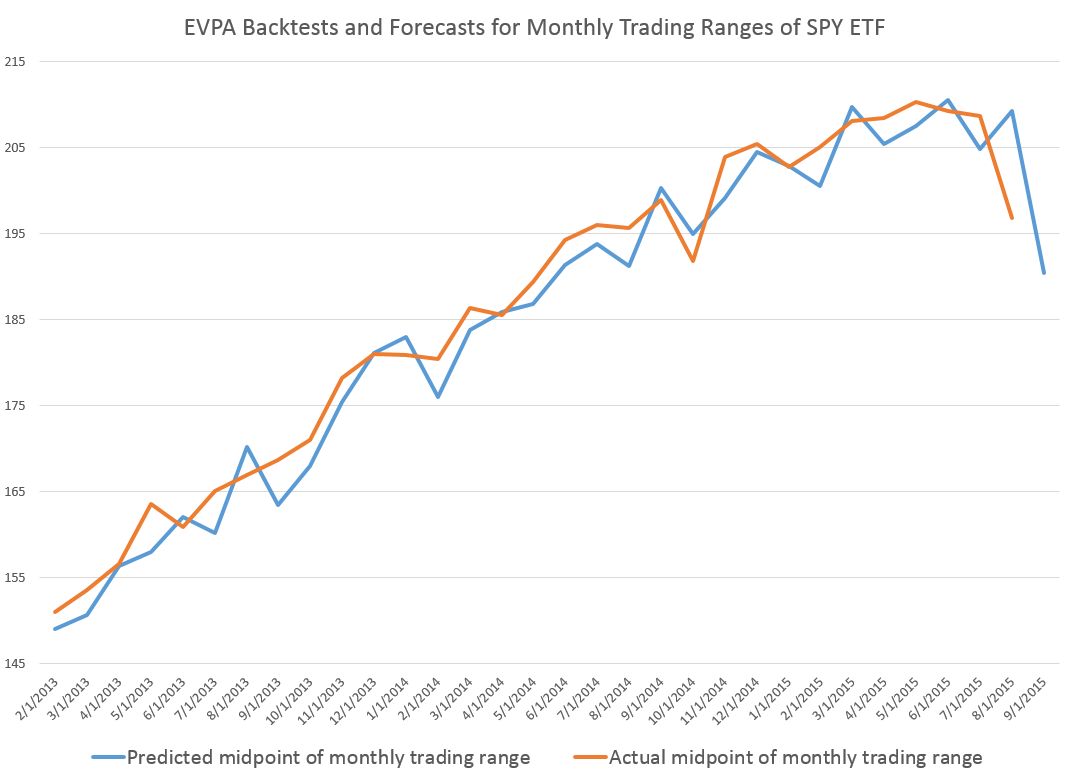
The orange line traces out the sequence of actual monthly midpoints of the price range – the average of the high and low price for the month.
The blue line charts the backtests going back to 2013 and a forecast for September 2015 – which is the right-most endpoint of the blue line. The predicted September midpoint is $190.43.
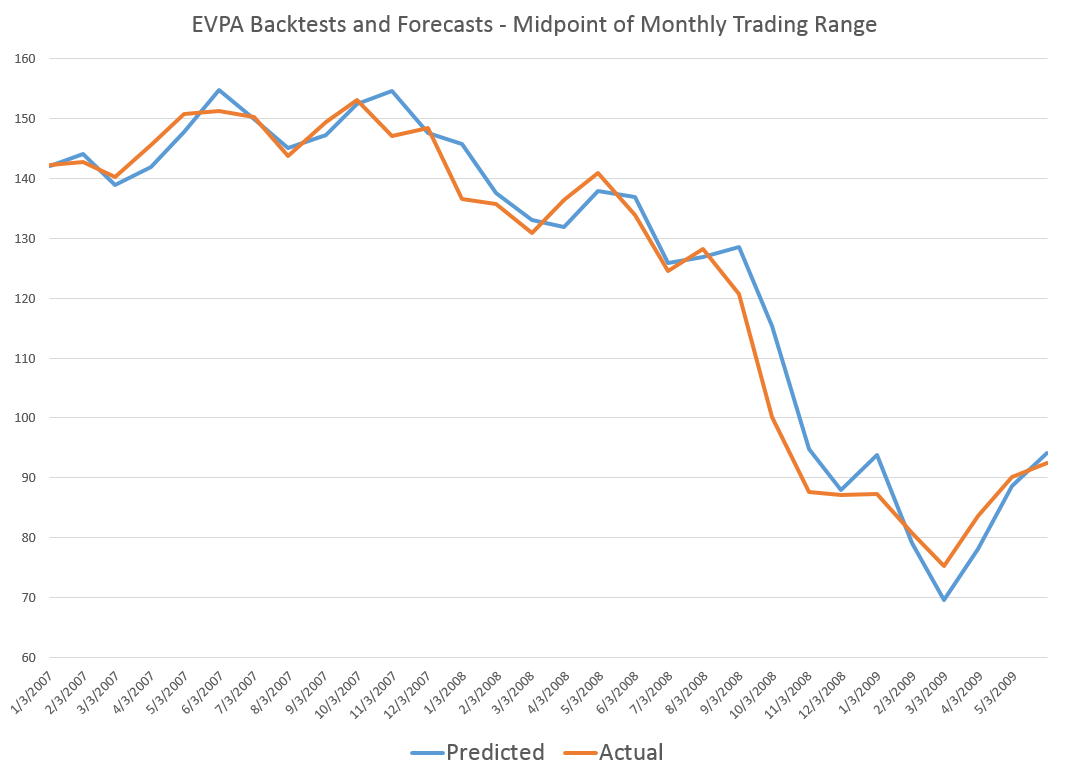
The predictions come from the EVPA, an algorithm backtested to 1994 for the SPY. Since 1994, the forecast accuracy, measured by the MAPE or mean absolute percent error, is 2.4 percent. This significantly improves on a No Change model, one of the alternative forecast benchmarks for this series, and the OOS R2 of the forecast of the midpoint of the monthly trading range is a solid 0.33.
Just from eyeballing the graph above, it seems like there are systematic errors to the downside in the forecasts.
However, the reverse appears to happen, when the SPY prices are falling over a longer period of time.
I would suggest, therefore, that the prediction of about $190 for September is probably going to be higher than the actual number.
Now – disclaimer. This discussion is provided for scientific and entertainment purposes only. We assume no responsibility for any trading actions taken, based on this information. The stock market, particularly now, is volatile. There are lots of balls in the air – China, potential Fed actions on interest rates, more companies missing profit expectations, and so forth – so literally anything may happen.
The EVPA is purely probabilistic. It is right more often than wrong. Its metrics are better than those of alternative forecast models in the cases I have studied. But, withal, it still is a gamble to act on its predictions.
But the performance of the EVPA is remarkable, and I believe further improvements are within reach.