Forecasting Issue – Projected Rise in US Health Care Spending

Between one fifth and one sixth of all spending in the US economy, measured by the Gross Domestic Product (GDP), is for health care – and the ratio is projected to rise.

From a forecasting standpoint, an interesting thing about this spending  is that it can be forecast in the aggregate on a 1, 2 and 3 year ahead basis with a fair degree of accuracy.

This is because growth in disposable personal income (DPI) is a leading indicator of private personal healthcare spending – which comprises the lion’s share of total healthcare spending.

Here is a chart from PROJECTIONS OF NATIONAL HEALTH EXPENDITURES: METHODOLOGY AND MODEL SPECIFICATION highlighting the lagged relationship and private health care spending.

laggedeffect

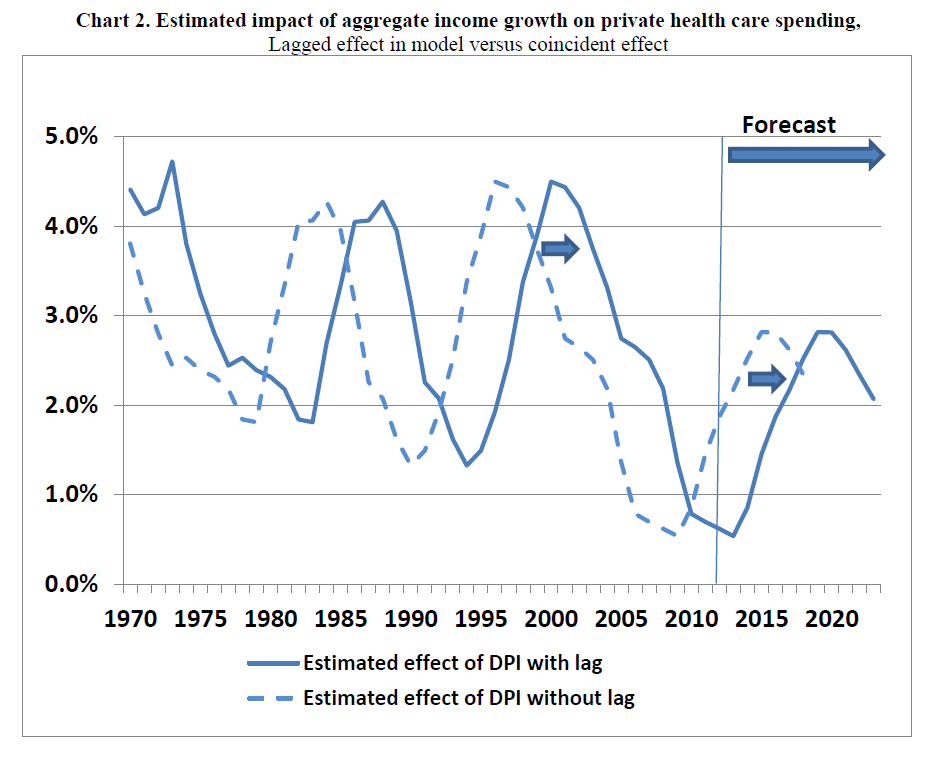
Thus, the impact of the recession of 2008-2009 on disposable personal income has resulted in relatively low increases in private healthcare spending until quite recently. (Note here, too, that the above curves are smoothed by taking centered moving averages.)

The economic recovery, however, is about to exert an impact on overall healthcare spending – with the effects of the Affordable Care Act (ACA) aka Obamacare being a wild card.

A couple of news articles signal this, the first from the Washington Post and the second from the New Republic.

The end of health care’s historic spending slowdown is near

The historic slowdown in health-care spending has been one of the biggest economic stories in recent years — but it looks like that is soon coming to an end.

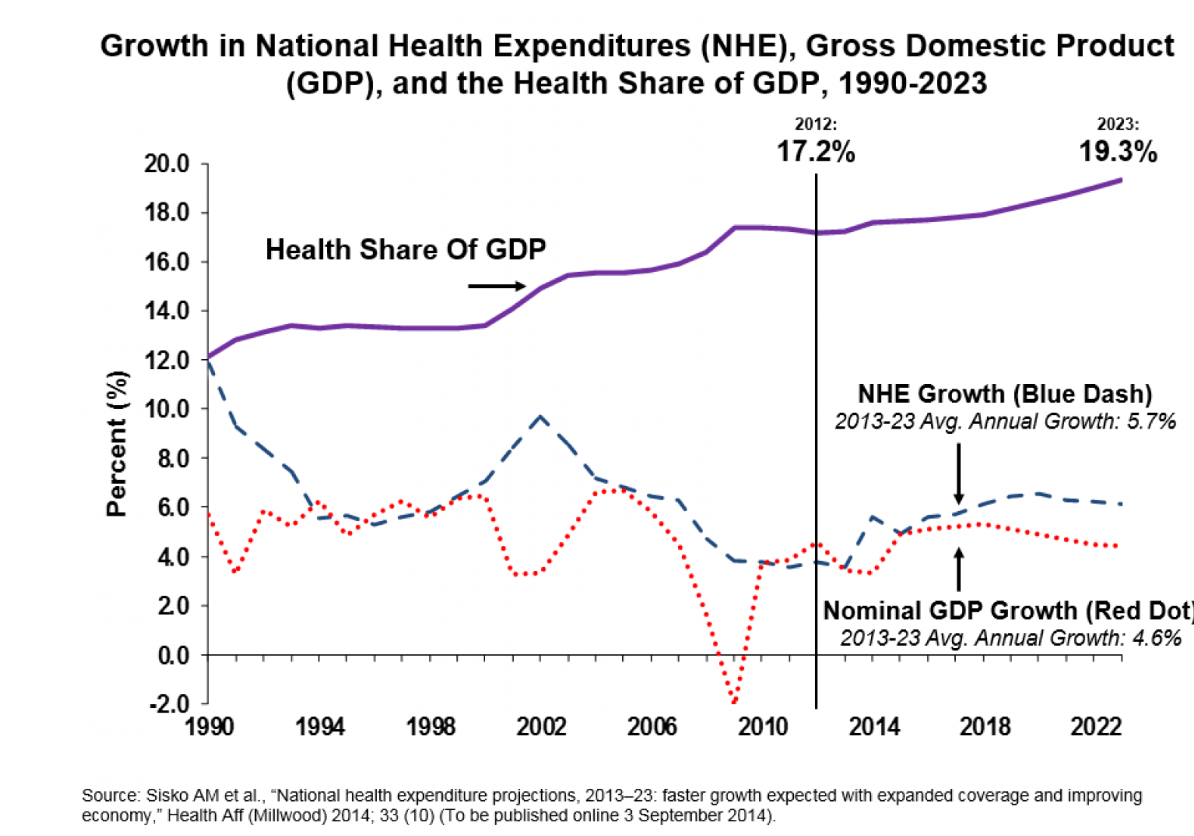
As the economy recovers, Obamacare expands coverage and baby boomers join Medicare in droves, the federal Centers for Medicare and Medicaid Services’ actuary now projects that health spending will grow on average 5.7 percent each year through 2023, which is 1.1 percentage points greater than the expected rise in GDP over the same period. Health care’s share of GDP over that time will rise from 17.2 percent now to 19.3 percent in 2023, or about $5.2 trillion, as the following chart shows.

NHCE

America’s Medical Bill Didn’t Spike Last Year

The questions are by how much health care spending will accelerate—and about that, nobody can be sure. The optimistic case is that the slowdown in health care spending isn’t entirely the product of a slow economy. Another possible factor could be changes in the health care market—in particular, the increasing use of plans with high out-of-pocket costs, which discourage people from getting health care services they might not need. Yet another could be the influence of the Affordable Care Act—which reduced what Medicare pays for services while introducing tax and spending modifications designed to bring down the price of care.

There seems to be some wishful thinking on this subject in the media.

Betting against the lagged income effect is not advisable, however, as an analysis of the accuracy of past projections of Centers for Medicare and Medicaid Services (CMS) shows.

Links – End of 2014

Well, Happy New Year coming up, and here are some great links!

Here are 38 maps that explain the global economy An outstanding collection, including amazing favorites, such as Open Defecation in India and alcohol consumption

globalalcoholconsumption

Speaking of India, though – India launches biggest ever rocket into space

thegeostatio

The new rocket, weighing 630 tonnes and capable of carrying a payload of 4 tonnes, is a boost for India’s attempts to grab a greater slice of the $300-billion global space market.

Keeping the focus on Asia –

China is Planning to Purge Foreign Technology and Replace With Homegrown Suppliers Bloomberg – this could be big if it can be implemented.

China is aiming to purge most foreign technology from banks, the military, state-owned enterprises and key government agencies by 2020, stepping up efforts to shift to Chinese suppliers, according to people familiar with the effort.

The push comes after a test of domestic alternatives in the northeastern city of Siping that was deemed a success, said the people, who asked not to be named because the details aren’t public. Workers there replaced Microsoft Corp.’s (MSFT) Windows with a homegrown operating system called NeoKylin and swapped foreign servers for ones made by China’s Inspur Group Ltd., they said.

The plan for changes in four segments of the economy is driven by national security concerns and marks an increasingly determined move away from foreign suppliers under President Xi Jinping, the people said. The campaign could have lasting consequences for U.S. companies including Cisco Systems Inc. (CSCO), International Business Machines Corp. (IBM), Intel Corp. (INTC) and Hewlett-Packard Co.

Why Christmas Is Huge in China

Christmas is “an excuse to party” whereas Chinese festivals are comparatively “solemn, serious, and spiritual,”

4e19ba881

2015 looks like it is going to be a big year for economic news, with many forecasting opportunities.

The Gift of Low Oil Prices

Oil May Drop top $20 a Barrel

At the end of last week, Anatole Kaletsky wrote an insightful piece for Reuters – The reason oil could drop as low as $20 per barrel.

Kaletsky writes,

There are several reasons to expect a new trading range as low as $20 to $50, as in the period from 1986 to 2004. Technological and environmental pressures are reducing long-term oil demand and threatening to turn much of the high-cost oil outside the Middle East into a “stranded asset” similar to the earth’s vast unwanted coal reserves. Additional pressures for low oil prices in the long term include the possible lifting of sanctions on Iran and Russia and the ending of civil wars in Iraq and Libya, which between them would release additional oil reserves bigger than Saudi Arabia’s on to the world markets.

The U.S. shale revolution is perhaps the strongest argument for a return to competitive pricing instead of the OPEC-dominated monopoly regimes of 1974-85 and 2005-14. Although shale oil is relatively costly, production can be turned on and off much more easily – and cheaply – than from conventional oilfields. This means that shale prospectors should now be the “swing producers” in global oil markets instead of the Saudis. In a truly competitive market, the Saudis and other low-cost producers would always be pumping at maximum output, while shale shuts off when demand is weak and ramps up when demand is strong. This competitive logic suggests that marginal costs of U.S. shale oil, generally estimated at $40 to $50, should in the future be a ceiling for global oil prices, not a floor.

As if in validation of this perspective, Sheik Ali al-Naimi, the Saudi Oil Minister, is quoted in an interview at the beginning of this week

“It is not in the interest of Opec producers to cut their production, whatever the price is … Whether it goes down to $20, $40, $50, $60, it is irrelevant.”

Also, Mr Naimi said that if Saudi Arabia reduced its production, “the price will go up and the Russians, the Brazilians, US shale oil producers will take my share”.

Higher Cost Oil Producers Impacted

Estimates of the cost to the Saudi’s for extracting their oil out of the ground seem to be plummeting, along with the spot price of a barrel of crude. The above interview cited by the Financial Times also asserts that Saudi and other Gulf States can extract at $4-$5 a barrel.

That is an order of magnitude less than the production costs of oil from many US shale plays, much of the North Sea oil supplying revenues to Norway and the UK, as well as Russian and Iranian oil.

Here is a chart from the Wall Street Journal from late October of this year, estimating production costs in US shale oil plays (click to enlarge).

USSalePC

The rig count has been dropping, but many expect US shale oil production to continue increasing, as companies optimize existing wells and drill as long as already secured futures contracts cover output.

Given the low growth to deflationary profile in the global economy, this probably means a glut of petroleum on world markets for 2015 and, possibly, 2016.

Implications of a Period of Significantly Lower Oil Prices

The price of gasoline at the pump in the US is plummeting.

regulargasprice

First-order effects for the American consumer probably more than balance the short-run negative impacts of cutbacks in the oil or shale patch. The typical household gets on the order of $100 extra in their pocket monthly, as long as the low prices continue. This is discretionary money that would have in all likelihood be spent anyway. So other products will benefit, plus people will drive more. It’s as simple as that.

China may be a major beneficiary, since its production is relatively energy-intensive and it is a net importer of petroleum products.

Japan should also benefit significantly.

In Japan, which imports energy (all at prices based on crude oil) worth roughly 6% of GDP, the recent sharp price drop could lift real GDP growth by 1.5%–2%! This would largely offset the 3% hike in VAT imposed last year – or justify the second round 2% hike that was just cancelled. The drop in oil prices may save Abe short term, but it will also put at risk both the 3% inflation goal and the need to turn nuclear facilities back on.

Going Out on a Limb – Business Forecast Blog Prediction

OK, so I’m going out on a limb here and make the following prediction.

As long as there is no banking collapse, as a result of oil companies turning the junk bonds that financed their land purchases into true junk, or the Russian economy collapsing, dragging down the European banking system – all bets are off for a recession in 2015 and probably 2016.

These low oil prices are like a gift to many of the world’s economies, as well as many families reliant on the internal combustion engine to get them to and from work. Low oil prices also should help keep the cost of agricultural products down, again benefitting consumers.

My intuition is that this is a real game changer.

Top graphic from Wall Street Daily

Primer on Method – Some Perspectives from 2014

As Hal Varian writes in his popular Big Data: New Tricks for Econometrics the wealth of data now available to researchers demands new techniques of analysis.

In particular, often there is the problem of “many predictors.” In classic regression, the number of observations is assumed to exceed the number of explanatory variables. This obviously is challenged in the Big Data context.

Variable selection procedures are one tactic in this situation.

Readers may want to consult the post Selecting Predictors. It has my list of methods, as follows:

  1. Forward Selection. Begin with no candidate variables in the model. Select the variable that boosts some goodness-of-fit or predictive metric the most. Traditionally, this has been R-Squared for an in-sample fit. At each step, select the candidate variable that increases the metric the most. Stop adding variables when none of the remaining variables are significant. Note that once a variable enters the model, it cannot be deleted.
  2. Backward Selection. This starts with the superset of potential predictors and eliminates variables which have the lowest score by some metric – traditionally, the t-statistic.
  3. Stepwise regression. This combines backward and forward selection of regressors.
  4. Regularization and Selection by means of the LASSO. Here is the classic article and here is a post in this blog on the LASSO.
  5. Information criteria applied to all possible regressions – pick the best specification by applying the Aikaike Information Criterion (AIC) or Bayesian Information Criterion (BIC) to all possible combinations of regressors. Clearly, this is only possible with a limited number of potential predictors.
  6. Cross-validation or other out-of-sample criteria applied to all possible regressions– Typically, the error metrics on the out-of-sample data cuts are averaged, and the lowest average error model is selected out of all possible combinations of predictors.
  7. Dimension reduction or data shrinkage with principal components. This is a many predictors formulation, whereby it is possible to reduce a large number of predictors to a few principal components which explain most of the variation in the data matrix.
  8. Dimension reduction or data shrinkage with partial least squares. This is similar to the PC approach, but employs a reduction to information from both the set of potential predictors and the dependent or target variable.

Some more supporting posts are found here, usually with spreadsheet-based “toy” examples:

Three Pass Regression Filter, Partial Least Squares and Principal Components, Complete Subset Regressions, Variable Selection Procedures – the Lasso, Kernel Ridge Regression – A Toy Example, Dimension Reduction With Principal Components, bootstrapping, exponential smoothing, Estimation and Variable Selection with Ridge Regression and the LASSO

Plus one of the nicest infographics on machine learning – a related subject – is developed by the Australian blog Machine Learning Mastery.

MachineLearning

Behavioral Economics and Holiday Gifts

Chapter 1 of Advances in Behavioral Economics highlights the core proposition of this emerging field – namely that real economic choices over risky outcomes do not conform to the expected utility (EU) hypothesis.

The EU hypothesis states that the utility of a risky distribution of outcomes is a probability-weighted average of the outcome utilities. Many violations of this principle are demonstrated with psychological experiments.

These violations suggest “nudge” theory – that small, apparently inconsequential changes in the things people use can have disproportionate effects on behavior.

Along these lines, I found this PBS report by Paul Solman fascinating. In it, Solman, PBS economics correspondent, talks to Sendhil Mullainathan at Harvard University about consumer innovations that promise to improve your life through behavioral economics – and can be gifts for this Season. 

Happy Holidays all. 

Updates on Forecasting Controversies – Google Flu Trends

Last Spring I started writing about “forecasting controversies.”

A short list of these includes Google’s flu forecasting algorithm, impacts of Quantitative Easing, estimates of energy reserves in the Monterey Shale, seasonal adjustment of key series from Federal statistical agencies, and China – Trade Colossus or Assembly Site?

Well, the end of the year is a good time to revisit these, particularly if there are any late-breaking developments.

Google Flu Trends

Google Flu Trends got a lot of negative press in early 2014. A critical article in Nature – When Google got flu wrong – kicked it off. A followup Times article used the phrase “the limits of big data,” while the Guardian wrote of Big Data “hubris.”

The problem was, as the Google Trends team admits –

In the 2012/2013 season, we significantly overpredicted compared to the CDC’s reported U.S. flu levels.

Well, as of October, Google Flu Trends has a new engine. This like many of the best performing methods … in the literature—takes official CDC flu data into account as the flu season progresses.

Interestingly, the British Royal Society published an account at the end of October – Adaptive nowcasting of influenza outbreaks using Google searches – which does exactly that – merges Google Flu Trends and CDC data, achieving impressive results.

The authors develop ARIMA models using “standard automatic model selection procedures,” citing a 1998 forecasting book by Hyndman, Wheelwright, and Makridakis and a recent econometrics text by Stock and Watson. They deploy these adaptively-estimated models in nowcasting US patient visits due to influenza-like illnesses (ILI), as recorded by the US CDC.

The results are shown in the following panel of charts.

GoogleFluTrends

Definitely click on this graphic to enlarge it, since the key point is the red bars are the forecast or nowcast models incorporating Google Flu Trends data, while the blue bars only utilize more conventional metrics, such as those supplied by the Centers for Disease Control (CDC). In many cases, the red bars are smaller than the blue bar for the corresponding date.

The lower chart labeled ( c ) documents out-of-sample performance. Mean Absolute Error (MAE) for the models with Google Flu Trends data are 17 percent lower.

It’s relevant , too, that the authors, Preis and Moat, utilize unreconstituted Google Flu Trends output – before the recent update, for example – and still get highly significant improvements.

I can think of ways to further improve this research – for example, deploy the Hyndman R programs to automatically parameterize the ARIMA models, providing a more explicit and widely tested procedural referent.

But, score one for Google and Hal Varian!

The other forecasting controversies noted above are less easily resolved, although there are developments to mention.

Stay tuned.

Economic Outlook 2015 – I

Well, it’s that time – end of one calendar year and, soon, the beginning of another, and that means major banks and financial institutions are releasing their big picture “economic outlooks” for 2015.

Here are two well worth watching.

Jan Hatzius of Goldman Sachs provides an interesting, short discussion of the US economic outlook for 2015.

Huw Pills, also of Goldman Sachs, gives a nuanced discussion of Europe’s more vulnerable economic position for 2015.

For other regions, see Outlook 2015.

Barron’s Outlook 2015: Stick With the Bull focuses on stocks and is based on a survey of investment advisors; its outlook is decidedly upbeat.

Born in March 2009, today’s bull market is the fourth longest in history—and it isn’t about to end, despite last week’s shellacking. That’s the word from Wall Street’s top strategists, who expect the Standard & Poor’s 500 stock index to rise 10% in 2015. A gain of that magnitude surely would merit applause, coming atop an 8% rally year to date, not to mention 2013’s 30% advance. Almost six years in, the old bull still seems sprightly….

U.S. stocks are neither cheap nor expensive, based on the market’s current price/earnings ratio of 15.8 times future four-quarter earnings. Few strategists expect the multiple to expand much in the coming year.

“In isolation, U.S. stocks are on the expensive side,” says Jeffrey Knight, head of global asset allocation at Columbia Management. But measured against other financial assets—whether emerging-market equities or developed-market bonds—U.S. shares look strong, he adds.

And, in researching this article, I found Janet Yellen’s Dashboard available from the Brookings Institution website.

A lot of what happens in 2015 has to do with whether, when, and then how much the Fed raises interest rates.

I’m aiming to be as inclusive as I can in putting up these videos of the various celebrity forecasters and their outlook for 2015, so stay tuned.

2014 in Review – I

I’ve been going over past posts, projecting forward my coming topics. I thought I would share some of the best and some of the topics I want to develop.

Recommendations From Early in 2014

I would recommend Forecasting in Data-Limited Situations – A New Day. There, I illustrate the power of bagging to “bring up” the influence of weakly significant predictors with a regression example. This is fairly profound. Weakly significant predictors need not be weak predictors in an absolute sense, providing you can bag the sample to hone in on their values.

There also are several posts on asset bubbles.

Asset Bubbles contains an intriguing chart which proposes a way to “standardize” asset bubbles, highlighting their different phases.

BubbleAnatomy

The data are from the Hong Kong Hang Seng Index, oil prices to refiners (combined), and the NASDAQ 100 Index. I arrange the series so their peak prices – the peak of the bubble – coincide, despite the fact that the peaks occurred at different times (October 2007, August 2008, March 2000, respectively). Including approximately 5 years of prior values of each time series, and scaling the vertical dimensions so the peaks equal 100 percent, suggesting three distinct phases. These might be called the ramp-up, faster-than-exponential growth, and faster-than-exponential decline. Clearly, I am influenced by Didier Sornette in choice of these names.

I’ve also posted several times on climate change, but I think, hands down, the most amazing single item is this clip from “Chasing Ice” showing calving of a Greenland glacier with shards of ice three times taller than the skyscrapers in Lower Manhattan.

See also Possibilities for Abrupt Climate Change.

I’ve been told that Forecasting and Data Analysis – Principal Component Regression is a helpful introduction. Principal component regression is one of the several ways one can approach the problem of “many predictors.”

In terms of slide presentations, the Business Insider presentation on the “Digital Future” is outstanding, commented on in The Future of Digital – I.

Threads I Want to Build On

There are threads from early in the year I want to follow up in Crime Prediction. Just how are these systems continuing to perform?

Another topic I want to build on is in Using Math to Cure Cancer. I’d like to find a sensitive discussion of how MD’s respond to predictive analytics sometime. It seems to me that US physicians are sometimes way behind the curve on what could be possible, if we could merge medical databases and bring some machine learning to bear on diagnosis and treatment.

I am intrigued by the issues in Causal Discovery. You can get the idea from this chart. Here, B → A but A does not cause B – Why?

casualpic

I tried to write an informed post on power laws. The holy grail here is, as Xavier Gabaix says, robust, detail-independent economic laws.

Federal Reserve Policies

Federal Reserve policies are of vital importance to business forecasting. In the past two or three years, I’ve come to understand the Federal Reserve Balance sheet better, available from Treasury Department reports. What stands out is this chart, which anyone surfing finance articles on the net has seen time and again.

FedMBandQEgraph

This shows the total of the “monetary base” dating from the beginning of 2006. The red shaded areas of the graph indicate the time windows in which the various “Quantitative Easing” (QE) policies have been in effect – now three QE’s, QE1, QE2, and QE3.

Obviously, something is going on.

I had fun with this chart in a post called Rhino and Tapers in the Room – Janet Yellen’s Menagerie.

OK, folks, for this intermission, you might want to take a look at Malcolm Gladwell on the 10,000 Hour Rule


So what happens if you immerse yourself in all aspects of the forecasting field?

Coming – how posts in Business Forecast Blog pretty much establish that rational expectations is a concept way past its sell date.

Guy contemplating with wine at top from dreamstime.


Links – Beginning of the Holiday Season

Economy and Trade

Asia and Global Production Networks—Implications for Trade, Incomes and Economic Vulnerability Important new book –

The publication has two broad themes. The first is national economies’ heightened exposure to adverse shocks (natural disasters, political disputes, recessions) elsewhere in the world as a result of greater integration and interdependence. The second theme is focused on the evolution of global value chains at the firm level and how this will affect competitiveness in Asia. It also traces the past and future development of production sharing in Asia.

Chapter 1 features the following dynamite graphic – (click to enlarge)

GVC2009

The Return of Currency Wars

Nouriel Roubini –

Central banks in China, South Korea, Taiwan, Singapore, and Thailand, fearful of losing competitiveness relative to Japan, are easing their own monetary policies – or will soon ease more. The European Central Bank and the central banks of Switzerland, Sweden, Norway, and a few Central European countries are likely to embrace quantitative easing or use other unconventional policies to prevent their currencies from appreciating.

All of this will lead to a strengthening of the US dollar, as growth in the United States is picking up and the Federal Reserve has signaled that it will begin raising interest rates next year. But, if global growth remains weak and the dollar becomes too strong, even the Fed may decide to raise interest rates later and more slowly to avoid excessive dollar appreciation.

The cause of the latest currency turmoil is clear: In an environment of private and public deleveraging from high debts, monetary policy has become the only available tool to boost demand and growth. Fiscal austerity has exacerbated the impact of deleveraging by exerting a direct and indirect drag on growth. Lower public spending reduces aggregate demand, while declining transfers and higher taxes reduce disposable income and thus private consumption.

Financial Markets

The 15 Most Valuable Startups in the World

Uber is among the top, raising $2.5 billion in direct investment funds since 2009. Airbnb, Dropbox, and many others.

The Stock Market Bull Who Got 2014 Right Just Published This Fantastic Presentation I especially like the “Mayan Temple” effect, viz

MayanTemple

Why Gold & Oil Are Trading So Differently supply and demand – worth watching to keep primed on the key issues.

Technology

10 Astonishing Technologies On The Horizon – Some of these are pretty far-out, like teleportation which is now just gleam in the eye of quantum physicists, but some in the list are in prototype – like flying cars. Read more at Digital Journal entry on Business Insider.

  1. Flexible and bendable smartphones
  2. Smart jewelry
  3. “Invisible” computers
  4. Virtual shopping
  5. Teleportation
  6. Interplanetary Internet
  7. Flying cars
  8. Grow human organs
  9. Prosthetic eyes
  10. Electronic tattoos

Albert Einstein’s Entire Collection of Papers, Letters is Now Online

Princeton University Press makes this available.

AEinstein

Practice Your French Comprehension

Olivier Grisel, Software Engineer, Inria – broad overview of machine learning technologies. Helps me that the slides are in English.

Forecasting Holiday Retail Sales

Holiday retail sales are a really “spikey” time series, illustrated by the following graph (click to enlarge).

HolidayRetailSales

These are monthly data from FRED and are not seasonally adjusted.

Following the National Retail Federation (NRF) convention, I define holiday retail sales to exclude retail sales by automobile dealers, gasoline stations and restaurants. The graph above includes all months of the year, but we can again follow the NRF convention and define “sales from the Holiday period” as being November and December sales.

Current Forecasts

The National Retail Federation (NRF) issues its forecast for the Holiday sales period in late October.

This year, it seems they were a tad optimistic, opting for

..sales in November and December (excluding autos, gas and restaurant sales) to increase a healthy 4.1 percent to $616.9 billion, higher than 2013’s actual 3.1 percent increase during that same time frame.

As the news release for this forecast observed, this would make the Holiday Season 2014 the first time in many years to see more than 4 percent growth – comparing to the year previous holiday periods.

The NRF is still holding to its bet (See https://nrf.com/news/retail-sales-increase-06-percent-november-line-nrf-holiday-forecast), noting that November 2014 sales come in around 3.2 percent over the total for November in 2013.

This means that December sales have to grow by about 4.8 percent on a month-over-year-previous-month basis to meet the overall, two month 4.1 percent growth.

You don’t get to this number by applying univariate automatic forecasting software. Forecast Pro, for example, suggests overall year-over-year growth this holiday season will be more like 3.3 percent, or a little lower than the 2013 growth of 3.7 percent.

Clearly, the argument for higher growth is the extra cash in consumer pockets from lower gas prices, as well as the strengthening employment outlook.

The 4.1 percent growth, incidentally, is within the 97.5 percent confidence interval for the Forecast Pro forecast, shown in the following chart.

FPHolidaySales

This forecast follows from a Box-Jenkins model with the parameters –

ARIMA(1, 1, 3)*(0, 1, 2)

In other words, Forecast Pro differences the “Holiday Sales” Retail Series and finds moving average and autoregressive terms, as well as seasonality. For a crib on ARIMA modeling and the above notation, a Duke University site is good.

I guess we will see which is right – the NRF or Forecast Pro forecast.

Components of US Retail Sales

The following graphic shows the composition of total US retail sales, and the relative sizes of the main components.

USRETAILPIE 

Retail and food service sales totaled around $5 trillion in 2012. Taking out motor vehicle and parts dealers, gas stations, and food services and drinking places considerably reduces the size of the relevant Holiday retail time series.

Forecasting Issues and Opportunities

I have not yet done the exercise, but it would be interesting to forecast the individual series in the above pie chart, and compare the sum of those forecasts with a forecast of the total.

For example, if some of the component series are best forecast with exponential smoothing, while others are best forecast with Box-Jenkins time series models, aggregation could be interesting.

Of course, in 2007-09, application of univariate methods would have performed poorly. What we cry out for here is a multivariate model, perhaps based on the Kalman filter, which specifies leading indicators. That way, we could get one or two month ahead forecasts without having to forecast the drivers or explanatory variables.

In any case, barring unforeseen catastrophes, this Holiday Season should show comfortable growth for retailers, especially online retail (more on that in a subsequent post.)

Heading picture from New York Times

Sales and new product forecasting in data-limited (real world) contexts