E-Commerce Apps for Website Optimization

There are dozens of web-based metrics for assessing ecommerce sites, but in the final analysis it probably just comes down to “conversion” rate. How many visitors to your ecommerce site end up buying your product or service?

Many factors come into play – such as pricing structure, product quality, customer service, and reputation.

But real-time predictive analytics plays an increasing role, according to How Predictive Analytics Is Transforming eCommerce & Conversion Rate Optimization. The author – Peep Laja – seems fond of Lattice, writing that,

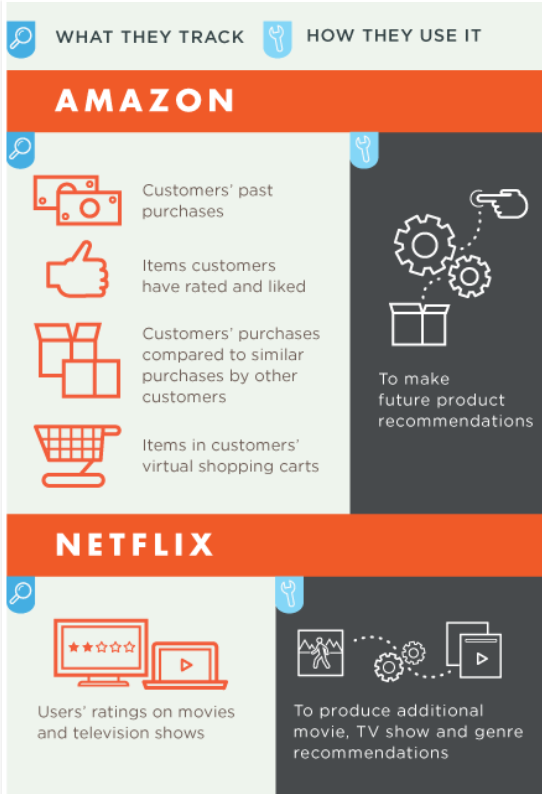
Lattice has researched how leading companies like Amazon & Netflix are using predictive analytics to better understand customer behavior, in order to develop a solution that helps sales professionals better qualify their leads.

AZNF

Laja also notes impressive success stories, such as Macy’s – which clocked an 8 to 12 percent increase in online sales by combining browsing behavior within product categories and sending targeted emails by customer segment.

Google and Bandit Testing

I find the techniques associated with A/B or Bandit testing fascinating.

Google is at the forefront of this – the experimental testing of webpage design and construction.

Let me recommend readers directly to Google Analytics – the discussion headed by Overview of Content Experiments.

What is Bandit Testing?

Well, the Google presentation Multi-armed Bandits is really clear.

This is a fun topic.

So suppose you have a row of slot machine (“one-armed bandits”) and you know each machine has different probabilities and size of payouts. How do you decide which machine to favor, after a period of experimentation?

This is the multi-armed bandit or simply bandit problem, and is mathematically very difficult.

[The bandit problem] was formulated during the [second world] war, and efforts to solve it so sapped the energies and minds of Allied analysts that the suggestion was made that the problem be dropped over Germany, as the ultimate instrument of intellectual sabotage.

The Google discussion illustrates a Bayesian algorithm with simulations, showing that updating the probabilities and flow of traffic to what appear to be the most attractive web pages results, typically, in more rapid solutions that classical statistical experiments (generally known as A/B testing after “showroom A” and “showroom B”).

Suppose you’ve got a conversion rate of 4% on your site. You experiment with a new version of the site that actually generates conversions 5% of the time. You don’t know the true conversion rates of course, which is why you’re experimenting, but let’s suppose you’d like your experiment to be able to detect a 5% conversion rate as statistically significant with 95% probability. A standard power calculation1 tells you that you need 22,330 observations (11,165 in each arm) to have a 95% chance of detecting a .04 to .05 shift in conversion rates. Suppose you get 100 sessions per day to the experiment, so the experiment will take 223 days to complete. In a standard experiment you wait 223 days, run the hypothesis test, and get your answer.

Now let’s manage the 100 sessions each day through the multi-armed bandit. On the first day about 50 sessions are assigned to each arm, and we look at the results. We use Bayes’ theorem to compute the probability that the variation is better than the original2. One minus this number is the probability that the original is better. Let’s suppose the original got really lucky on the first day, and it appears to have a 70% chance of being superior. Then we assign it 70% of the traffic on the second day, and the variation gets 30%. At the end of the second day we accumulate all the traffic we’ve seen so far (over both days), and recompute the probability that each arm is best. That gives us the serving weights for day 3. We repeat this process until a set of stopping rules has been satisfied (we’ll say more about stopping rules below).

Figure 1 shows a simulation of what can happen with this setup. In it, you can see the serving weights for the original (the black line) and the variation (the red dotted line), essentially alternating back and forth until the variation eventually crosses the line of 95% confidence. (The two percentages must add to 100%, so when one goes up the other goes down). The experiment finished in 66 days, so it saved you 157 days of testing.

This Figure 1 chart is as follows.
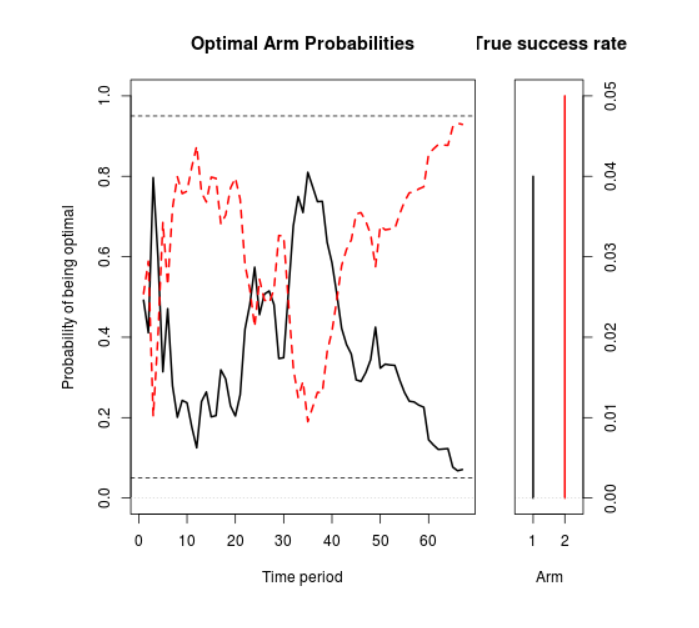
2armThis is obviously just one outcome, but running this test many times verifies that in a majority of cases, the Google algorithm results in substantial shortening of test time, compared with an A/B test. In addition, if actual purchases are the meaning of “conversion” here, revenues are higher.

This naturally generalizes to any number of “arms” or slot machines.

Apparently, investors have put nearly $200 million in 2014 into companies developing predictive apps for ecommerce.

And, on the other side of the ledger, there are those who say that the mathematical training of people who might use these apps is still sub-par, and that the full potential of these techniques may not be realized in many cases.

The deeper analytics of the Google application is fascinating. It involves Monte Carlo simulation to integrate products of conditional and prior distributions, after new data comes in.

My math intuition, such as it is, suggests that this approach has wider applications. Why could it not, for example, be utilized for new products, where there might be two states, i.e. the product is a winner (following similar products in ramping up) or a loser? It’s also been used in speeding up health trials – an application of Bayesian techniques.

Top graphic from the One Hour Professor
e-commerce and Forecasting

The Census Bureau announced numbers from its latest e-commerce survey August 15.

The basic pattern continues. US retail e-commerce sales increased about 16 percent on a year-over-year basis from the second quarter of 2013. By comparison, total retail sales for the second quarter 2014 increased just short of 5 percent on a year-over-year basis.

 ecommercepercent

As with other government statistics relating to IT (information technology), one can quarrel with the numbers (they may, for example, be low), but there is impressive growth no matter how you cut it.

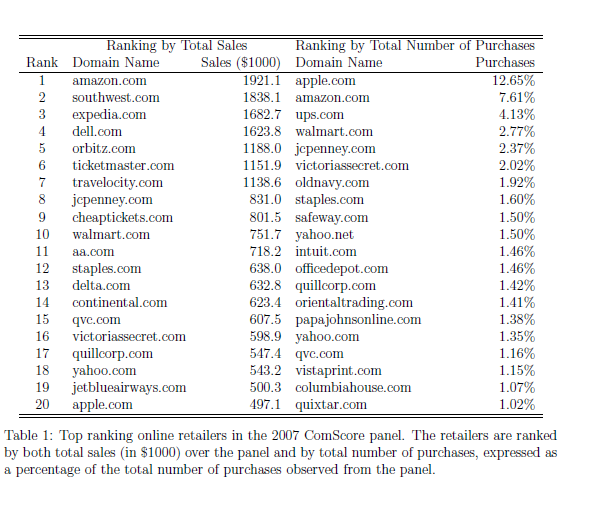
Some of the top e-retailers from the standpoint of clicks and sales numbers are listed in Panagiotelis et al. Note these are sample data, from comScore with the totals for each company or site representing a small fraction of their actual 2007 online sales.

eretailers

Forecasting Issues

Forecasting issues related to e-commerce run the gamut.

Website optimization and target marketing raise questions such as the profitability of “stickiness” to e-commerce retailers. There are advanced methods to tease out nonlinear, nonnormal multivariate relationships between, say, duration and page views and the decision to purchase – such as copulas previously applied in financial risk assessment and health studies.

Mobile e-commerce is a rapidly growing area with special platform and communications characteristics all its own.

Then, there are the pros and cons of expanding tax collection for online sales.

All in all, Darrell Rigby’s article in the Harvard Business Review – The Future of Shopping – is hard to beat. Traditional retailers generally have to move to a multi-channel model, supplementing brick-and-mortar stores with online services.

I plan several posts on these questions and issues, and am open for your questions.

Top graphic by DIGISECRETS

Calling the Next Recession – The Need for New Policy Responses

Yesterday I saw a headline on Reuters,

U.S. retail sales pause, seen rebounding in months ahead

with a story that made the best out of a recent stall in US consumer spending, especially for cars.

I also noticed –

Japan’s Economy Contracts Sharply

Real gross domestic product, the total value of all goods and services produced in the economy, shrank 6.8% in the three months through June on an annualized basis from the prior quarter

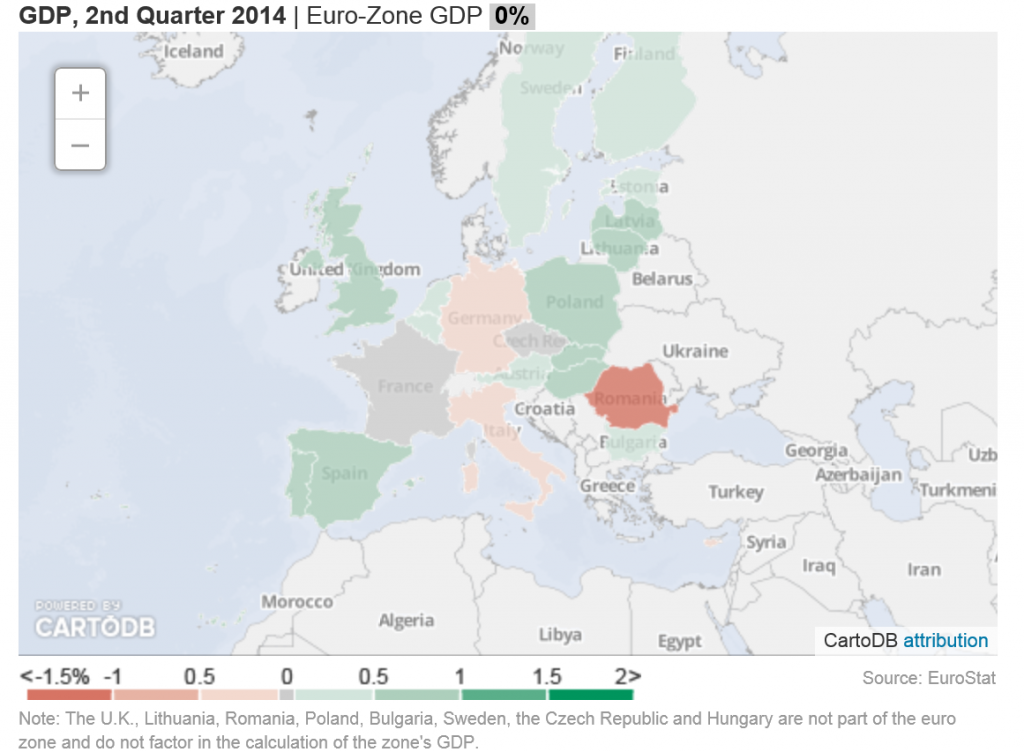
In Europe, the economic tea leaves suggest a developing recession in Italy, negative growth in Germany, and stasis in France, as highlighted in this Wall Street Journal graphic.

EUprospects

Mish Shedlock, furthermore, is all over the bizarre new data coming out of China on bank loans in the standard and shadow banking systems.

New Yuan Loans and Shadow Banking Collapse in China; Record Bank Deposit Slump

All this after the 1st Quarter surprise drop in US real GDP of -2.7 percent, quarter-over-quarter.

A Note on How I Forecast the Global Economy

So my experience is with enterprise level IT companies with markets in the major global economic regions – Europe, Japan, China, the US and the ROW (rest of the world).

The idea is to keep tabs on regional developments to predict sales and, in some respects, to mix and match resources to the most promising markets.

After you do this for a while, it’s obvious there are interdependencies between these markets, in particular trade interdependencies.

Europe provides a large market for Chinese products – a market which has flagged in recent years with prolonged economic troubles in peripheral EU zone areas. The United States also provides China important markets for its goods.

Japan, as one of the largest economies in the world, is in the mix here too.

Bottom line – if all the major global economic regions (except South America?) are flagging, a synchronized global recession is increasingly likely.

What the Problem Is

This is sort of a “plain-vanilla” forecast, and might be fine-tuned with quantitative models – although none of these is especially accurate on a global scale.

But the deeper issue and problem has to do with the US Federal Reserve and many other central banks. And the failure to follow standard fiscal policy measures during the last economic downturn.

A new recession in the United States in 2014 or 2015 would find the US Federal Reserve Bank with no policy tools. The federal funds rate, the overnight rate directly controlled by the Fed, currently is virtually zero. The bond-buying program known as “quantitative easing (QE)” is scheduled to end in October, which means it is still running. The Fed balance sheet already includes more than $4 trillion in liabilities, more than 75 percent of which were incurred fighting the last recession.

That leaves fiscal policy as the only real response to a new recession.

However, the prospects for Congress to step up to the bat in the next two years do not look good.

Barry Ritholtz highlights the problem with Congress in a recent Bloomberg column – Naming the Biggest Losers in America.

The drag from federal government usually is a simple and obvious fix. During a recession and recovery, spending should rise and the Fed should make credit less expensive.

Except in this cycle. Before you start telling me about beliefs and ideology and the deficit, all one needs to do is compare federal spending during the 2001 recession cycle, with a Republican controlling the White House and a split Congress, to the present cycle. Apparently, the importance of reducing deficits and having a smaller government only applies when the GOP doesn’t control the White House.

Look also at state and local government, another huge drag on the economy. Block grants to the states could have helped to pay for police, emergency workers, teachers, road and bridge maintenance as they have in past recessions. But they weren’t, for partisan political reasons. The nation is worse off for it.

Business equipment investment and other forms of capital expenditures have been jump started with an accelerated depreciation tax allowances in past recessions. For some reason, this was allowed to lapse in 2013. This wasn’t very smart; if anything, they should have been extended and made more aggressive.

The biggest drag of all has been the persistent weakness in residential real estate. The recent increases in home prices are the result of record-low mortgage rates and limited inventory, not an economic recovery. As we noted in “The Best Housing Program You’ve Never Heard Of,” there were some attempts to ameliorate this, but they amounted to too little too late.

The bottom line is that as a nation, and mainly because of Congress, we haven’t risen to the challenges we face. There has been little intelligence, no creativity, negligible cooperation, and an epic failure of civic responsibility.

Amen.

Reflections

All this highlights for me that we need to face facts on US Federal Reserve policy, which currently is stuck at the zero lower bound for the federal funds rate and is still buying long term bonds.

The next recession is likely to hit before the Fed “normalizes” interest rates and its QE programs.

Also, the character of the US Congress is unlikely to convert en masse to Keynesian economics in the next two years.

This means, in turn, that unorthodox measures to stimulate the US and global economy will be necessary.

What are they?

First peek at “Revolutions” exhibit at Computer History Museum with Woz

I think Steve Wozniack is a kind of hero – from what I understand still connected with helping young people and in this video, giving some “straight from the horses mouth” commentary on the history of computing. 

And I am making plans to return to pattern on this blog.

That is, I will be focusing on issues tagged a couple of posts ago – namely geopolitical risks (ebola, unfolding warfare at several locations), the emerging financial bubble, and 21st century data analysis and forecasting techniques.

But, I think perhaps a little like Woz, I am a technological utopian at heart. If we could develop technologies which would allow younger people around the globe some type of “hands on” potential – maybe a little like the old computer systems which these technical leaders, now mostly all billionaires, had access to – if we could find these new technologies, I think we could knit the world together once again. Of course, this idea devolves when the “hands on” potential is occasioned by weapons – and the image of the child soldiers in Africa comes to mind.

I like the part in the video where Woz describes using a nonstandard card punch machine to get his card deck in order at Berkeley – the part where he draws a lesson about learning to do what works, not what the symbols indicate.

Walmart and China – Icons of the Age

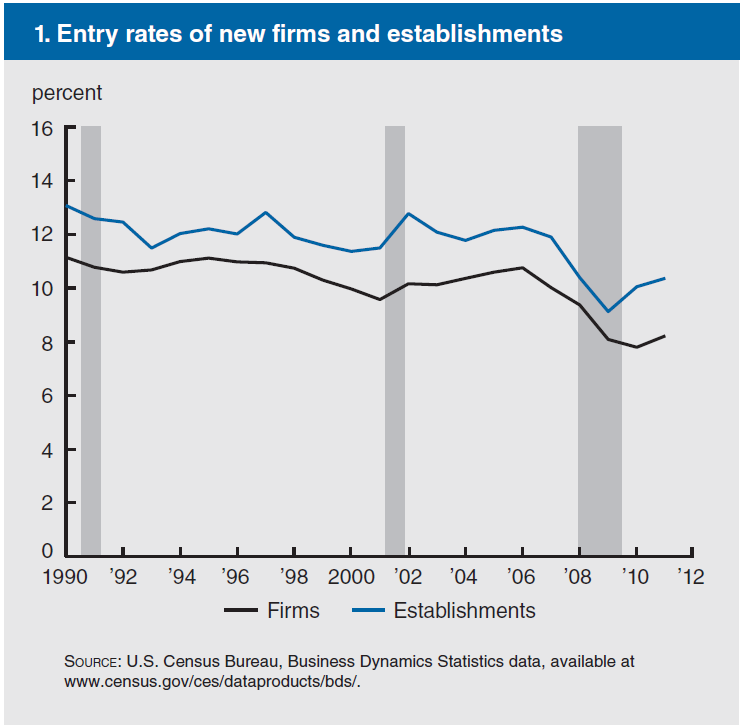
Here’s a puzzle. Why has the rate of new business creation declined fairly consistently for the past 20 or so years? This contrasts with the idea the US is an entrepreneurial nation, that it is the heartland of the “free market” and place where new jobs are created by myriads of startups.

newbuscreate

This pattern is well-established, and is validated by several sources, including a recent Brookings report and Letter of the Chicago Federal Reserve Bank.

There are a cluster of causes, but two words are iconic – Walmart and China.

The Big Box store is a major factor behind the decline in small business startups, with Walmart being the leading superstore. And, for the most part, Big Box stores act as conduits for Chinese-made consumer goods.

Superstore Community Impact

In 2012, Walmart employed about 1 percent of the American workforce in its nearly 5000 stores, and clocked sales of $444 billion in the $17 trillion US economy overall. Certainly significant.

The story is that a Walmart comes to town and Mainstreet shutters up, becomes a ghost town. Gone are dozens of small proprietors and, many say, the sense of community. Instead we have endless aisles of cheap products from China – aisles where clerical assistance is scanty and the clerks often seem kind of lost in the vastness of it all.

Well, elements of this story are well-documented.

For example, there is a great website maintained by the Kennedy School at Harvard which updates the impact studies, even linking the coming of Walmart to an increase in obsesity somehow (lower wages, cheaper deep fat fried food?).

The first Walmart, Target, and K-Mart stores opened in 1962 with a focus on deep discounts and suburban locations.

In the five decades since, the American retail landscape and built environment have been profoundly altered. At the end of 2013, Wal-Mart had 4,700 stores in the United States and Puerto Rico, while Target operated nearly 1,800 locations and Kmart just over 1,200. Then there are smaller chains — still huge by any measure — as well as “category killers” and all the diverse residents of the shopping-mall ecosystem.

Selling a Cheaper Mousetrap: Wal-Mart’s Effect on Retail Prices shows that Wal-Mart’s price impact is large and can be beneficial to consumers.

The analysis combines data on the opening dates of all US Wal-Mart stores with average city-level retail prices of several narrowly-defined commonly-purchased goods over the period 1982-2002. I focus on 10 specific items likely to be sold at Wal-Mart stores and analyze their price dynamics in 165 US cities before and after Wal-Mart entry. I find price declines of 1.5%-3% for many products in the short run, with the largest price effects occurring for aspirin, laundry detergent, toothpaste and shampoo. Long-run price declines tend to be much larger, and in some specifications range from 7-13%. These effects are driven mostly by relatively small cities, which have high ratios of retail establishments to population.

The redoubtable Jerry Hausman of MIT argues that the Bureau of Labor Statistics (BLS) Consumer Price Index (CPI) calculations should be adjusted downward, when full account of Walmart and other superstores’ impact on retail is folded into the calculation.

The jobs impact has been widely studied and is difficult to assess in a controlled framework, but one thing is certain – pay is generally lower (partly since there are no more owner/operators). See also A Downward Push.

One question is whether this is a race to the bottom. But the antidote, should this be true, is not my immediate focus. Rather I want to try to trace the connections between the Big Box stores and other collateral and linked developments.

Big Box Stores as Channels For Chinese Goods

There’s a scrappy website that sends people to check where the goods in Target, K-Mart and Walmart come from – concluding that the vast majority of goods are made in China.

Again, Walmart is iconic.

The Wal-Mart effect claims that Wal-Mart was responsible for $27 billion in U.S. imports from China in 2006 and 11% of the growth of the total U.S. trade deficit with China between 2001 and 2006

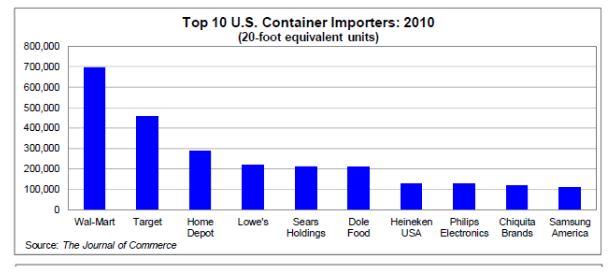
Cargo containers are the innovation which makes this possible, and there is no clearer evidence for the supply sources for the Big Box stores than their record of imports with cargo containers.

This chart shows the number of standard-sized containers going to the top ten container importers.

top10

So the supply-chain extends from Guandong Province to Kansas City, using cargo containers which are first shipped on the ocean, then loaded onto rail cars or trucks and moved to distribution centers, then put out on shelves in the Big Box stores.

China and US Manufacturing

It is no secret that Chinese tools, Chinese-made textiles, and Chinese-assembled electronics generally are cheaper than equivalent goods made in the United States. And it is not just China. There are other low wage supply areas, such as the Malquidores along the border with Mexico and in Guadalahara, as well as contract manufacturers in Vietnam and Eastern Europe.

But, again, China-made consumer goods are iconic, and they have displaced US-made products across a swath of markets.

The Economic Policy Institute (EPI) estimated in 2007 that Chinese-made goods for Walmart alone displaced 200,000 US jobs.

Altogether over the period 2001 to 2006 the US trade deficit with China is estimated to have eliminated 1.8 million US jobs.

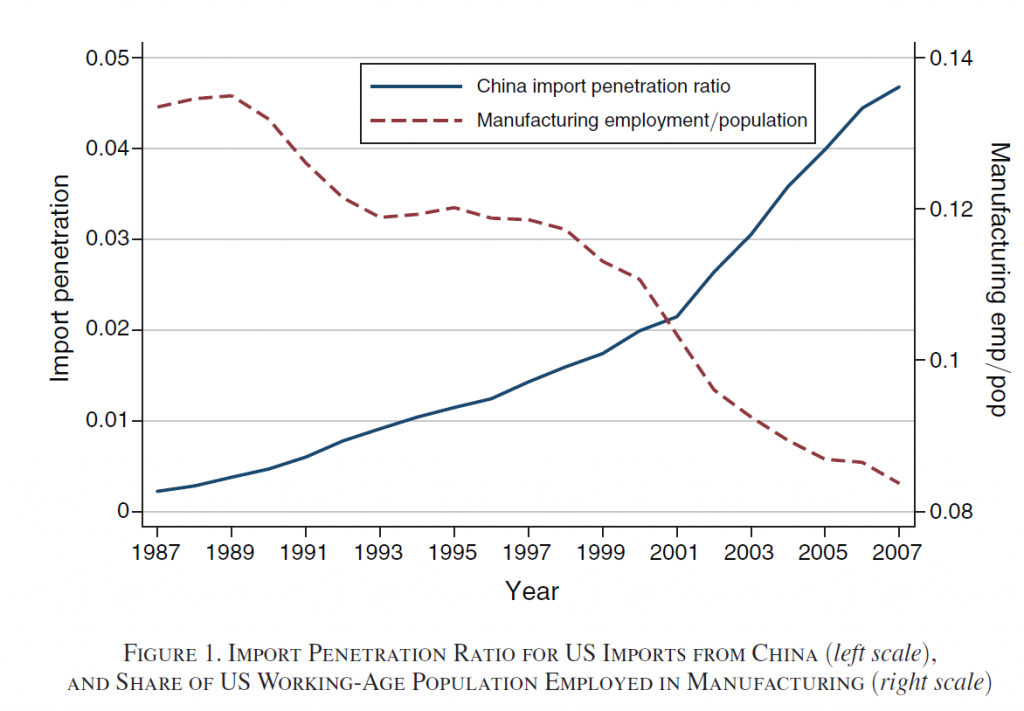
Interestingly, this estimate, developed by a left-leaning research institute in the middle of the last decade, is now more-or-less echoed by mainstream economics – or at least by recent research published in the American Economic Review.

The China Syndrome: Local Labor Market Effects of Import Competition in the United States

Chinabad1

We find that local labor markets that are exposed to rising low-income-country imports due to China’s rising competitiveness experience increased unemployment, decreased labor-force participation, and increased use of disability and other transfer benefits, as well as lower wages.

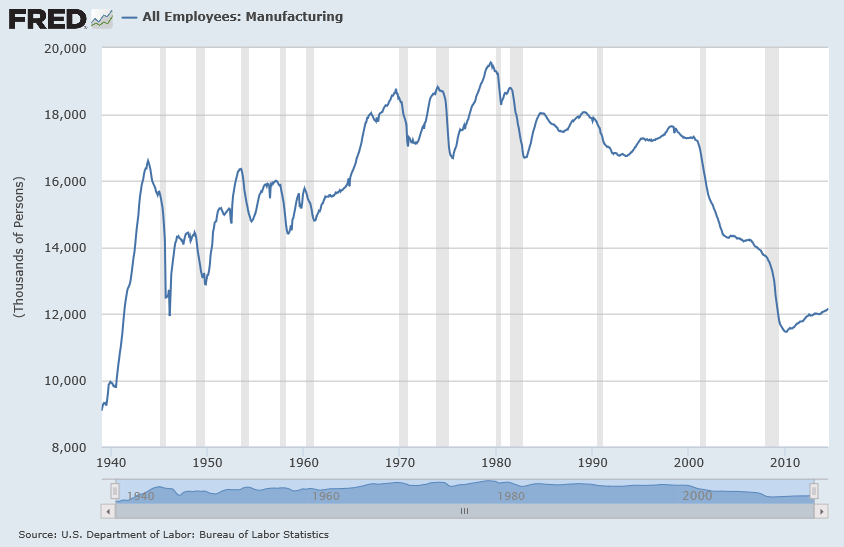
Just to be clear, here is a chart showing the dynamics of US manufacturing employment over the last 60 or so years.

Manuemp

US employment in manufacturing has fallen to the level it was in the late 1940’s.

Additionally, about 4 million of the 12 million persons currently employed in manufacturing are administrative and support personnel.

The US Trade Deficit

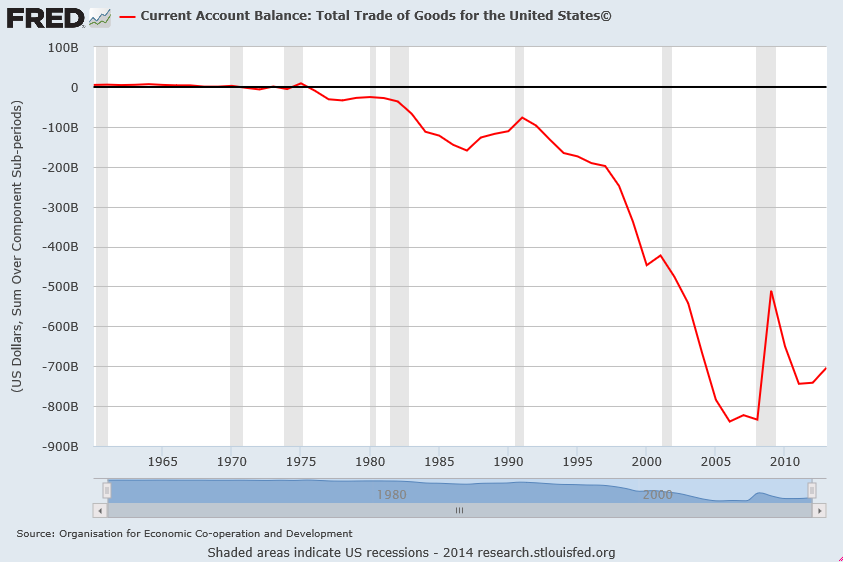
While we are viewing a collage of graphs on the US condition, let’s not forget this memorable chart of the US trade deficit.

tradedeficit

Interestingly, the US balance of trade went south in synch with the activities of the World Trade Organization and agreements on opening trade around the world.

Of course, Walmart is not exclusively or even entirely responsible for these developments, but is part of the story.

Summing Up

Well, I began with the puzzle of the decline in new business formation in the US, focusing on Walmart and then Chinese products. Along the way, I highlight other possible connections, such as decline of US manufacturing employment and lower wages as well as prices.

Any exploration along these lines is bound to seem anecdotal, but at least there are numbers and charts to speak for themselves, to an extent.

On the one hand, we have new shopping centers with Big Box stores springing up all over the place, limiting opportunities for smaller businesses in the community. On the other hand, there is decline of US manufacturing, and loss of jobs accessible to persons without college education or special skills, jobs that can pay about double or triple what standard fast food sector jobs pay.

These twin trends clearly drive polarization of the US economy and society, mitigated to a degree by the lower cost of consumer goods supplied under this new system.

Looking ahead, can the magic of cheap imports can go on indefinitely?  There are bottlenecks of workers with certain skills now emerging in China, and wages are rising there.

Possibly, contract manufacturers and joint ventures can move on to other locales, like Vietnam or Bangladesh.

But at some point, geopolitical risk and problems of infrastructure may slow outsourcing.

One thing – the rejoicing about “in-sourcing” – factories coming back state-side – seems premature, almost an example of wishful thinking.  There are few numbers to back up the happy talk.

In the meanwhile, the slack thinking of American elites to the effect that it’s not necessary and may even be counterproductive to really educate a workforce that will predominately occupy low-paying service sectors jobs may come back to haunt us.

Investments in infrastructure are lagging. Federal spending on medical research has been cut back. Expenditures on R&D are flat to declining in many fields.

Practically the only “deal” available to many younger people without pedigrees or family resources is the US military. And production of defense goods is one area of US manufacturing where high performance activity continues – although offshore contracts there could, in my opinion, sap or even sabotage the ultimate performance of the equipment and material.

I’m working on companion pieces in coming weeks. I want to develop a big picture of the US economy and society at this moment, although I will continue to focus on business forecasting per se in the posts.

When the Going Gets Tough, the Tough Get Going

Great phrase, but what does it mean? Well, maybe it has something to do with the fact that a lot of economic and political news seem to be entering kind of “end game.” But, it’s now the “lazy days of summer,” and there is a temptation to sit back and just watch it whiz by.

What are the options?

One is to go more analytical. I’ve recently updated my knowledge base on some esoteric topics –mathematically and analytically interesting – such as kernel ridge regression and dynamic principal components. I’ve previously mentioned these, and there are more instances of analysis to consider. What about them? Are they worth the enormous complexity and computational detail?

Another is to embrace the humming, buzzing confusion and consider “geopolitical risk.” The theme might be the price of oil and impacts, perhaps, of continuing and higher oil prices.

Or the proliferation of open warfare.

Rarely in recent decades have we seen outright armed conflict in Europe, as appears to be on-going in the Ukraine.

And I cannot make much sense of developments in the Mid-East, with some shadowy group called Isis scooping up vast amounts of battlefield armaments abandoned by collapsing Iraqi units.

Or how to understand Israeli bombardment of UN schools in Gaza, and continuing attacks on Israel with drones by Hamas. What is the extent and impact of increasing geopolitical risk?

There also is the issue of plague – most immediately ebola in Africa. A few days ago, I spent the better part of a day in the Boston Airport, and, to pass the time, read the latest Dan Brown book about a diabolical scheme to release an aerosol epidemic of sorts. In any case, ebola is in a way a token of a range of threats that stand just outside the likely. For example, there is the problem of the evolution of immune strains of bacteria, with widespread prescription and use.

There also is the ever-bloating financial bubble that has emerged in the US and elsewhere, as a result of various tactics of central and other banks in reaction to the Great Recession, and behavior of investors.

Finally, there are longer range scientific and technological possibilities. From my standpoint, we are making a hash of things generally. But efforts at political reform, by themselves, usually fall short, unless paralleled by fundamental new possibilities in production or human organization. And the promise of radical innovation for the betterment of things has never seemed brighter.

I will be exploring some of these topics and options in coming posts this week and in coming weeks.

And I think by now I have discovered a personal truth through writing – one that resonates with other experiences of mine professionally and personally. And that is sometimes it is just when the way to going further seems hard to make out that concentration of thought and energies may lead to new insight.

Links early August 2014

Economy/Business

Economists React to July’s Jobs Report: ‘Not Weak, But…’

U.S. nonfarm employers added 209,000 jobs in July, slightly below forecasts and slower than earlier gains, while the unemployment rate ticked up to 6.2% from June. But employers have now added 200,000 or more jobs in six consecutive months for the first time since 1997.

The most important charts to see before the huge July jobs report – interesting to see what analysts were looking at just before the jobs announcement.

Despite sharp selloff, too early to worry about a correction

Venture Capital: Deals Beyond the Valley

7 Most Expensive Luxury Cars

BMW

Base price $136,000.

Contango And Backwardation Strategy For VIX ETFs Here you go!

Climate/Weather

Horrid California Drought Gets Worse Has a map showing drought conditions at intervals since 2011, dramatic.

IT

Amazon’s Cloud Is Growing So Fast It’s Scaring Shareholders

Amazon has pulled off a pretty amazing trick over the past decade. It’s invented and then built a nearly $5 billion cloud computing business catering to fickle software developers and put the rest of the technology industry on the defensive. Big enterprise software companies such as IBM and HP and even Google are playing catchup, even as they acknowledge that cloud computing is the tech industry’s future.

But what kind of a future is that to be? Yesterday Amazon said that while its cloud business grew by 90 percent last year, it was significantly less profitable. Amazon’s AWS cloud business makes up the majority of a balance sheet item it labels as “other” (along with its credit card and advertising revenue) and that revenue from that line of business grew by 38 percent. Last quarter, revenue grew by 60 percent. In other words, Amazon is piling on customers faster than it’s adding dollars to its bottom line.

The Current Threat

Infographic: Ebola By the Numbers

ebola

Data Science

Statistical inference in massive data sets Interesting and applicable procedure illustrated with Internet traffic numbers.

Video Friday – the Outlook for the Rest of the Year

Here is the latest Wells Fargo economic outlook video, featuring John Silvia – one of the top forecasters, according to Bloomberg.

 Then, there is David Stockman, reminding us all about geopolitical and financial risks just at the time the Malaysian airliners got shot out of the sky.

Stockman, former Reagan Budget Director and Wall Street operator, has really become what commentators generally call an “iconoclast.”

And, I’m sorry, but I find it most useful to draw opinions from across a wide range. “Triangulation” is my best method to arrive at a perspective on the future.

Random Cycles

In 1927, the Russian statistician Eugen Slutsky wrote a classic article called ‘The summation of random causes as the source of cyclic processes,’ a short summary of which is provided by Barnett

If the variables that were taken to represent business cycles were moving averages of past determining quantities that were not serially correlated – either real-world moving averages or artificially generated moving averages – then the variables of interest would become serially correlated, and this process would produce a periodicity approaching that of sine waves

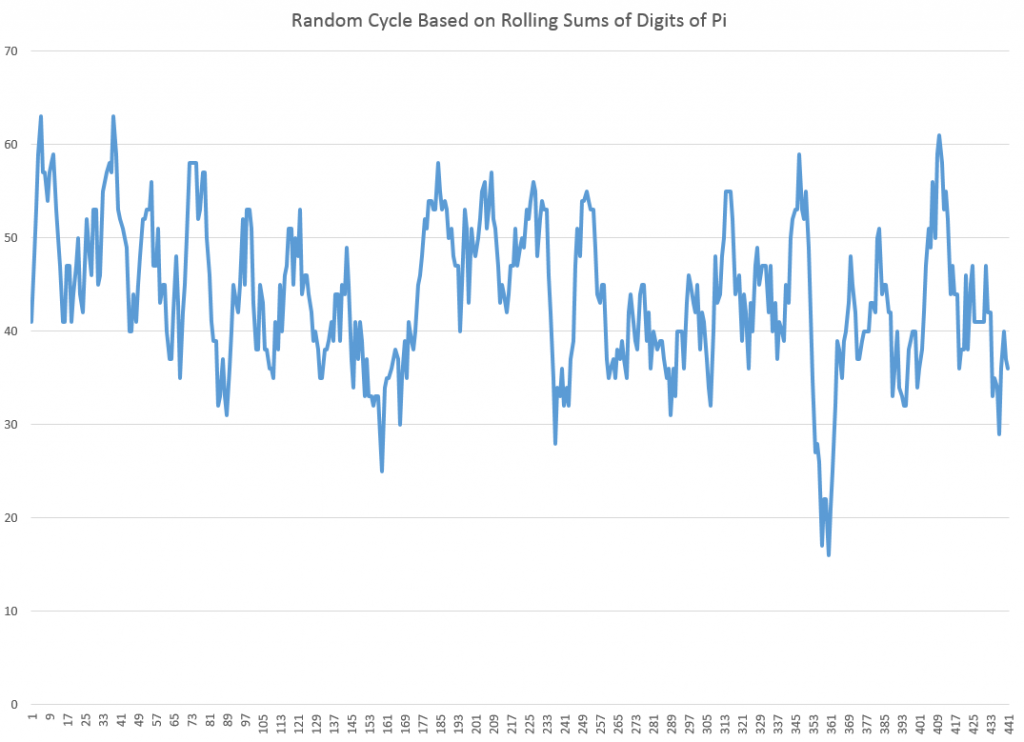
It’s possible to illustrate this phenomena with rolling sums of the digits of pi (π). The following chart illustrates the wave-like result of charting rolling sums of ten consecutive digits of pi.

picycle

So to be explicit, I downloaded the first 450 digits of pi, took them apart, and then graphed the first 440 rolling sums.

The wave-like pattern Illustrates a random cycle.

Forecasting Random Cycles

If we consider this as a time series, each element xk is the following sum,

xk = dk+dk-1+..+dk-10

where dj is the jth digit in the decimal expansion of pi to the right of the initial value of 3.

Now, apparently, it is not proven that the digits of pi are truly random, although one can show that, so far as we can compute, these digits are described by a uniform distribution.

As far as we know, the probability that the next digit will be any digit from 0 to 9 is 1/10=0.1

So as one moves through the digits of pi, generating rolling sums, each new sum means the addition of a new digit, which is unknown and can only be predicted up to its probability. And, at the same time, a digit at the beginning of the preceding sum drops away in the new sum.

Note also that we can always deduce what the series of original digits is, given a series of these rolling sums up to some point.

So the issue is whether the new digit added to the next sum is greater than, equal to, or less than the leading digit of the current sum – which is where we now stand in this sort of analysis. This determines whether the next rolling sum will be greater than, equal to, or less than the current sum.

Here’s where the forecasts can be produced. If the rolling sum is large enough, approaching or equal to 90, there is a high probability that the next rolling sum will be lower, leading to this wave-like pattern. Conversely, if the rolling sum is near zero, the chances are the subsequent sum will be larger. And all this arm-waving can be complemented by exact probabilistic calculations.

Some Ultimate Thoughts

It’s interesting we are really dealing here with a random cycle. That’s proven by the fact that, at any time, the series could go flat-line or trace out some other kind of weird movement.

Thus, the quasi-periodic aspect can be violated for as many periods as you might choose, if one arrives at a run of the same digit in the expansion of pi.

This reminds me of something George Gamow wrote in one of his popular books, where he discusses thermodynamics and the random movement of atoms and molecules in the air of a room. Gamow observes it is entirely possible all the air by chance will congregate in one corner, leaving a vacuum elsewhere. Of course, this is highly improbable.

The only difference would be that there are a finite number of atoms and molecules in the air of any room, but, presumably, an infinite number of digits in the expansion of pi.

The morale of the story is, in any case, to be cautious in imposing a fixed cycle on this type of series.

Sales and new product forecasting in data-limited (real world) contexts