The Distribution of Income and Wealth – Global Estimates

There’s a lot of buzz about Thomas Piketty’s work Capital in the Twenty-First Century which altogether runs 685 pages in the hardcover edition.

I’m reading it. It’s well written and, for the material, entertaining, with entertaining allusions and examples from literature and other media (TV, film). I’m not prepared or willing, at this point, to comment on key contentions – such as whether the rate of return on capital r tends historically to be greater than g, the overall growth rate of the economy. The basic finding that the distribution of wealth is growing significantly more unequal once, of course, is rock solid.

The following links fill in some of the contemporary context on income and wealth distribution, which might help if you read the book and which have clear implications for business and marketing, if you think things through and get the trends right.

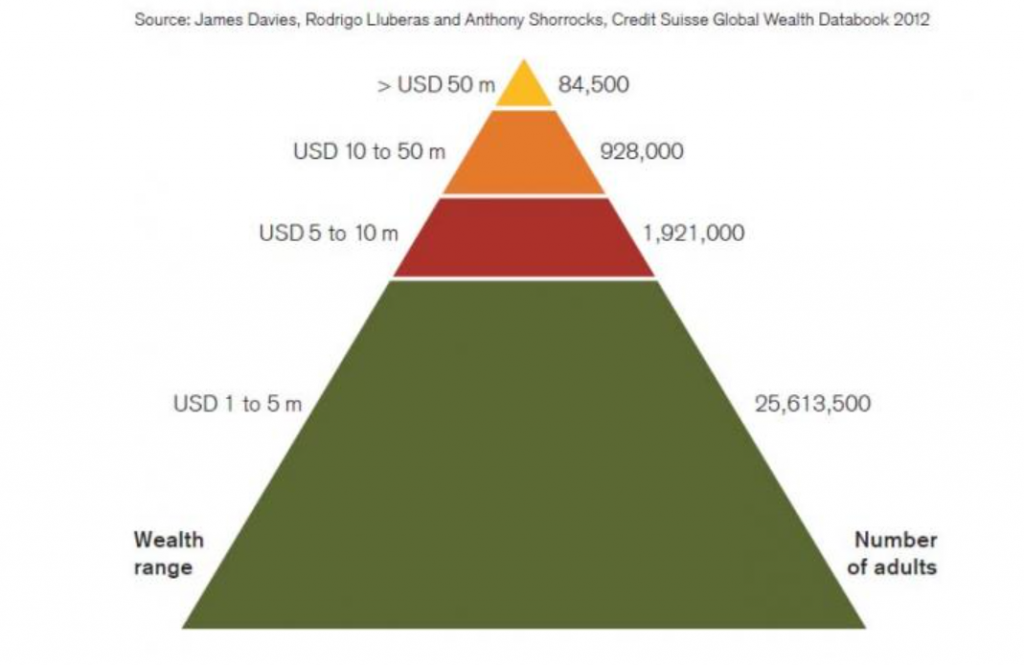
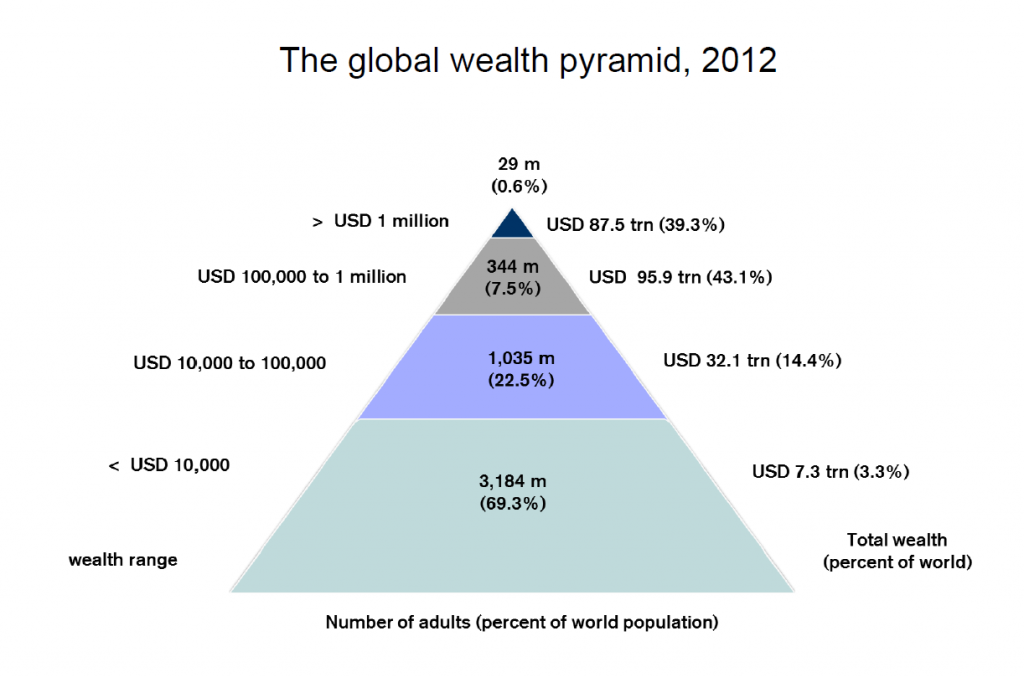
Wealth is different from income, of course. Here is a graphic taking a swipe at estimating the global distribution of wealth (2012 OECD Forum).

globalwealth

The estimate here is there are, globally, about 29 million millionaires, as individuals. That estimate masks, of course, significant within-group differences, as is shown in the following detail on the apex of the pyramid.

apex

Similarly, detail for the bottom of the global wealth pyramid, where average individual wealth is less than 10,000 US dollar equivalents, can be expanded.

Felix Salmon reports that the poorest 2 billion persons in the global population actually have negative net worth. So based on the data source for the above pyramids, the bottom 30 percent of global population has a negative net worth of about half a trillion dollar equivalents. They owe it to the company store, the landlord, to petty lenders, to Uncle Omar and so forth.

Note these charts are cast in terms of adults. The total global population currently is about 7.2 trillion so without making an exact translation, this means billions of children are being raised in extreme poverty.

In the US, about 50 percent of the US population is reported to have zero net wealth.

In 2006, about 4 trillion persons are estimated to subsist on less than $10 per day or an annual individual income of less than $3,650 a year in dollar equivalents. About 2.4 trillion persons in 2006 lived on less than $5 a day.

Some Implications

Electronics and especially cell phones intersect with these numbers in a dynamic way. The cell phone is a vital investment for some remote farming villages. Families can scrape together the $100 or so for an “inexpensive” phone and have a kind of business, renting it to members of the community to check prices in local markets, keep in touch with family, and so forth.

And, in general, declining unit prices of information processing mean that more and more of the global population is interconnected and have access, in some fashion, to global markets and communications.

Anyway, here is Thomas Piketty on economic inequality.

Top photo from http://blog.wycliffe.org/2012/04/16/featured-photo-from-the-field-rich-and-poor/


The Next Recession – Will It Be A Global Meltdown?

One my focuses is the global economy and any cracks in the firmament which might presage the next recession. I rely a lot on my Twitter account to keep me on the crest of the wave, in this regard.

I’m really concerned, as are many of my colleagues and contacts in business and government.

We’ve hardly escaped the effects of last recession 2008-2009. Those are US dates, of course, set by the National Bureau of Economic Research (NBER) the official recession “dater” in this country.

There have been a series of rolling impacts and consequences of this so-called “Great Recession.”

Europe

Housing or real estate bubbles were present in Europe, too, particularly in Spain and Ireland. Then, there was the problem of the Greek economy and state, which did not support the level of public debt that had been garnered by, in some cases, corrupt public officials. And European problems were complicated by the currency union of the euro in a context where there is not, as yet, a centralized EU state. Anyway, not to reprise the whole matter blow-by-blow, but most of Europe, with the exception of Germany, plunged into recession and struggled with austerity policies that made things worse for Main Street or, as they like to say in Britain, “High Street.”

Many European countries are just now coming out of recession, and overall, the growth rate in the EU area is almost indistinguishable from zero.

So another recession in the next one to two years would really set them back.

China

Part of the problem China has been experiencing is related to the persisting downturn in most of Europe, since Europe is a big trading partner. And so, for that matter is the United States, which bought less from China during the recession years.

But another problem is that China now is experiencing a mojo big property bubble of its own.

Newly wealthy Chinese do not really have any place to put their money, except real estate. The Chinese, like the Japanese, are big savers, and for many middle class families, buying the second apartment or even a house is an investment for the future. Yet Chinese real estate prices have skyrocketed, leaving the average Chinese wage earner in the dust, with less and less hope of ever owning a residence.

Apparently, in connection with this real estate speculation, a large shadow banking system has emerged. Some estimates circulate on Twitter suggesting this rivals the size of the official Chinese banking system.

Can “market socialism” or “market Leninism” experience a financial crisis, based on too many debts that cannot be paid?

I’ve been to China a few times, and done some business there – all the while trying to understand how things are set up. My feeling is that one should not impute banking practices that seem pro forma in, say, Great Britain or the US, to the Chinese. I think they are much more ready to “break the rules” in order to keep the party going (which is sort of a pun).

Having said that, I do think a Chinese crisis could develop if property values collapse, as they are wont to do in bubble mode.

Again, it’s hard to say how this might play out, since the victims and suffering would be among the nouveau riche of China, of whom there are millions, and many more average families who have invested their nest egg in a hot property.

But I can’t think that collapse of real estate values in modern China would not have worldwide repurcussions.

The Rest of the World

Regrettably, I cannot go through other major regions, one-by-one, but I’d have to say that things are not so good. The BRIC’s as a group all have more problems than a few years back, when they were hailed as the bright new centers of economic growth by that Goldman Sachs analyst. That’s Brazil, Russia, India, and China, of course.

Possibilities of Increased Conflict

There is a kind of axiom of geopolitics and social interaction that when the pie is growing and everybody can get more, even though their slice may not have been very big to begin with, there is a tendency for people to make do, go about their business and so forth. Reverse this and you have the concept that shrinking the pie – as austerity policies and the Great Recession have done – tends to increase levels of conflict. At first, to the extent that people have the idea that “we are all in this together” there may be increased cooperation. But that is not the current situation in almost any society. Quite the contrary, as Piketty and the Occupy Movement highlight, there is growing awareness of inequality of wealth and income.

There are armed conflicts in Syria, the Ukraine, Afghanistan (resurgent Taliban), and areas and regions in Africa. The Indian elections recently installed a Hindu nationalist who hopefully will be a reformer, but may, if the going gets tough, revert or acquiesce to more conflict with Pakistan and with non-Hindu populations within India. Pakistan, one of the world’s nuclear powers, appears to be extremely unstable politically. There are deep civil divisions in Thailand between city and rural areas that parallel class divisions. China is flexing its muscles in the South China Sea.

And we may be moving from an era of US-centric global capitalism to a time when the Eurasian supercontinent will become significantly more important and perhaps decoupled from Wall Street and the City of London. Already, there are threats to dollar supremacy, and, historically, as US economic power is eclipsed by the more rapidly growing economies of Asia, some adjustment seems predictable.

In all this, Hollywood can be counted on to roll out some really corking new international intrigue films, perhaps (although I doubt it) with more complex plots.

The Situation with the US Federal Reserve Bank

The point of this international survey and reprise of recent business history is to highlight areas where surprises may originate, shaking the markets, and perhaps triggering the next recession.

But the most likely suspect is the US Federal Reserve Bank.

Two graphs speak volumes.
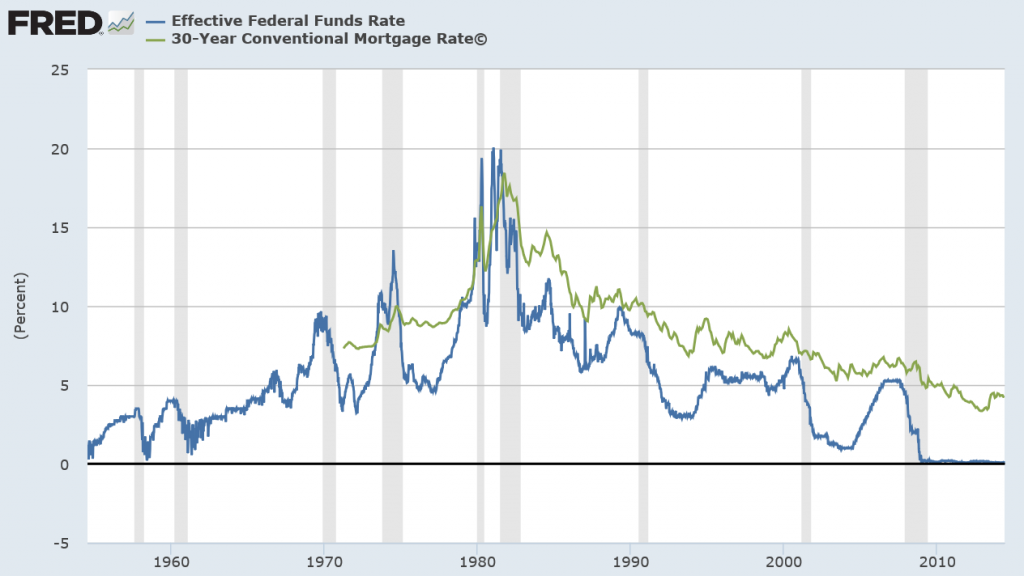
interestratesnew

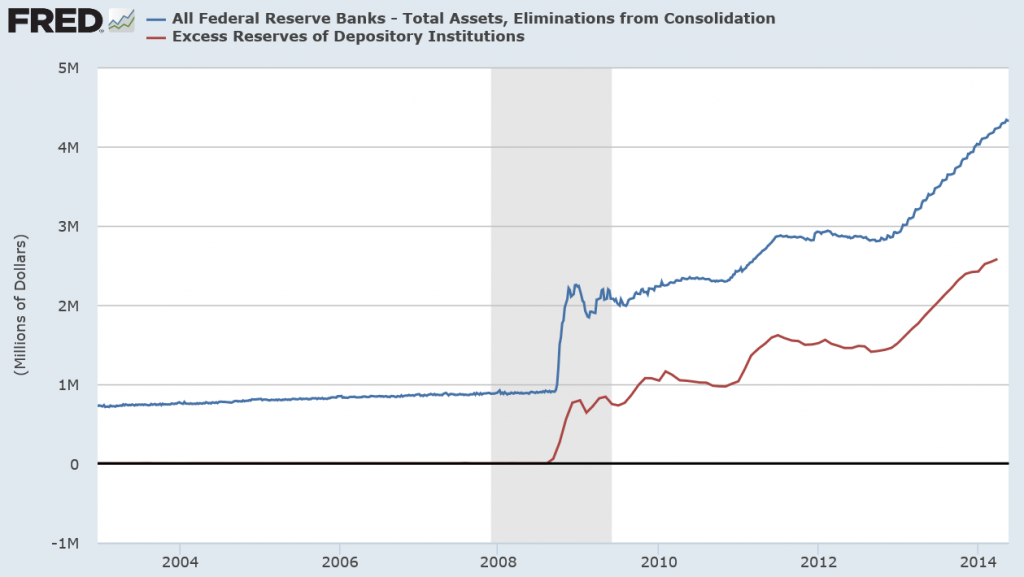
Fedassets

Seeking to encourage economic recovery, the US Federal Reserve dropped the federal funds rate to a number effectively almost zero – a historically low number. This zero bound federal funds rate has persisted since the end of 2009, or for about five years.

The Fed also has engaged in new policies, whereby it goes into private bond markets and buys long term bonds – primarily mortgage-backed securities. The second chart tracks this inasmuch as a good portion of the more than 4 trillion in Fed assets (for which there are corresponding liabilities, of course) are these mortgage-backed securities. In effect, the Fed has purchased a sizeable portion of the US housing market – one might say “nationalize” except that would be forgetting the fact that the Fed is actually a private institution whose governance is appointed by the Executive Branch of the US government.

In any case, this bond-buying is the famous “quantitative easing” (QE) and is mirrored in the accumulation of excess reserves by the banking system. Generally, that is, banks and financial institutions issue mortgages, sell them among themselves to be packaged in mortgage-backed securities, and the Fed has been buying these.

Banks can easily loan these excess reserves, but they consistently have not. Why is an interesting question beyond the scope of this discussion, but the consequence is that the Fed’s actions are “firewalled” from increasing the rate of inflation, which is what ordinarily you might think would occur given that various metrics of money supply also have surged upward.

Now “Fed-watching” is its own little cottage industry among financial commentators, and I am not going to second-guess the media here. The Fed has announced a plan to “taper” these purchases of long term bonds. This is likely to increase the mortgage rates and, probably to some extent, based on expectations already has.

So, the long and the short of it are that this set of policies – zero federal funds rate and bond buying cannot go on forever.

If economic growth has been low-grade since 2010 with these low interest rates, what is the reasonable outlook for a higher interest rate regime?

Timing of the Next Recession

When is the most likely time for a recession, for example? Would it be later in 2014, in 2015, or thereafter, maybe in 2016.

Here is a table of all the recessions in the US since the middle 1850’s along with facts about their duration (source: NBER).
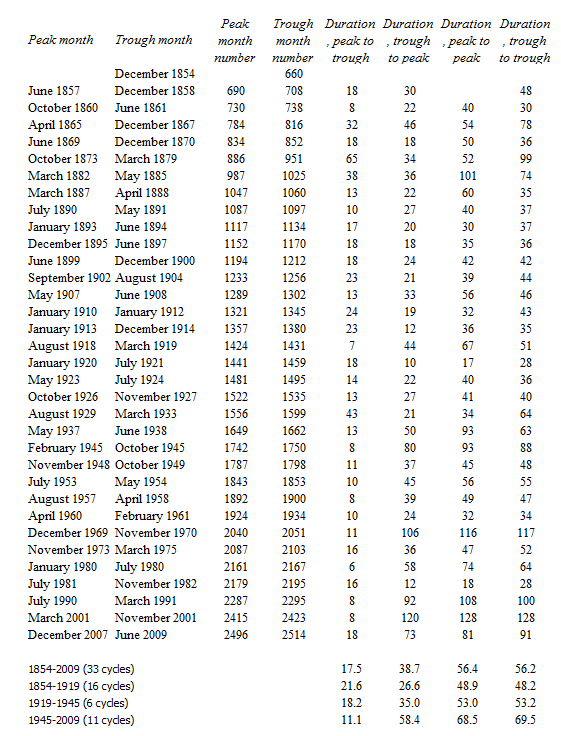
NBERRecess

Without even considering averages, the maximum period of trough to trough – that is, from the bottom of one recession to the bottom of the next – has been 128 months or ten years and eight months. Here, incidentally, the month numbers begin January 1800, for what that’s worth.

Thus, at the outside, based on these empirics, the trough of the next recession is likely to occur no later than early 2020.

Note that we have already blown through the average length from trough to trough of about 58.4 months or about five years from June 2009.

On a simple probabilistic basis, therefore, we are moving into the tail of the distribution of business cycle durations, suggesting that the chances of a downturn are in some sense already above 50 percent.

And note that the experience of the current business recovery is nothing like this historically maximum span in the 1990’s between the trough of the recession of 1990-1991 and the trough of November 2001.

This business recovery persistently seems to move ahead just above or, in the last quarter of 2013, below “stall speed.”

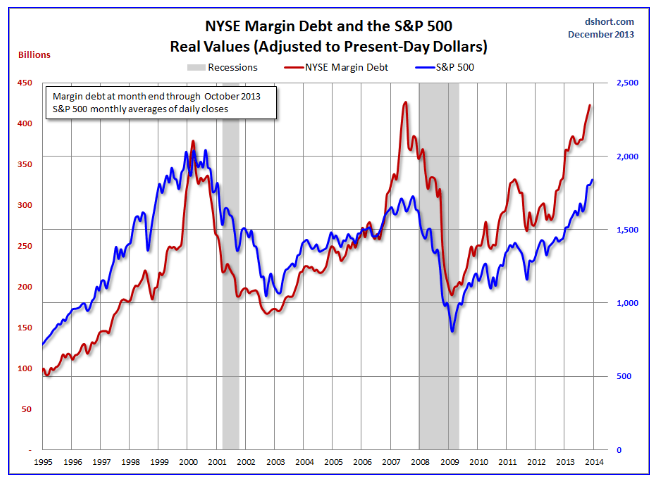
Seemingly, a fairly minor perturbation could set off a chain reaction, given the advanced frothiness in the stock market and softness in housing prices.

More of the Same, Worse

Neil Baroifsky was special inspector with oversight authority for the TARP during the bailout phase of the Great Recession, and currently is a partner in the Litigation Department of national law firm Jenner & Block LLP.

He’s also an author and often is called on for his opinion about developments in malfeasance writ large among the finance giants – such as the Credit Suisse settlement. In connection with a recent NPR interview, Barofsky said,

Although it is good that we averted a catastrophe back in 2008, the way that we did so I believe has unfortunately set the stage for an even more devastating financial crisis in the future.

HOBSON: In the future? How far?

BAROFSKY: Well, if I knew that, Michael Lewis would be writing his next book about people who made billions on timing the markets perfectly about me, which would be great.

(LAUGHTER)

BAROFSKY: But if you look, a lot of the same broken incentives from 2008 are still there. It’s just a question of when, not if. You can’t look at the fundamental broken incentives in the financial system and really come to a conclusion other than that we’re headed down the same dangerous path that we were that culminated in the explosion of ’08.

Barofsky’s point is readily supported by facts, such as –

The US and global financial system is even more concentrated today than in 2007, making “too big to fail”and even bigger potential problem now, than before the Great Recession. Even Alan Greenspan has taken note.

And the “pass the buck” system, whereby bond rating agencies are paid by the originators to evaluate exotic securities (“financial innovations”) created by the banking and shadow banking industries, securities which are then passed on to pension funds and hapless investors – this system appears to still be completely in place. Talk about the concept of “moral hazard.”

Global Impact

I think you get the picture.

For one reason or another, some fairly minor event is likely to set off a cascade of consequences in US and global financial markets, leading to the next recession. Probably, within one, two, or three years, as a matter of fact. Because the US Fed, and, for that matter, other central banks will still be working their way out of the last recession, there may be fewer “policy tools” to halt the stampede to sell, cutback, and so forth. Governments could respond with aggressive fiscal policy, but that option appears limited unless there are major changes in the political climate in the US and Europe.

Personally, I think wholly new directions of policy should be contemplated at the personal, local, regional, and of course at national levels.

We need to create what I have started to call “islands of stability.” This is the old idea of local self-reliance, but in new packaging. I really think there should be discussions widely across the US at least about how to decouple from the global economy and, indeed, from the financial concentrations on Wall Street. As a matter of self-preservation, until such time as more courageous national policies can be undertaken to reign in such obvious risks.

Daily Updates on Whether Key Financial Series Are Going Into Bubble Mode

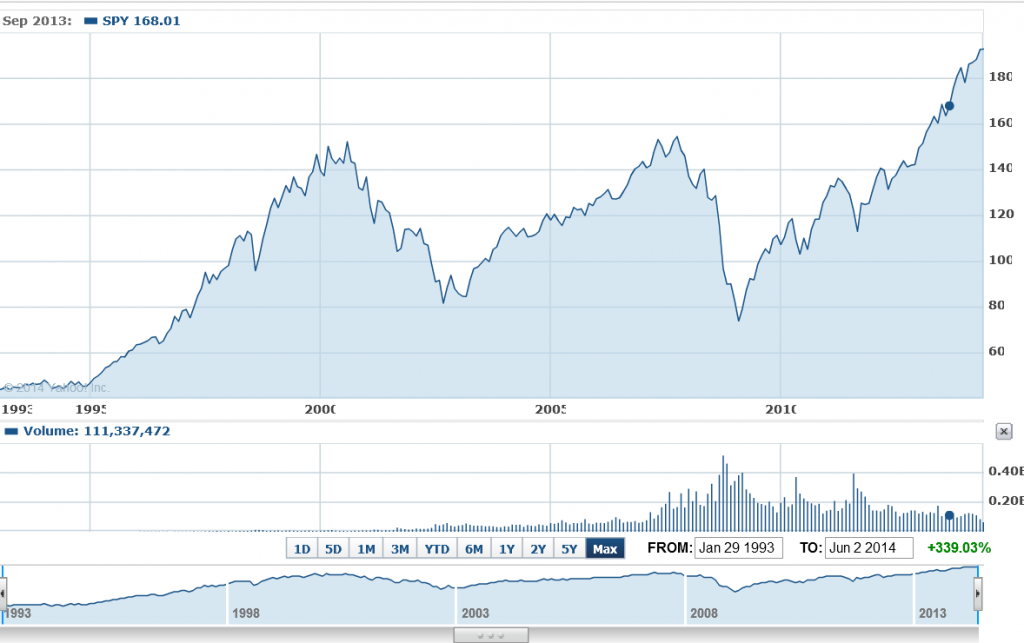
Financial and asset bubbles are controversial, amazingly enough, in standard economics, where a bubble is defined as a divergence in a market from fundamental value. The problem, of course, is what is fundamental value. Maybe investors in the dot.com frenzy of the late 1990’s believed all the hype about never-ending and accelerating growth in IT, as a result of the Internet.

So we have this chart for the ETF SPY which tracks the S&P500. Now, there are similarities between the upswing of the two previous peaks – which both led to busts – and the current surge in the index.

sp500yahoo

Where is this going to end?

Well, I’ve followed the research of Didier Sornette and his co-researchers, and, of course, Sornette’s group has an answer to this question, which is “probably not well.” Currently, Professor Sornette occupies the Chair of Entreprenuerial Risk at the Swiss Federal Institute of Technology in Zurich.

There is an excellent website maintained by ETH Zurich for the theory and empirical analysis of financial bubbles.

Sornette and his group view bubbles from a more mathematical perspective, finding similarities in bubbles of durations from months to years in the concept of “faster than exponential growth.” At some point, that is, asset prices embark on this type of trajectory. Because of various feedback mechanisms in financial markets, as well as just herding behavior, asset prices in bubble mode oscillate around an accelerating trajectory which – at some point that Sornette claims can be identified mathematically – becomes unsupportable. At such a moment, there is a critical point where the probability of a collapse or reversal of the process becomes significantly greater.

This group is on the path of developing a new science of asset bubbles, if you will.

And, by this logic, there are positive and negative bubbles.

The sharp drop in stock prices in 2008, for example, represents a negative stock market bubble movement, and also is governed or described, by this theory, by an underlying differential equation. This differential equation leads to critical points, where the probability of reversal of the downward price movement is significantly greater.

I have decided I am going to compute the full price equation suggested by Sornette and others to see what prediction for a critical point emerges for the S&P 500 or SPY.

But actually, this would be for my own satisfaction, since Sornette’s group already is doing this in the Financial Crisis Observatory.

I hope I am not violating Swiss copyright rules by showing the following image of the current Financial Crisis Observatory page (click to enlarge)

FCO

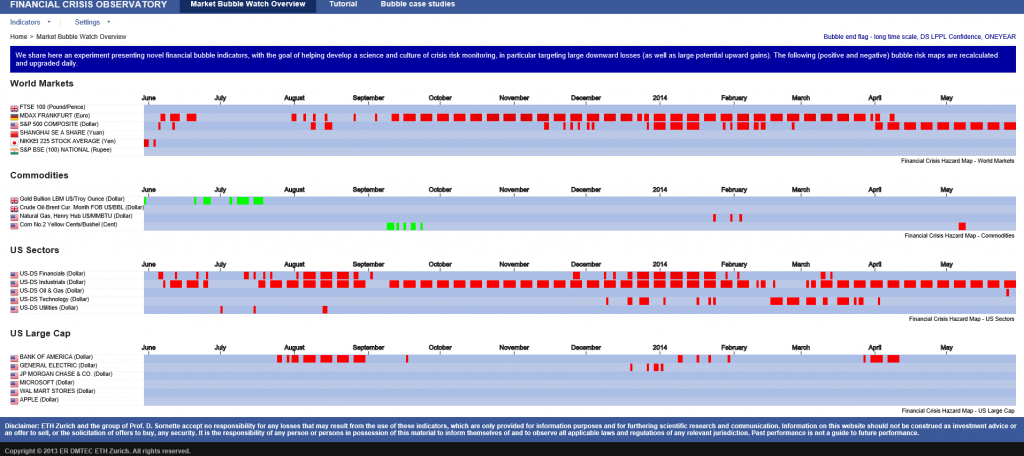
As you notice there are World Markets, Commodities, US Sectors, US Large Cap categories and little red and green boxes scattered across the page, by date.

The red boxes indicate computations by the ETH Zurich group that indicate the financial series in question is going into bubble mode. This is meant as a probabilistic evaluation and is accompanied by metrics which indicate the likelihood of a critical point. These computations are revised daily, according to the site.

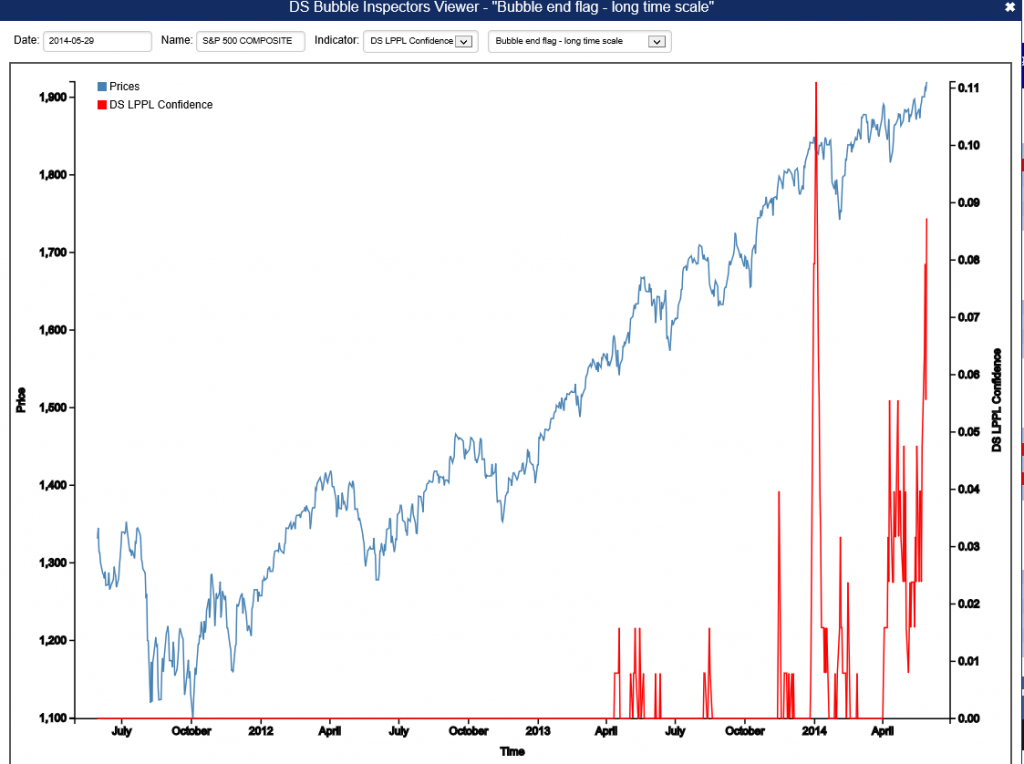
For example, there is a red box associated with the S&P 500 in late May. If you click on this red box, you  produces the following chart.

SornetteSP500

The implication is that the highest red spike in the chart at the end of December 2013 is associated with a reversal in the index, and also that one would be well-advised to watch for another similar spike coming up.

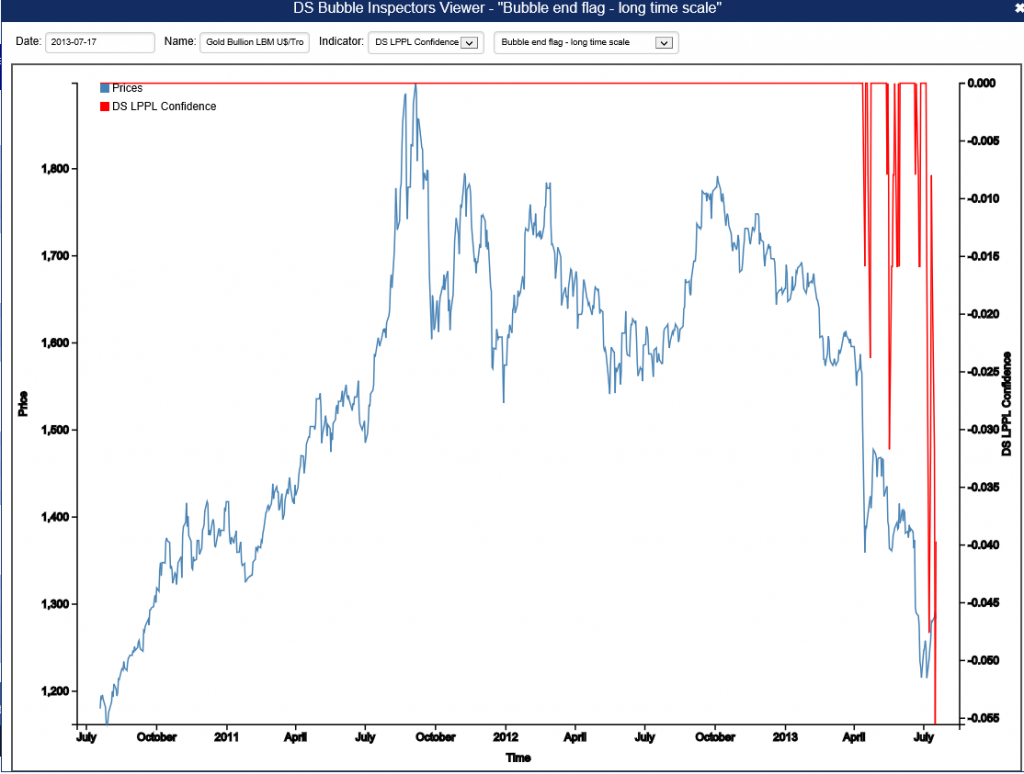
Negative bubbles, as I mention, also are in the lexicon. One of the green boxes for gold, for example, produces the following chart.

Goldnegbubble

This is fascinating stuff, and although Professor Sornette has gotten some media coverage over the years, even giving a TED talk recently, the economics profession generally seems to have given him almost no attention.

I plan a post on this approach with a worked example. It certainly is much more robust that some other officially sanctioned approaches.

Leading Indicators

One value the forecasting community can provide is to report on the predictive power of various leading indicators for key economic and business series.

The Conference Board Leading Indicators

The Conference Board, a private, nonprofit organization with business membership, develops and publishes leading indicator indexes (LEI) for major national economies. Their involvement began in 1995, when they took over maintaining Business Cycle Indicators (BCI) from the US Department of Commerce.

For the United States, the index of leading indicators is based on ten variables: average weekly hours, manufacturing,  average weekly initial claims for unemployment insurance, manufacturers’ new orders, consumer goods and materials, vendor performance, slower deliveries diffusion index,manufacturers’ new orders, nondefense capital goods, building permits, new private housing units, stock prices, 500 common stocks, money supply, interest rate spread, and an index of consumer expectations.

The Conference Board, of course, also maintains coincident and lagging indicators of the business cycle.

This list has been imprinted on the financial and business media mind, and is a convenient go-to, when a commentator wants to talk about what’s coming in the markets. And it used to be that a rule of thumb that three consecutive declines in the Index of Leading Indicators over three months signals a coming recession. This rule over-predicts, however, and obviously, given the track record of economists for the past several decades, these Conference Board leading indicators have questionable predictive power.

Serena Ng Research

What does work then?

Obviously, there is lots of research on this question, but, for my money, among the most comprehensive and coherent is that of Serena Ng, writing at times with various co-authors.

SerenaNg

So in this regard, I recommend two recent papers

Boosting Recessions

Facts and Challenges from the Great Recession for Forecasting and Macroeconomic Modeling

The first paper is most recent, and is a talk presented before the Canadian Economic Association (State of the Art Lecture).

Hallmarks of a Serena Ng paper are coherent and often quite readable explanations of what you might call the Big Picture, coupled with ambitious and useful computation – usually reporting metrics of predictive accuracy.

Professor Ng and her co-researchers apparently have determined several important facts about predicting recessions and turning points in the business cycle.

For example –

  1. Since World War II, and in particular, over the period from the 1970’s to the present, there have been different kinds of recessions. Following Ng and Wright, ..business cycles of the 1970s and early 80s are widely believed to be due to supply shocks and/or monetary policy. The three recessions since 1985, on the other hand, originate from the financial sector with the Great Recession of 2008-2009 being a full-blown balance sheet recession. A balance sheet recession involves, a sharp increase in leverage leaves the economy vulnerable to small shocks because, once asset prices begin to fall, financial institutions, firms, and households all attempt to deleverage. But with all agents trying to increase savings simultaneously, the economy loses demand, further lowering asset prices and frustrating the attempt to repair balance sheets. Financial institutions seek to deleverage, lowering the supply of credit. Households and firms seek to deleverage, lowering the demand for credit.
  2. Examining a monthly panel of 132 macroeconomic and financial time series for the period 1960-2011, Ng and her co-researchers find that .. the predictor set with systematic and important predictive power consists of only 10 or so variables. It is reassuring that most variables in the list are already known to be useful, though some less obvious variables are also identified. The main finding is that there is substantial time variation in the size and composition of the relevant predictor set, and even the predictive power of term and risky spreads are recession specific. The full sample estimates and rolling regressions give confidence to the 5yr spread, the Aaa and CP spreads (relative to the Fed funds rate) as the best predictors of recessions.

So, the yield curve, a old favorite when it comes to forecasting recessions or turning points in the business cycle, performs less well in the contemporary context – although other (limited) research suggests that indicators combining facts about the yield curve with other metrics might be helpful.

And this exercise shows that the predictor set for various business cycles changes over time, although there are a few predictors that stand out. Again,

there are fewer than ten important predictors and the identity of these variables change with the forecast horizon. There is a distinct difference in the size and composition of the relevant predictor set before and after mid-1980. Rolling window estimation reveals that the importance of the term and default spreads are recession specific. The Aaa spread is the most robust predictor of recessions three and six months ahead, while the risky bond and 5yr spreads are important for twelve months ahead predictions. Certain employment variables have predictive power for the two most recent recessions when the interest rate spreads were uninformative. Warning signals for the post 1990 recessions have been sporadic and easy to miss.

Let me throw in my two bits here, before going on in subsequent posts to consider turning points in stock markets and in more micro-focused or industry time series.

At the end of “Boosting Recessions” Professor Ng suggests that higher frequency data may be a promising area for research in this field.

My guess is that is true, and that, more and more, Big Data and data analytics from machine learning will be applied to larger and more diverse sets of macroeconomics and business data, at various frequencies.

This is tough stuff, because more information is available today than in, say, the 1970’s or 1980’s. But I think we know what type of recession is coming – it is some type of bursting of the various global bubbles in stock markets, real estate, and possibly sovereign debt. So maybe more recent data will be highly relevant.

“The Record of Failure to Predict Recessions is Virtually Unblemished”

That’s Prakash Loungani from work published in 2001.

Recently, Loungani , working with Hites Ahir, put together an update – “Fail Again, Fail Better, Forecasts by Economists During the Great Recession” reprised in a short piece in VOX – “There will be growth in the spring”: How well do economists predict turning points?

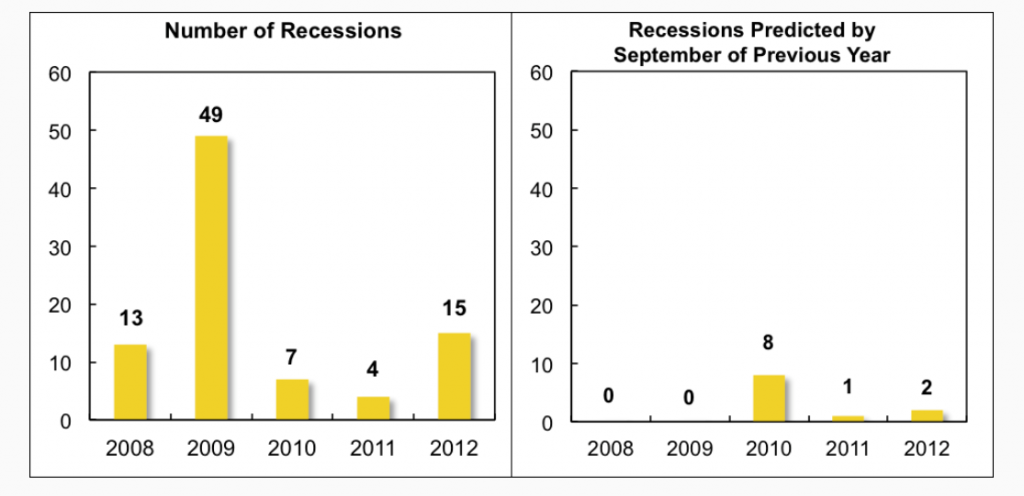
Hites and Loungani looked at the record of professional forecasters 2008-2012. Defining recessions as a year-over-year fall in real GDP, there were 88 recessions in this period. Based on country-by-country predictions documented by Consensus Forecasts, economic forecasters were right less than 10 percent of the time, when it came to forecasting recessions – even a few months before their onset.

recessions

The chart on the left shows the timing of the 88 recession years, while the chart on the right shows the number of recession predicted by economists by the September of the previous year.

..none of the 62 recessions in 2008–09 was predicted as the previous year was drawing to a close. However, once the full realisation of the magnitude and breadth of the Great Recession became known, forecasters did predict by September 2009 that eight countries would be in recession in 2010, which turned out to be the right call in three of these cases. But the recessions in 2011–12 again came largely as a surprise to forecasters.

This type of result holds up to robustness checks

•First, lowering the bar on how far in advance the recession is predicted does not appreciably improve the ability to forecast turning points.

•Second, using a more precise definition of recessions based on quarterly data does not change the results.

•Third, the failure to predict turning points is not particular to the Great Recession but holds for earlier periods as well.

Forecasting Turning Points

How can macroeconomic and business forecasters consistently get it so wrong?

Well, the data is pretty bad, although there is more and more of it available and with greater time depths and higher frequencies. Typically, government agencies doing the national income accounts – the Bureau of Economic Analysis (BEA) in the United States – release macroeconomic information at one or two months lag (or more). And these releases usually involve revision, so there may be preliminary and then revised numbers.

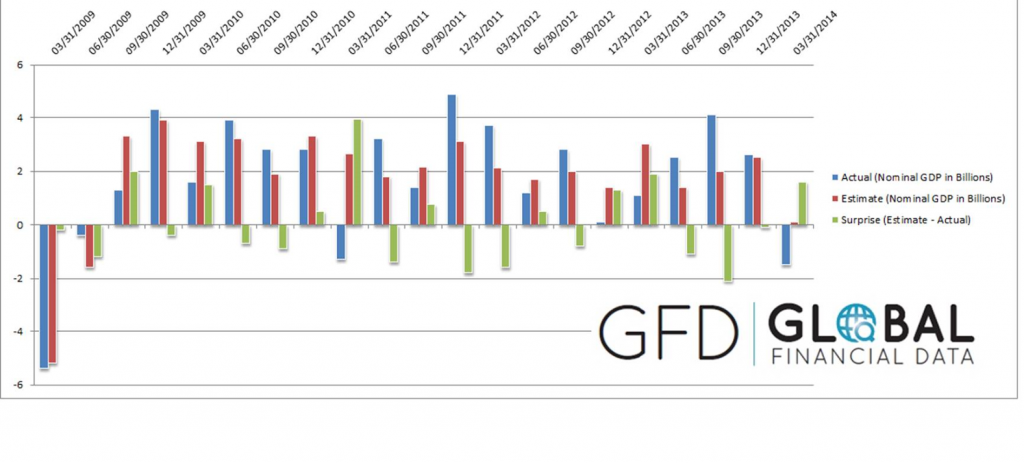
And the general accuracy of GDP forecasts is pretty low, as Ralph Dillon of Global Financial Data (GFD) documents in the following chart, writing,

Below is a chart that has 5 years of quarterly GDP consensus estimates and actual GDP [for the US]. In addition, I have also shown in real dollars the surprise in both directions. The estimate vs actual with the surprise indicating just how wrong consensus was in that quarter.

RalphDillon

Somehow, though, it is hard not to believe economists are doing something wrong with their almost total lack of success in predicting recessions. Perhaps there is a herding phenomenon, coupled with a distaste for being a bearer of bad tidings.

Or maybe economic theory itself plays a role. Indeed, earlier research published on Vox suggests that application of about 50 macroeconomic models to data preceding the recession of 2008-2009, leads to poor results in forecasting the downturn in those years, again even well into that period.

All this suggests economics is more or less at the point medicine was in the 1700’s, when bloodletting was all the rage..

quack_bleeding_sm

In any case, this is the planned topic for several forthcoming posts, hopefully this coming week – forecasting turning points.

Note: The picture at the top of this post is Peter Sellers in his last role as Chauncey Gardiner – the simple-minded gardener who by an accident and stroke of luck was taken as a savant, and who said to the President – “There will be growth in the spring.”

Predicting the Singularity, the Advent of Superintelligence

From thinking about robotics, automation, and artificial intelligence (AI) this week, I’m evolving a picture of the future – the next few years. I think you have to define a super-technological core, so to speak, and understand how the systems of production, communication, and control mesh and interpenetrate across the globe. And how this sets in motion multiple dynamics.

But then there is the “singularity” –  whose main publicizer is Ray Kurzweil, current Director of Engineering at Google. Here’s a particularly clear exposition of his view.

There’s a sort of rebuttal by Paul Root Wolpe.

Part of the controversy, as in many arguments, is a problem of definition. Kurzweil emphasizes a “singularity” of superintelligence of machines. For him, the singularity is at first the point at which the processes of the human brain will be well understood and thinking machines will be available that surpass human capabilities in every respect. Wolpe, on the other hand, emphasizes the “event horizon” connotation of the singularity – that point beyond which out technological powers will have become so immense that it is impossible to see beyond.

And Wolpe’s point about the human brain is probably well-taken. Think, for instance, of how decoding the human genome was supposed to unlock the secrets of genetic engineering, only to find that there were even more complex systems of proteins and so forth.

And the brain may be much more complicated than the current mechanical models suggest – a view espoused by Roger Penrose, English mathematical genius. Penrose advocates a  quantum theory of consciousness. His point, made first in his book The Emperor’s New Mind, is that machines will never overtake human consciousness, because, in fact, human consciousness is, at the limit, nonalgorithmic. Basically, Penrose has been working on the idea that the brain is a quantum computer in some respect.

I think there is no question, however, that superintelligence in the sense of fast computation, fast assimilation of vast amounts of data, as well as implementation of structures resembling emotion and judgment – all these, combined with the already highly developed physical capabilities of machines, mean that we are going to meet some mojo smart machines in the next ten to twenty years, tops.

The dysutopian consequences are enormous. Bill Joy, co-founder of Sun Microsystems, wrote famously about why the future does not need us. I think Joy’s singularity is a sort of devilish mirror image of Kurzweil’s – for Joy the singularity could be a time when nanotechnology, biotechnology, and robotics link together to make human life more or less impossible, or significantly at risk.

There’s is much more to say and think on this topic, to which I hope to return from time to time.

Meanwhile, I am reminded of Voltaire’s Candide who, at the end of pursuing the theories of Dr. Pangloss, concludes “we must cultivate our garden.”

Robotics – the Present, the Future

A picture is worth one thousand words. Here are several videos, mostly from Youtube, discussing robotics and artificial intelligence (AI) and showing present and future capabilities. The videos fall in five areas – concepts with Andrew Ng, Industrial Robots and their primary uses, Military Robotics, including a presentation on predator drones, and some state-of-the-art innovations in robotics which mimic the human approach to a degree.

Andrew Ng  – The Future of Robotics and Artificial Intelligence

Car Factory – Kia Sportage factory production line

ABB Robotics – 10 most popular applications for robots


Predator Drones


Innovators: The Future of Robotic Warfare


Bionic kangaroo


The Duel: Timo Boll vs. KUKA Robot


The “Hollowing Out” of Middle Class America

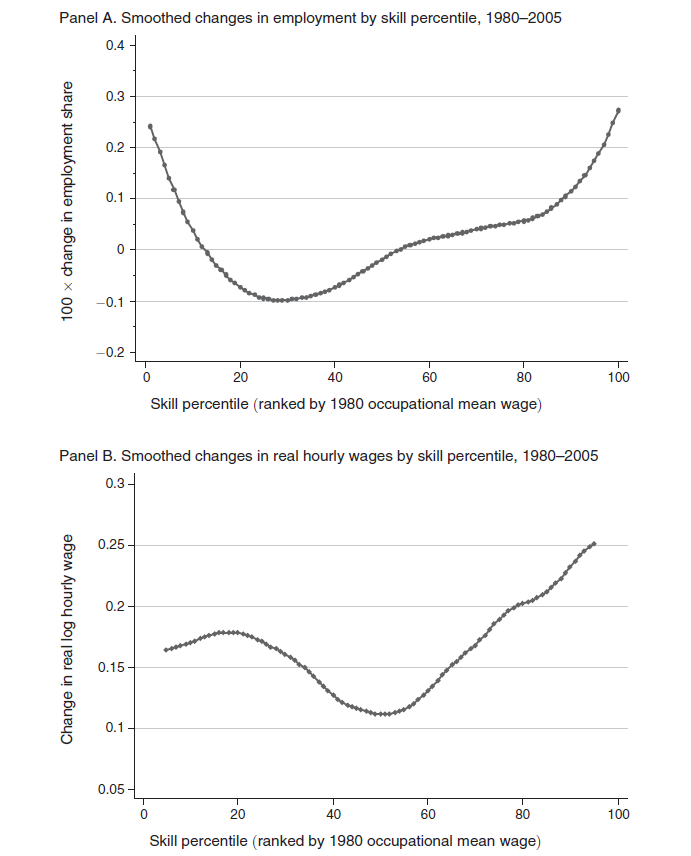
Two charts in a 2013 American Economic Review (AER) article put numbers to the “hollowing out” of middle class America – a topic celebrated with profuse anecdotes in the media.

Autor1

The top figure shows the change in employment 1980-2005 by skill level, based on Census IPUMS and American Community Survey (ACS) data. Occupations are ranked by skill level, approximated by wages in each occupation in 1980.

The lower figure documents the changes in wages of these skill levels 1980-2005.

These charts are from David Autor and David Dorn – The Growth of Low-Skill Service Jobs and the Polarization of the US Labor Market – who write that,

Consistent with the conventional view of skill-biased technological change, employment growth is differentially rapid in occupations in the upper two skill quartiles. More surprising in light of the canonical model are the employment shifts seen below the median skill level. While occupations in the second skill quartile fell as a share of employment, those in the lowest skill quartile expanded sharply. In net, employment changes in the United States during this period were strongly U-shaped in skill level, with relative employment declines in the middle of the distribution and relative gains at the tails. Notably, this pattern of employment polarization is not unique to the United States. Although not recognized until recently, a similar “polarization” of employment by skill level has been underway in numerous industrialized economies in the last 20 to 30 years.

So, employment and wage growth has been fastest in the past three or so decades (extrapolating to the present) in low skill and high skill occupations.

Among lower skill occupations, such as food service workers, security guards, janitors and gardeners, cleaners, home health aides, child care workers, hairdressers and beauticians, and recreational workers, employment grew 30 percent 1980-2005.

Among the highest paid occupations – classified as managers, professionals, technicians, and workers in finance, and public safety – the share of employment also grew by about 30 percent, but so did wages – which increased at about double the pace of the lower skill occupations over this period.

Professor Autor is in the MIT economics department, and seems to be the nexus of a lot of interesting research casting light on changes in US labor markets.

DavidAutor

In addition to “doing Big Data” as the above charts suggest, David Autor is closely associated with a new, common sense model of production activities, based on tasks and skills.

This model of the production process, enables Autor and his coresearchers to conclude that,

…recent technological developments have enabled information and communication technologies to either directly perform or permit the offshoring of a subset of the core job tasks previously performed by middle skill workers, thus causing a substantial change in the returns to certain types of skills and a measurable shift in the assignment of skills to tasks.

So it’s either a computer (robot) or a Chinaman who gets the middle-class bloke’s job these days.

And to drive that point home – (and, please, I consider the achievements of the PRC in lifting hundreds of millions out of extreme poverty to be of truly historic dimension) Autor with David Dorn and Gordon Hansen publihsed another 2013 article in the AER titled The China Syndrome: Local Labor Market Effects of Import Competition in the United States.

This study analyzes local labor markets and trade shocks to these markets, according to initial patterns of industry specialization.

The findings are truly staggering – or at least have been equivocated or obfuscated for years by special pleaders and lobbyists.

Dorn et al write,

The value of annual US goods imports from China increased by a staggering 1,156 percent from 1991 to 2007, whereas US exports to China grew by much less…. 

Our analysis finds that exposure to Chinese import competition affects local labor markets not just through manufacturing employment, which unsurprisingly is adversely affected, but also along numerous other margins. Import shocks trigger a decline in wages that is primarily observed outside of the manufacturing sector. Reductions in both employment and wage levels lead to a steep drop in the average earnings of households. These changes contribute to rising transfer payments through multiple federal and state programs, revealing an important margin of adjustment to trade that the literature has largely overlooked,

This research – conducted in terms of ordinary least squares (OLS), two stage least squares (2SLS) as well as “instrumental” regressions – is definitely not something a former trade unionist is going to ponder in the easy chair after work at the convenience store. So it’s kind of safe in terms of arousing the ire of the masses.

But I digress.

For my purposes here, Autor and his co-researchers put pieces of the puzzle in place so we can see the picture.

The US occupational environment has changed profoundly since the 1980’s. Middle class jobs have simply vanished over large parts of the landscape. More specifically, good-paying production jobs, along with a lot of other more highly paid, but routinized work, has been the target of outsourcing, often to China it seems it can be demonstrated. Higher paid work by professionals in business and finance benefits from complementarities with the advances in data processing and information technology (IT) generally. In addition, there are a small number of highly paid production workers whose job skills have been updated to run more automated assembly operations which seem to be the chief beneficiaries of new investment in production in the US these days.

There you have it.

Market away, and include these facts in any forecasts you develop for the US market.

Of course, there are issues of dynamics.

Automation, Robotics -Trends and Impacts

Trying to figure out the employment impacts of automation, computerization, and robotics is challenging, to say the least.

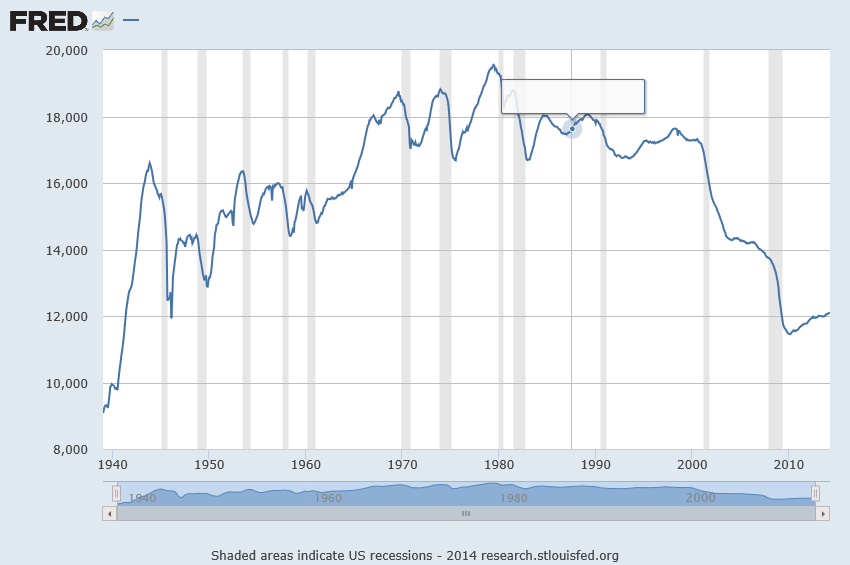
There are clear facts, such as the apparent permanent loss of jobs in US manufacturing since the early 1990’s.

MANEMP

But it would be short-sighted to conclude these jobs have been lost to increased use of computers and robots in production.

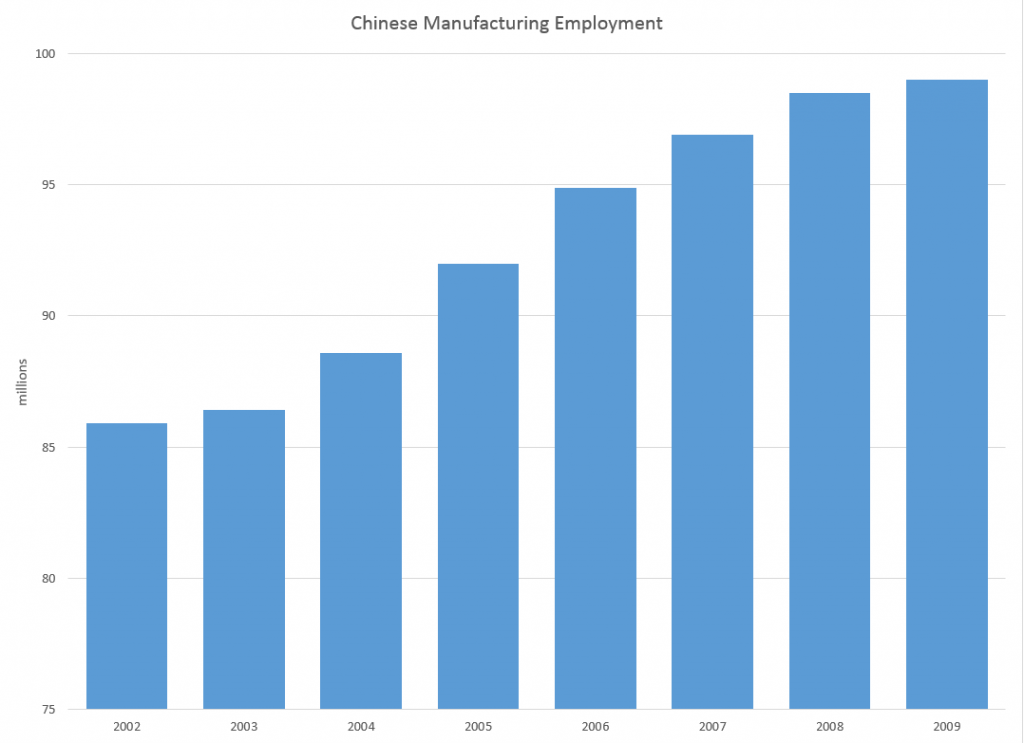
That’s because, for one thing, you might compare a chart like the above with statistics on Chinese manufacturing.

Chinesemanemp

Now you can make a case – if you focus on the urban Chinese manufacturing employment – that these two charts are more or less mirror images of one another in recent years. That is urban manufacturing employment in China, according the US BLS, increased about 4 mllion 2002-2009, while US manufacturing employment dropped by about that amount over the same period.

Of course, there are other off-shore manufacturing sites of importance, such as the maquiladoras along the US border with Mexico.

But what brings robotics into focus for me is that significant automation and robotics are being installed in factories in China.

Terry Guo, head of Foxconn – the huge Chinese contract manufacturer making the I-phone and many other leading electronics products – has called for installation of a million industrial robots in Foxconn factories over the next few years.

In fact, Foxconn apparently is quietly partnering with Google to help bring its vision of robotics to life.

Decoupling of Productivity and Employment?

Erik Brynjolfsson at MIT is an expert on the productivity implications of information technology (IT).

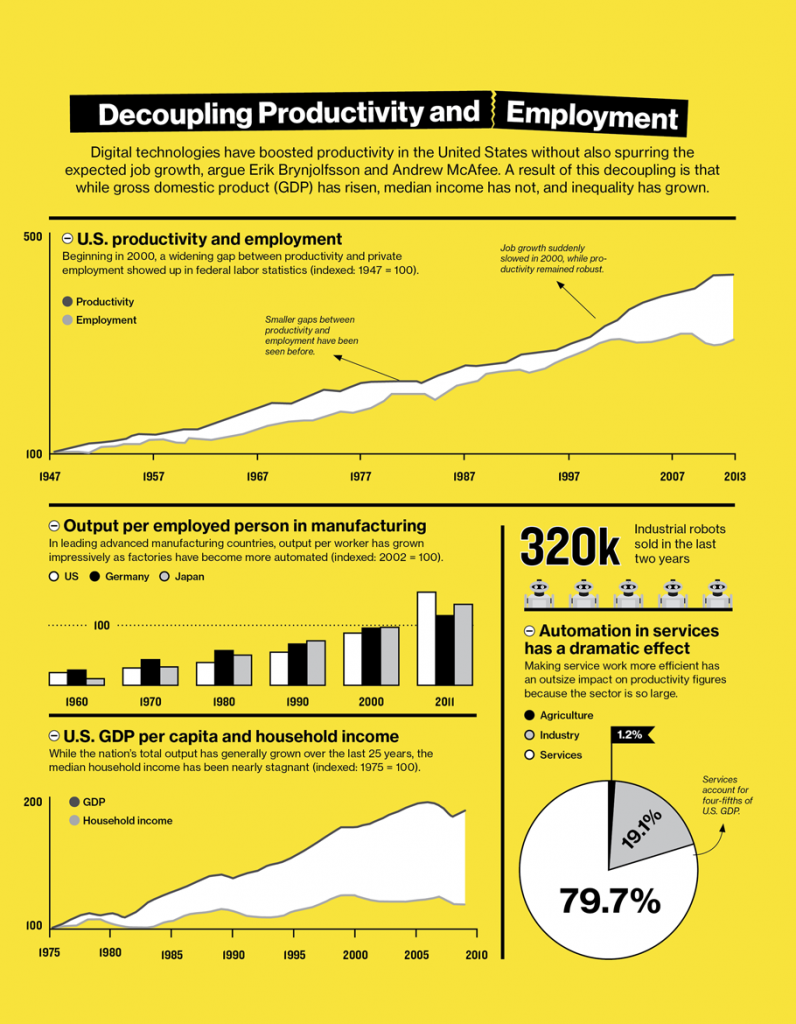
About a year ago, the MIT Technology Review ran an article How Technology Is Destroying Jobs featuring the perspective developed recently by Brynjolfsson that there is increasingly a disconnect between productivity growth and jobs in the US.

The article featured two infographics – one of which I reproduce here.

info

There have been highly focused studies of the effects of computerization on specific industries.

Research published just before the recent economic crisis did an in-depth regarding automation or computerization in a “valve industry,” arriving at three, focused findings.

First, plants that adopt new IT-enhanced equipment also shift their business strategies by producing more customized valve products. Second, new IT investments improve the efficiency of all stages of the production process by reducing setup times, run times, and inspection times. The reductions in setup times are theoretically important because they make it less costly to switch production from one product to another and support the change in business strategy to more customized production. Third, adoption of new IT-enhanced capital equipment coincides with increases in the skill requirements of machine operators, notably technical and problem-solving skills, and with the adoption of new human resource practices to support these skills

This is the positive side of the picture.

No more drudgery on assembly lines with highly repetitive tasks. Factory workers are being upgraded to computer operatives.

More to follow.

Jobs and the Next Wave of Computerization

A duo of researchers from Oxford University (Frey and Osborne) made a splash with their analysis of employment and computerization in the US (English spelling). Their research, released September of last year, projects that –

47 percent of total US employment is in the high risk category, meaning that associated occupations are potentially automatable over some unspecified number of years, perhaps a decade or two..

Based on US Bureau of Labor Statistics (BLS) classifications from O*NET Online, their model predicts that most workers in transportation and logistics occupations, together with the bulk of office and administrative support workers, and labour in production occupations, are at risk.

This research deserves attention, if for no other reason than masterful discussions of the impact of technology on employment and many specific examples of new areas for computerization and automation.

For example, I did not know,

Oncologists at Memorial Sloan-Kettering Cancer Center are, for example, using IBM’s Watson computer to provide chronic care and cancer treatment diagnostics. Knowledge from 600,000 medical evidence reports, 1.5 million patient records and clinical trials, and two million pages of text from medical journals, are used for benchmarking and pattern recognition purposes. This allows the computer to compare each patient’s individual symptoms, genetics, family and medication history, etc., to diagnose and develop a treatment plan with the highest probability of success..

There are also specifics of computerized condition monitoring and novelty detection -substituting for closed-circuit TV operators, workers examining equipment defects, and clinical staff in intensive care units.

A followup Atlantic Monthly article – What Jobs Will the Robots Take? – writes,

We might be on the edge of a breakthrough moment in robotics and artificial intelligence. Although the past 30 years have hollowed out the middle, high- and low-skill jobs have actually increased, as if protected from the invading armies of robots by their own moats. Higher-skill workers have been protected by a kind of social-intelligence moat. Computers are historically good at executing routines, but they’re bad at finding patterns, communicating with people, and making decisions, which is what managers are paid to do. This is why some people think managers are, for the moment, one of the largest categories immune to the rushing wave of AI.

Meanwhile, lower-skill workers have been protected by the Moravec moat. Hans Moravec was a futurist who pointed out that machine technology mimicked a savant infant: Machines could do long math equations instantly and beat anybody in chess, but they can’t answer a simple question or walk up a flight of stairs. As a result, menial work done by people without much education (like home health care workers, or fast-food attendants) have been spared, too.

What Frey and Osborne at Oxford suggest is an inflection point, where machine learning (ML) and what they call mobile robotics (MR) have advanced to the point where new areas for applications will open up – including a lot of menial, service tasks that were not sufficiently routinized for the first wave.

In addition, artificial intelligence (AI) and Big Data algorithms are prying open up areas formerly dominated by intellectual workers.

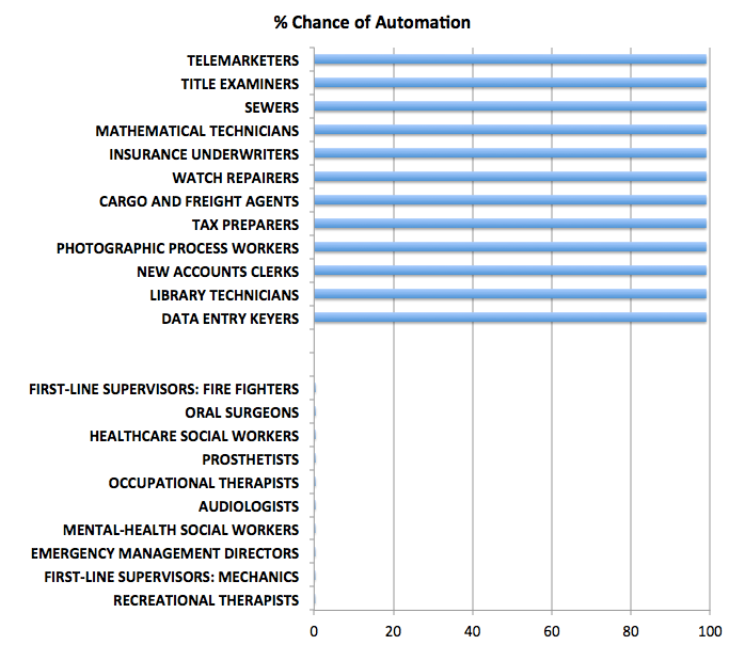
The Atlantic Monthly article cited above has an interesting graphic –

jobsautomationSo at the top of this chart are the jobs which are at 100 percent risk of being automated, while at the bottom are jobs which probably will never be automated (although I do think counseling can be done to a certain degree by AI applications).

The Final Frontier

This blog focuses on many of the relevant techniques in machine learning – basically unsupervised learning of patterns – which in the future will change everything.

Driverless cars are the wow example, of course.

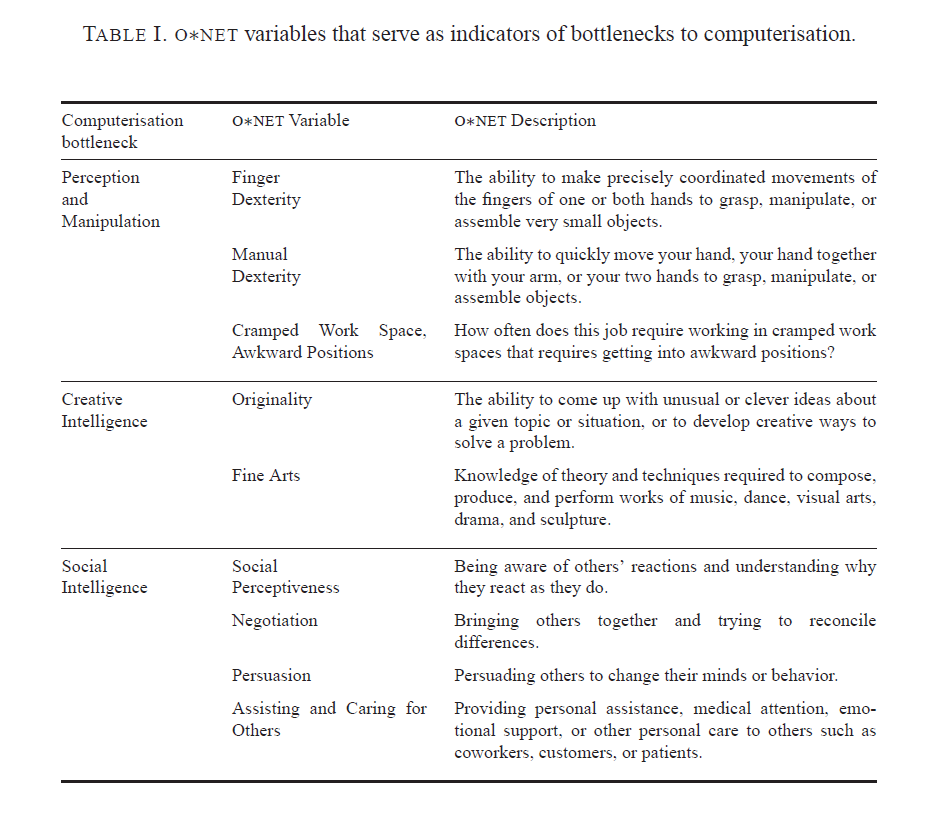
Bottlenecks to moving further up the curve of computerization are highlighted in the following table from the Oxford U report.

ONETvars

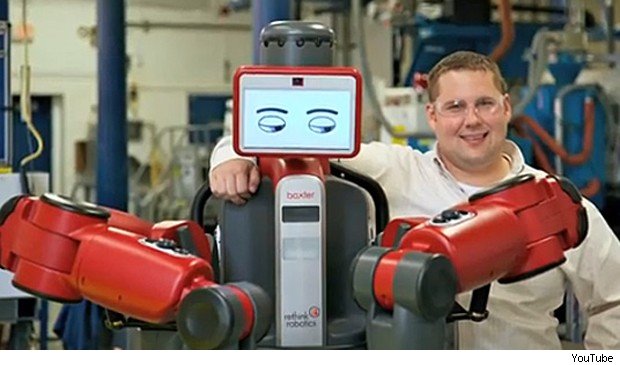
As far as dexterity and flexibility goes, Baxter shows great promise, as the following YouTube from his innovators illustrates.

There also are some wonderful examples of apparent creativity by computers or automatic systems, which I plan to detail in a future post.

Frey and Osborn, reflecting on their research in a 2014 discussion, conclude

So, if a computer can drive better than you, respond to requests as well as you and track down information better than you, what tasks will be left for labour? Our research suggests that human social intelligence and creativity are the domains were labour will still have a comparative advantage. Not least, because these are domains where computers complement our abilities rather than substitute for them. This is because creativity and social intelligence is embedded in human values, meaning that computers would not only have to become better, but also increasingly human, to substitute for labour performing such work.

Our findings thus imply that as technology races ahead, low-skill workers will need to reallocate to tasks that are non-susceptible to computerisation – i.e., tasks requiring creative and social intelligence. For workers to win the race, however, they will have to acquire creative and social skills. Development strategies thus ought to leverage the complementarity between computer capital and creativity by helping workers transition into new work, involving working with computers and creative and social ways.

Specifically, we recommend investing in transferable computer-related skills that are not particular to specific businesses or industries. Examples of such skills are computer programming and statistical modeling. These skills are used in a wide range of industries and occupations, spanning from the financial sector, to business services and ICT.

Implications For Business Forecasting

People specializing in forecasting for enterprise level business have some responsibility to “get ahead of the curve” – conceptually, at least.

Not everybody feels comfortable doing this, I realize.

However, I’m coming to the realization that these discussions of how many jobs are susceptible to “automation” or whatever you want to call it (not to mention jobs at risk for “offshoring”) – these discussions are really kind of the canary in the coal mine.

Something is definitely going on here.

But what are the metrics? Can you backdate the analysis Frey and Osborne offer, for example, to account for the coupling of productivity growth and slower employment gains since the last recession?

Getting a handle on this dynamic in the US, Europe, and even China has huge implications for marketing, and, indeed, social control.

Sales and new product forecasting in data-limited (real world) contexts