Forecasting Google’s Stock Price (GOOG) On 20-Trading-Day Horizons

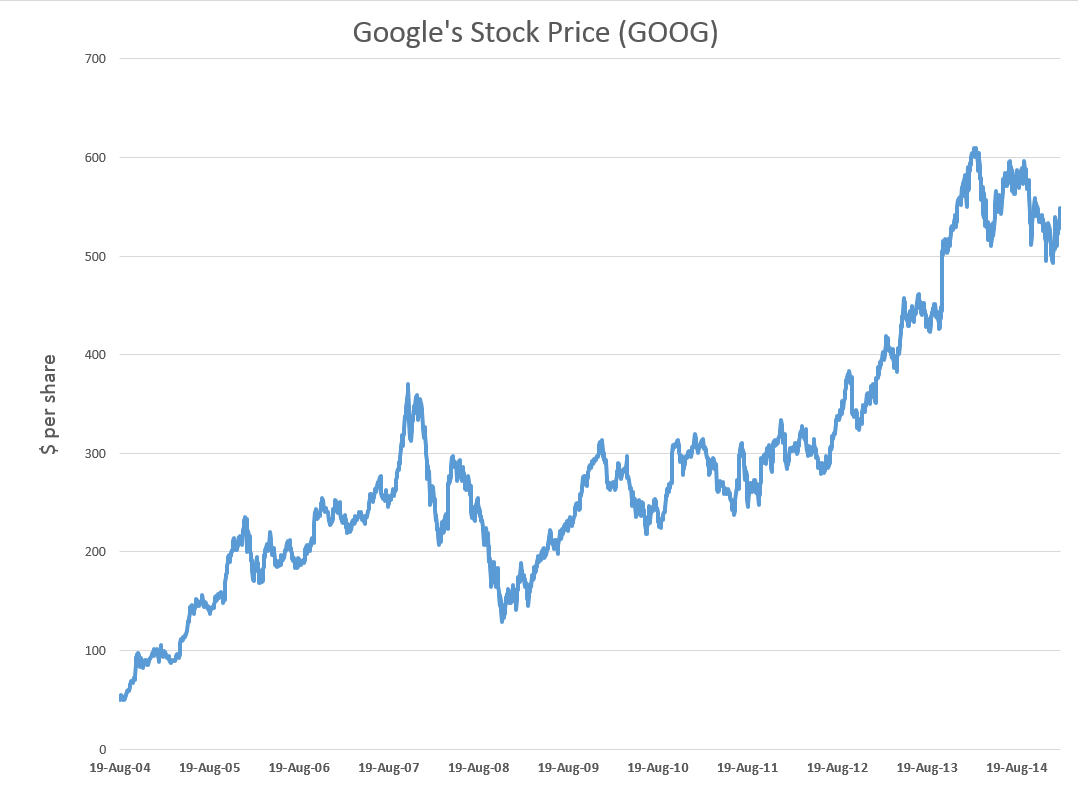
Google’s stock price (GOOG) is relatively volatile, as the following chart shows.

GOOG

So it’s interesting that a stock market forecasting algorithm can produce the following 20 Trading-Day-Ahead forecasts for GOOG, for the recent period.

GOG20

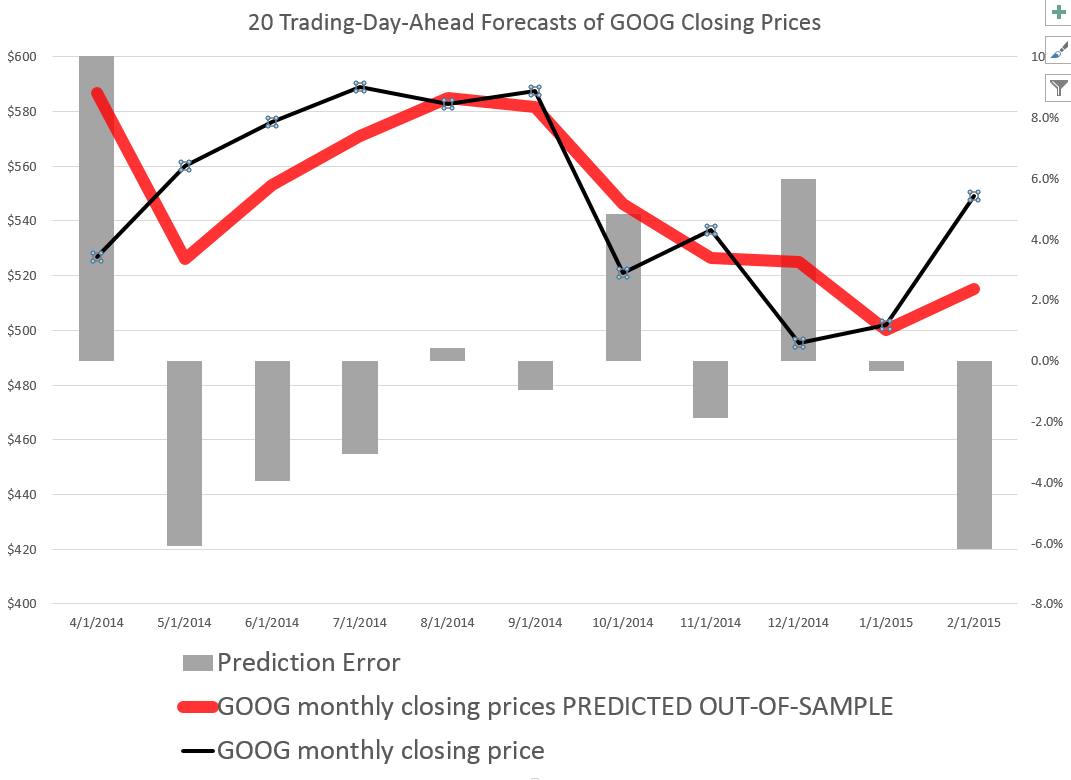
The forecasts in the above chart, as are those mentioned subsequently, are out-of-sample predictions. That is, the parameters of the forecast model – which I call the PVar model – are estimated over one set of historic prices. Then, the forecasts from PVar are generated with values for the explanatory variables that are “outside” or not the same as this historic data.

How good are these forecasts and how are they developed?

Well, generally forecasting algorithms are compared with benchmarks, such as an autoregressive model or a “no-change” forecast.

So I constructed an autoregressive (AR) model for the Google closing prices, sampled at 20 day frequencies. This model has ten lagged versions of the closing price series, so I do not just rely here on first order autocorrelations.

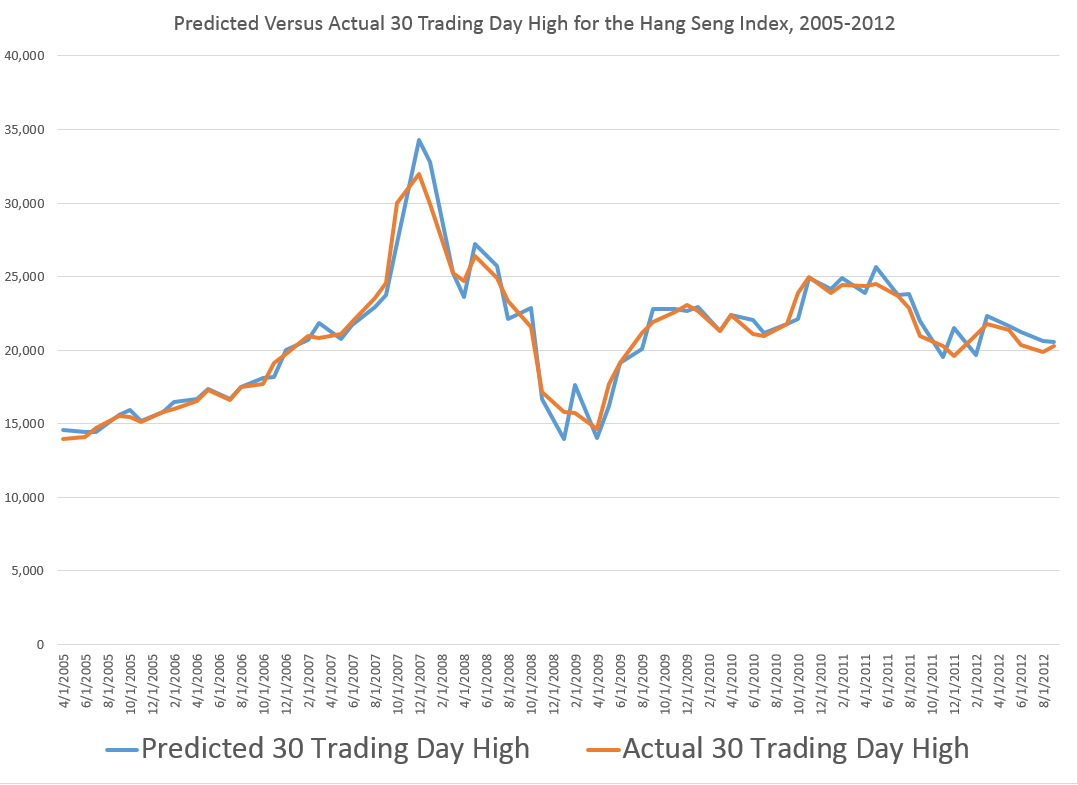
Here is a comparison of the 20 trading-day-ahead predictions of this AR model, the above “proximity variable” (PVar) model which I take credit for, and the actual closing prices.

compGOOG

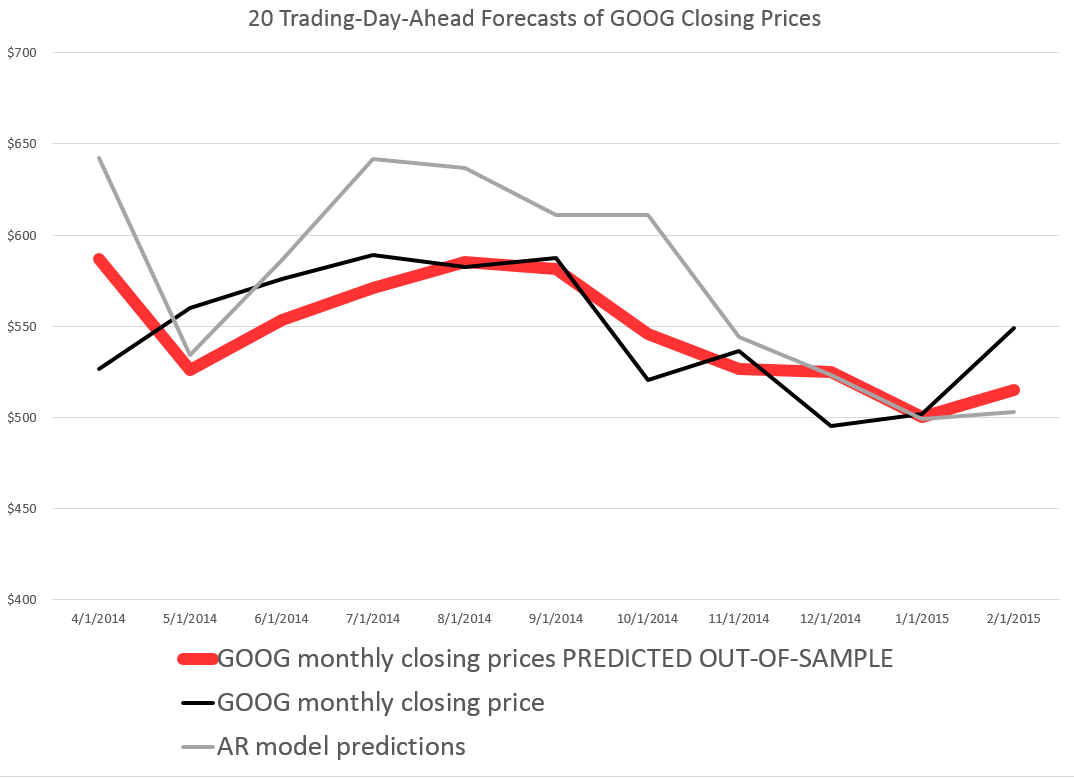
As you can see, the AR model is worse in comparison to the PVar model, although they share some values at the end of the forecast series.

The mean absolute percent errors (MAPE) of the AR model for a period more extended than shown in the graph is 7.0, compared with 5.1 for PVar. This comparison is calculated over data from 4/20/2011.

So how do I do it?

Well, since these models show so much promise, it makes sense to keep working on them, making improvements. However, previous posts here give broad hints, indeed pretty well laying out the framework, at least on an introductory basis.

Essentially, I move from predicting highs and lows to predicting closing prices.

To predict highs and lows, my post “further research” states

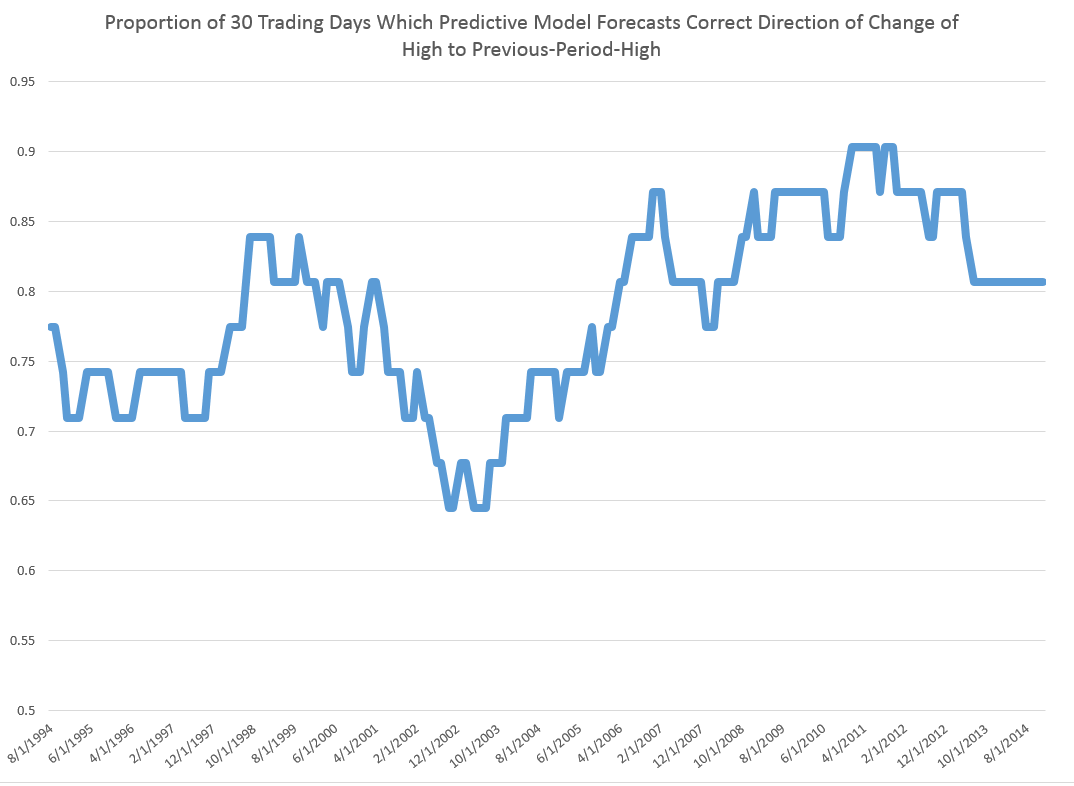
Now, the predictive models for the daily high and low stock price are formulated, as before, keying off the opening price in each trading day. One of the key relationships is the proximity of the daily opening price to the previous period high. The other key relationship is the proximity of the daily opening price to the previous period low. Ordinary least squares (OLS) regression models can be developed which do a good job of predicting the direction of change of the daily high and low, based on knowledge of the opening price for the day.

Other posts present actual regression models, although these are definitely prototypes, based on what I know now.

Why Does This Work?

I’ll bet this works because investors often follow simple rules such as “buy when the opening price is sufficiently greater than the previous period high” or “sell, if the opening price is sufficiently lower than the previous period low.”

I have assembled evidence, based on time variation in the predictive coefficients of the PVar variables, which I probably will put out here sometime.

But the point is that momentum trading is a major part of stock market activity, not only in the United States, but globally. There’s even research claiming to show that momentum traders do better than others, although that’s controversial.

This means that the daily price record for a stock, the opening, high, low, and closing prices, encode information that investors are likely to draw upon over different investing horizons.

I’m pleased these insights open up many researchable questions. I predict all this will lead to wholly new generations of models in stock market analysis. And my guess, and so far it is largely just that, is that these models may prove more durable than many insights into patterns of stock market prices – due to a sort of self-confirming aspect.

Modeling High Tech – the Demand for Communications Services

A colleague was kind enough to provide me with a copy of –

Demand for Communications Services – Insights and Perspectives, Essays in Honor of Lester D. Taylor, Alleman, NíShúilleabháin, and Rappoport, editors, Springer 2014

Some essays in this Festschrift for Lester Taylor are particularly relevant, since they deal directly with forecasting the disarray caused by disruptive technologies in IT markets and companies.

Thus, Mohsen Hamoudia in “Forecasting the Demand for Business Communications Services” observes about the telecom space that

“..convergence of IT and telecommunications market has created more complex behavior of market participants. Customers expect new product offerings to coincide with these emerging needs fostered by their growth and globalization. Enterprises require more integrated solutions for security, mobility, hosting, new added-value services, outsourcing and voice over internet protocol (VoiP). This changing landscape has led to the decline of traditional product markets for telecommunications operators.

In this shifting landscape, it is nothing less than heroic to discriminate “demand variables” and “ independent variables” deploying and produce useful demand forecasts from three stage least squares (3SLS) models, as does Mohsen Hamoudia in his analysis of BCS.

Here is Hamoudia’s schematic of supply and demand in the BCS space, as of a 2012 update.

BCS

Other cutting-edge contributions, dealing with shifting priorities of consumers, faced with new communications technologies and services, include, “Forecasting Video Cord-Cutting: The Bypass of Traditional Pay Television” and “Residential Demand for Wireless Telephony.”

Festschrift and Elasticities

This Springer Festschrift is distinctive inasmuch as Professor Taylor himself contributes papers – one a reminiscence titled “Fifty Years of Studying Economics.”

Taylor, of course, is known for his work in the statistical analysis of empirical demand functions and broke ground with two books, Telecommunications Demand: A Survey and Critique (1980) and Telecommunications Demand in Theory and Practice (1994).

Accordingly, forecasting and analysis of communications and high tech are a major focus of several essays in the book.

Elasticities are an important focus of statistical demand analysis. They flow nicely from double logarithmic or log-log demand specifications – since, then, elasticities are constant. In a simple linear demand specification, of course, the price elasticity varies across the range of prices and demand, which complicates testimony before public commissions, to say the least.

So it is interesting, in this regard, that Professor Taylor is still active in modeling, contributing to his own Festschrift with a note on translating logs of negative numbers to polar coordinates and the complex plane.

“Pricing and Maximizing Profits Within Corporations” captures the flavor of a telecom regulatory era which is fast receding behind us. The authors, Levy and Tardiff, write that,

During the time in which he was finishing the update, Professor Taylor participated in one of the most hotly debated telecommunications demand elasticity issues of the early 1990’s: how price-sensitive were short-distance toll calls (then called intraLATA long-distance calls)? The answer to that question would determine the extent to which the California state regulator reduced long-distance prices (and increased other prices, such as basic local service prices) in a “revenue-neutral” fashion.

Followup Workshop

Research in this volume provides a good lead-up to a forthcoming International Institute of Forecasters (IIF) workshop – the 2nd ICT and Innovation Forecasting Workshop to be held this coming May in Paris.

The dynamic, ever changing nature of the Information & Communications Technology (ICT) Industry is a challenge for business planners and forecasters. The rise of Twitter and the sudden demise of Blackberry are dramatic examples of the uncertainties of the industry; these events clearly demonstrate how radically the environment can change. Similarly, predicting demand, market penetration, new markets, and the impact of new innovations in the ICT sector offer a challenge to businesses and policymakers. This Workshop will focus on forecasting new services and innovation in this sector as well as the theory and practice of forecasting in the sector (Telcos, IT providers, OTTs, manufacturers). For more information on venue, organizers and registration, Download brochure

Top Forecasters of the US Economy, 2013-2014

Once again, Christophe Barraud, a French economist based in Paris, is ranked as the “best forecaster of the US economy” by Bloomberg (see here).

This is quite an accomplishment, considering that it is based on forecasts for 14 key monthly indicators including CPI, Durable Goods Orders, Existing Home Sales, Housing Starts, IP, ISM Manufacturing, ISM Nonmanufacturing, New Home Sales, Nonfarm Payrolls, Personal Income, Personal Spending, Retail Sales, Unemployment and GDP.

For this round, Bloomberg considered two years of data ending ended November 2014.

Barraud was #1 in the rankings for 2011-2012 also.

In case you wanted to take the measure of such talent, here is a recent interview with Barraud conducted by Figaro (in French).

The #2 slot in the Bloomberg rankings of best forecasters of the US economy went to Jim O’Sullivan of High Frequency Economics.

Here just an excerpt from an interview by subscription with O’Sullivan – again to take the measure of the man.

While I have been absorbed in analyzing a statistical/econometric problem, a lot has transpired – in Switzerland, in Greece and the Ukraine, and in various global regions. While I am optimistic in outlook presently, I suspect 2015 may prove to be a year of surprises.

On Self-Fulfilling Prophecy

In their excellent “Forecasting Stock Returns” in the Handbook of Economic Forecasting, David Rapach and Guofu Zhou write,

While stock return forecasting is fascinating, it can also be frustrating. Stock returns inherently contain a sizable unpredictable component, so that the best forecasting models can explain only a relatively small part of stock returns. Furthermore, competition among traders implies that once successful forecasting models are discovered, they will be readily adopted by others; the widespread adoption of successful forecasting models can then cause stock prices to move in a manner that eliminates the models’ forecasting ability..

Almost an article of faith currently, this perspective seems to rule out other reactions to forecasts which have been important in economic affairs, namely the self-fulfilling prophecy.

Now as “self-fulfilling prophecy” entered the lexicon, it was a prediction which originally was in error, but it became true, because people believed it was true and acted upon it.

Bank runs are the classic example.

The late Robert Merton wrote of the Last National Bank in his classic Social Theory and Social Structure, but there is no need for recourse to apocryphal history. Gary Richardson of the Federal Reserve Bank of Richmond has a nice writeup – Banking Panics of 1930 and 1931

..Caldwell was a rapidly expanding conglomerate and the largest financial holding company in the South. It provided its clients with an array of services – banking, brokerage, insurance – through an expanding chain controlled by its parent corporation headquartered in Nashville, Tennessee. The parent got into trouble when its leaders invested too heavily in securities markets and lost substantial sums when stock prices declined. In order to cover their own losses, the leaders drained cash from the corporations that they controlled.

On November 7, one of Caldwell’s principal subsidiaries, the Bank of Tennessee (Nashville) closed its doors. On November 12 and 17, Caldwell affiliates in Knoxville, Tennessee, and Louisville, Kentucky, also failed. The failures of these institutions triggered a correspondent cascade that forced scores of commercial banks to suspend operations. In communities where these banks closed, depositors panicked and withdrew funds en masse from other banks. Panic spread from town to town. Within a few weeks, hundreds of banks suspended operations. About one-third of these organizations reopened within a few months, but the majority were liquidated (Richardson 2007).

Of course, most of us know but choose to forget these examples, for a variety of reasons – the creation of the Federal Deposit Insurance Corporation has removed most of the threat, that was a long time ago, and so forth.

So it was with interest that I discovered a recent paper of researchers at Cal Tech and UCLA’s Andersson Management School The Self Fulfilling Prophecy of Popular Asset Pricing Models. The authors explore the impact of delegating investment decisions to investment professionals who, by all evidence, apply discounted cash flow models that are disconnected from investor’s individual utility functions.

Despite its elegance, the consumption-based model has one glaring deficiency.

The standard model and its more conventional variants have failed miserably at explaining the cross-section of returns; even tortured versions of the standard model have struggled to match data.

The authors then propose a Gendanken experiment where discounted cash flow models are used by the professional money managers who are delegated to invest by individuals.

The upshot –

Our thought experiment has an intriguing and heretofore unappreciated implication— there is a feedback relation between asset pricing models and the cross-section of expected returns. Our analysis implies that the cross-section of expected returns is not only described by theories of asset pricing, it is also determined by them.

I think Cornell and Hsu are on to something here.

More specifically, I have been trying to understand how to model a trading situation in which predictions of stock high and low prices in a period are self-confirming or self-fulfilling.

Suppose my prediction is that the daily high of Dazzle will be above yesterday’s daily high, if the opening price is above yesterday’s opening price. Then, if this persuades you to buy shares of Dazzle, it would seem that you contribute to the tendency for the stock price to increase. Furthermore, I don’t tell you exactly when the daily high will be reached, so I sort of put you in play. The onus is on you to make the right moves. The forecast does not come under suspicion.

As something of a data scientist, I think I can report that models of stock market trading at the level of agents participating in the market are not a major preoccupation of market analysts or theorists. The starting point seems to be Walras and the problem is how to set the price adjustment mechanism, since the tatonnement is obviously unrealistic

That then brings us probably to experimental economics, which shares a lot of turf with what is called behavioral economics.

The other possibility is simply to observe stock market prices and show that, quite generally, this type of rule must be at play and, because it is not inherently given to be true, it furthermore must be creating the conditions of its own success, to an extent.

Links – February 2015

I buy into the “hedgehog/fox” story, when it comes to forecasting. So you have to be dedicated to the numbers, but still cast a wide net. Here are some fun stories, relevant facts, positive developments, and concerns – first Links post for 2015.

Cool Facts and Projections

How the world’s population has changed – we all need to keep track of this, 9.6 billion souls by 2050, Nigeria’s population outstrips US.

worldpop

What does the world eat for breakfast?

Follow a Real New York Taxi’s Daily Slog 30 Days, 30 random cabbie journeys based on actual location data

Information Technology

Could Microsoft’s HoloLens Be The Real Deal?

MSHolo

I’ll Be Back: The Return of Artificial Intelligence

BloomAI

Issues

Why tomorrow’s technology needs a regulatory revolution Fascinating article. References genome sequencing and frontier biotech, such as,

Jennifer Doudna, for instance, is at the forefront of one of the most exciting biomedical advances in living memory: engineering the genomes not of plants, but of people. Her cheap and easy Crispr technology holds out the promise that anybody with a gene defect could get that problem fixed, on an individual, bespoke basis. No more one-size-fits all disease cures: everything can now be personalized. The dystopian potential here, of course, is obvious: while Doudna’s name isn’t Frankenstein, you can be sure that if and when her science gains widespread adoption, the parallels will be hammered home ad nauseam.

Doudna is particularly interesting because she doesn’t dismiss fearmongers as anti-science trolls. While she has a certain amount of control over what her own labs do, her scientific breakthrough is in the public domain, now, and already more than 700 papers have been published in the past two years on various aspects of genome engineering. In one high-profile example, a team of researchers found a way of using Doudna’s breakthrough to efficiently and predictably cause lung cancer in mice.

There is more on Doudna’ Innovative Genomics Initiative here, but the initially linked article on the need for regulatory breakthrough goes on to make some interesting observations about Uber and Airbnb, both of which have thrived by ignoring regulations in various cities, or even flagrantly breaking the law.

China

Is China Preparing for Currency War? Provocative header for Bloomberg piece with some real nuggets, such as,

Any significant drop in the yuan would prompt Japan to unleash another quantitative-easing blitz. The same goes for South Korea, whose exports are already hurting. Singapore might feel compelled to expand upon last week’s move to weaken its dollar. Before long, officials in Bangkok, Hanoi, Jakarta, Manila, Taipei and even Latin America might act to protect their economies’ competitiveness…

There’s obvious danger in so many economies engaging in this race to the bottom. It will create unprecedented levels of volatility in markets and set in motion flows of hot money that overwhelm developing economies, inflating asset bubbles and pushing down bond rates irrationally low. Consider that Germany’s 10-year debt yields briefly fell below Japan’s (they’re both now in the 0.35 percent to 0.36 percent range). In a world in which the Bank of Japan, the European Central Bank and the Federal Reserve are running competing QE programs, the task of pricing risk can get mighty fuzzy.

Early Look: Deflation Clouds Loom Over China’s Economy

The [Chinese] consumer-price index, a main gauge of inflation, likely rose only 0.9% from a year earlier, according to a median forecast of 13 economists surveyed by the Wall Street Journal

China’s Air Pollution: The Tipping Point

Chinapollution

Energy and Renewables

Good News About How America Uses Energy A lot more solar and renewables, increasing energy efficiency – all probably contributors to the Saudi move to push oil prices back to historic lows, wean consumers from green energy and conservation.

Nuclear will die. Solar will live Companion piece to the above. Noah Smith curates Noahpinion, one of the best and quirkiest economics blogs out there. Here’s Smith on the reason nuclear is toast (in his opinion) –

There are three basic reasons conventional nuclear is dead: cost, safety risk, and obsolescence risk. These factors all interact.            

First, cost. Unlike solar, which can be installed in small or large batches, a nuclear plant requires an absolutely huge investment. A single nuclear plant can cost on the order of $10 billion U.S. That is a big chunk of change to plunk down on one plant. Only very large companies, like General Electric or Hitachi, can afford to make that kind of investment, and it often relies on huge loans from governments or from giant megabanks. Where solar is being installed by nimble, gritty entrepreneurs, nuclear is still forced to follow the gigantic corporatist model of the 1950s.

Second, safety risk. In 1945, the U.S. military used nuclear weapons to destroy Hiroshima and Nagasaki, but a decade later, these were thriving, bustling cities again. Contrast that with Fukushima, site of the 2011 Japanese nuclear meltdown, where whole towns are still abandoned. Or look at Chernobyl, almost three decades after its meltdown. It will be many decades before anyone lives in those places again. Nuclear accidents are very rare, but they are also very catastrophic – if one happens, you lose an entire geographical region to human habitation.

Finally, there is the risk of obsolescence. Uranium fission is a mature technology – its costs are not going to change much in the future. Alternatives, like solar, are young technologies – the continued staggering drops in the cost of solar prove it. So if you plunk down $10 billion to build a nuclear plant, thinking that solar is too expensive to compete, the situation can easily reverse in a couple of years, before you’ve recouped your massive fixed costs.

Owners of the wind Greenpeace blog post on Denmark’s extraordinary and successful embrace of wind power.

What’s driving the price of oil down? Econbrowser is always a good read on energy topics, and this post is no exception. Demand factors tend to be downplayed in favor of stories about Saudi production quotas.

Forecasting Controversy Swirling Around Computer Models and Forecasts

I am intrigued by Fabius Maximus’ We must rely on forecasts by computer models. Are they reliable?

This is a broad, but deeply relevant, question.

With the increasing prominence of science in public policy debates, the public’s beliefs about theories also have effects. Playing to this larger audience, scientists have developed an effective tool: computer models making bold forecasts about the distant future. Many fields have been affected, such as health care, ecology, astronomy, and climate science. With their conclusions amplified by activists, long-term forecasts have become a powerful lever to change pubic opinion.

It’s true. Large scale computer models are vulnerable to confirmation bias in their construction and selection – example being the testing of drugs. There are issues of measuring their reliability and — more fundamentally — validation (e.g., falsification).

Peer-review has proven quite inadequate to cope with these issues (which lie beyond the concerns about peer-review’s ability to cope with even standard research). A review or audit of a large model often requires over a man-years or more of work by a multidisciplinary team of experts, the kind of audit seldom done even on projects of great public concern.

Of course, FM is sort of famous, in my mind, for their critical attitude toward global warming and climate change.

And they don’t lose an opportunity to score points about climate science, citing the Georgia Institute of Technology scientist Judith Curry.

Dr. Curry is author of a recent WSJ piece The Global Warming Statistical Meltdown

At the recent United Nations Climate Summit, Secretary-General Ban Ki-moon warned that “Without significant cuts in emissions by all countries, and in key sectors, the window of opportunity to stay within less than 2 degrees [of warming] will soon close forever.” Actually, this window of opportunity may remain open for quite some time. A growing body of evidence suggests that the climate is less sensitive to increases in carbon-dioxide emissions than policy makers generally assume—and that the need for reductions in such emissions is less urgent.

A key issue in this furious and emotionally-charged debate is discussed in my September blogpost CO2 Concentrations Spiral Up, Global Temperature Stabilizes – Was Gibst?

..carbon dioxide (CO2) concentrations continue to skyrocket, while global temperature has stabilized since around 2000.

The scientific consensus (excluding Professor Curry and the climate change denial community) is that the oceans currently are absorbing the excess heat, but this cannot continue forever.

If my memory serves me (and I don’t have time this morning to run down the link), backtesting the Global Climate Models (GCM) in a recent IPCC methodology publication basically crashed and burned – but the authors blithely moved on to re-iterate the “consensus.”

At the same time, the real science behind climate change – the ice cores for example retrieved from glacial and snow and ice deposits of long tenure – do show abrupt change may be possible. Within a decade or two, for example, there might be regime shifts in global climate.

I am not going to draw conclusions at this point, wishing to carry on this thread with some discussion of macroeconomic models and forecasting.

But I leave you today with my favorite viewing of Blalog’s “Chasing Ice.”

High Frequency Trading – 2

High Frequency Trading (HFT) occurs faster than human response times – often quoted as 750 milliseconds. It is machine or algorithmic trading, as Sean Gourley’s “High Frequency Trading and the New Algorithmic Ecosystem” highlights.

This is a useful introductory video.

It mentions Fixnetix’s field programmable array chip and new undersea cables designed to shave milliseconds off trading speeds from Europe to the US and elsewhere.

Also, Gourley refers to dark pool pinging, which tries to determine the state of large institutional orders by “sniffing them out” and using this knowledge to make (almost) risk-free arbitrage by trading on different exchanges in milliseconds or faster. Institutional investors using slower and not-so-smart algorithms lose.

Other HFT tractics include “quote stuffing”, “smoking”, and “spoofing.” Of these, stuffing may be the most damaging. It limits access of slower traders by submitting large numbers of orders and then canceling them very quickly. This leads to order congestion, which may create technical trouble and lagging quotes.

Smoking and spoofing strategies, on the other hand, try to manipulate other traders to participate in trading at unfavorable moments, such as just before the arrival of relevant news.

Here are some more useful links on this important development and the technological arms race that has unfolded around it.

Financial black swans driven by ultrafast machine ecology Key research on ultrafast black swan events

Nanosecond Trading Could Make Markets Go Haywire Excellent Wired article

High-Frequency Trading and Price Discovery

Defense of HFT on basis that HFTs’ trade (buy or sell) in the direction of permanent price changes and against transitory pricing errors creates benefits which outweigh adverse selection of HFT liquidity supplying (non-marketable) limit orders.

The Good, the Bad, and the Ugly of Automated High-Frequency Trading tries to strike a balance, but tilts toward a critique

Has HFT seen its heyday? I read at one and the same time I read at one and the same time that HFT profits per trade are dropping, that some High Frequency Trading companies report lower profits or are shutting their doors, but that 70 percent of the trades on the New York Stock Exchange are the result of high frequency trading.

My guess is that HFT is a force to be dealt with, and if financial regulators are put under restraint by the new US Congress, we may see exotic new forms flourishing in this area. 

High Frequency Trading and the Efficient Market Hypothesis

Working on a white paper about my recent findings, I stumbled on more confirmation of the decoupling of predictability and profitability in the market – the culprit being high frequency trading (HFT).

It makes a good story.

So I am looking for high quality stock data and came across the CalTech Quantitative Finance Group market data guide. They tout QuantQuote, which does look attractive, and was cited as the data source for – How And Why Kraft Surged 29% In 19 Seconds – on Seeking Alpha.

In early October 2012 (10/3/2012), shares of Kraft Foods Group, Inc surged to a high of $58.54 after opening at $45.36, and all in just 19.93 seconds. The Seeking Alpha post notes special circumstances, such as spinoff of Kraft Foods Group, Inc. (KRFT) from Modelez International, Inc., and addition of KRFT to the S&P500. Funds and ETF’s tracking the S&P500 then needed to hold KRFT, boosting prospects for KRFT’s price.

For 17 seconds and 229 milliseconds after opening October 3, 2012, the following situation, shown in the QuantQuote table, unfolded.

QuantQuote1

Times are given in milliseconds past midnight with the open at 34200000.

There is lots of information in this table – KRFT was not shortable (see the X in the Short Status column), and some trades were executed for dark pools of money, signified by the D in the Exch column.

In any case, things spin out of control a few milliseconds later, in ways and for reasons illustrated with further QuantQuote screen shots.

The moral –

So how do traders compete in a marketplace full of computers? The answer, ironically enough, is to not compete. Unless you are prepared to pay for a low latency feed and write software to react to market movements on the millisecond timescale, you simply will not win. As aptly shown by the QuantQuote tick data…, the required reaction time is on the order of 10 milliseconds. You could be the fastest human trader in the world chasing that spike, but 100% of the time, the computer will beat you to it.

CNN’s Watch high-speed trading in action is a good companion piece to the Seeking Alpha post.

HFT trading has grown by leaps and bounds, but estimates vary – partly because NASDAQ provides the only Datasets to academic researchers that directly classify HFT activity in U.S. equities. Even these do not provide complete coverage, excluding firms that also act as brokers for customers.

Still, the Security and Exchange Commission (SEC) 2014 Literature Review cites research showing that HFT accounted for about 70 percent of NASDAQ trades by dollar volume.

And associated with HFT are shorter holding times for stocks, now reputed to be as low as 22 seconds, although Barry Ritholz contests this sort of estimate.

Felix Salmon provides a list of the “evils” of HFT, suggesting a small transactions tax might mitigate many of these,

But my basic point is that the efficient market hypothesis (EMH) has been warped by technology.

I am leaning to the view that the stock market is predictable in broad outline.

But this predictability does not guarantee profitability. It really depends on how you handle entering the market to take or close out a position.

As Michael Lewis shows in Flash Boys, HFT can trump traders’ ability to make a profit

Stock Market Predictability

The research findings in recent posts here suggest that, in broad outline, the stock market is predictable.

This is one of the most intensively researched areas of financial econometrics.

There certainly is no shortage of studies claiming to forecast stock prices. See for example, Atsalakis, G., and K. Valavanis. “Surveying stock market forecasting techniques-part i: Conventional methods.” Journal of Computational Optimization in Economics and Finance 2.1 (2010): 45-92.

But the field is dominated by decades-long controversy over the efficient market hypothesis (EMH).

I’ve been reading Lim and Brooks outstanding survey article – The Evolution of Stock Market Efficiency Over Time: A Survey of the Empirical Literature.

They highlight two types of studies focusing on the validity of a weak form of the EMH which asserts that security prices fully reflect all information contained in the past price history of the market…

The first strand of studies, which is the focus of our survey, tests the predictability of security returns on the basis of past price changes. More specifically, previous studies in this sub-category employ a wide array of statistical tests to detect different types of deviations from a random walk in financial time series, such as linear serial correlations, unit root, low-dimensional chaos, nonlinear serial dependence and long memory. The second group of studies examines the profitability of trading strategies based on past returns, such as technical trading rules (see the survey paper by Park and Irwin, 2007), momentum and contrarian strategies (see references cited in Chou et al., 2007).

Another line, related to this second branch of research tests.. return predictability using other variables such as the dividend–price ratio, earnings–price ratio, book-to-market ratio and various measures of the interest rates.

Lim and Brooks note the tests for the semi-strong-form and strong-form EMH are renamed as event studies and tests for private information, respectively.

So bottom line – maybe your forecasting model predicts stock prices or rates of return over certain periods, but the real issue is whether it makes money. As Granger writes much earlier, mere forecastability is not enough.

I certainly respect this criterion, and recognize it is challenging. It may be possible to trade on the models of high and low stock prices over periods such I have been discussing, but I can also show you situations in which the irreducibly stochastic elements in the predictions can lead to losses. And avoiding these losses puts you into the field of higher frequency trading, where “all bets are off,” since there is so much that is not known about how that really works, particularly for individual investors.

My  primary purpose, however, in pursuing these types of models is originally not so much for trading (although that is seductive), but to explore new ways of forecasting turning points in economic time series. Confronted with the dismal record of macroeconomic forecasters, for example, one can see that predicting turning points is a truly fundamental problem. And this is true, I hardly need to add, for practical business forecasts. Your sales may do well – and exponential smoothing models may suffice – until the next phase of the business cycle, and so forth.

So I am amazed by the robustness of the turning point predictions from the longer (30 trading days, 40 days, etc.) groupings.

I just have never myself developed or probably even seen an example of predicting turning points as clearly as the one I presented in the previous post relating to the Hong Kong Hang Seng Index.

HSItp

A Simple Example of Stock Market Predictability

Again, without claims as to whether it will help you make money, I want to close this post today with comments about another area of stock price predictability – perhaps even simpler and more basic than relationships regarding the high and low stock price over various periods.

This is an exercise you can try for yourself in a few minutes, and which leads to remarkable predictive relationships which I do not find easy to identify or track in the existing literature regarding stock market predictability.

First, download the Yahoo Finance historical data for SPY, the ETF mirroring the S&P 500. This gives you a spreadsheet with approximately 5530 trading day values for the open, high, low, close, volume, and adjusted close. Sort from oldest to most recent. Then calculate trading-day over trading-day growth rates, for the opening prices and then the closing prices. Then, set up a data structure associating the opening price growth for day t with the closing price growth for day t-1. In other words, lag the growth in the closing prices.

Then, calculate the OLS regression of growth in lagged closing prices onto the growth in opening prices.

You should get something like,

openoverlcose

This is, of course, an Excel package regression output. It indicates that X Variable 1, which is the lagged growth in the closing prices, is highly significant as an explanatory variable, although the intercept or constant is not.

This equation explains about 21 percent of the variation in the growth data for the opening prices.

It also successfully predicts the direction of change of the opening price about 65 percent of the time, or considerably better than chance.

Not only that, but the two and three-period growth in the closing prices are successful predictors of the two and three-period growth in the opening prices.

And it probably is possible to improve the predictive performance of these equations by autocorrelation adjustments.

Comments

Why present the above example? Well, because I want to establish credibility on the point that there are clearly predictable aspects of stock prices, and ones you perhaps have not heard of heretofore.

The finance literature on stock market prediction and properties of stock market returns, not to mention volatility, is some of the most beautiful and complex technical literatures I know of.

But, still, I think new and important relationships can be discovered.

Whether this leads to profit-making is another question. And really, the standards have risen significantly in recent times, with program and high frequency trading possibly snatching profit opportunities from traders at the last microsecond.

So I think the more important point, from a policy standpoint if nothing else, may be whether it is possible to predict turning points – to predict broader movements of stock prices within which high frequency trading may be pushing the boundary.

Analysis of Highs and Lows of the Hong Kong Hang Seng Index, 1987 to the Present

I have discovered a fundamental feature of stock market prices, relating to prediction of the highs and lows in daily, weekly, monthly, and to other more arbitrary groupings of trading days in consecutive blocks.

What I have found is a degree of predictability previously unimagined with respect to forecasts of the high and low for a range of trading periods, extending from daily to 60 days so far.

Currently, I am writing up this research for journal submission, but I am documenting essential features of my findings on this blog.

A few days ago, I posted about the predictability of daily highs and lows for the SPY exchange traded fund. Subsequent posts highlight the generality of the result for the SPY, and more recently, for stocks such as common stock of the Ford Motor Company.

These posts present various graphs illustrating how well the prediction models for the high and low in periods capture the direction of change of the actual highs and lows. Generally, the models are right about 70 to 80 percent of the time, which is incredible.

Furthermore, since one of my long concerns has been to get better forward perspective on turning points – I am particularly interested in the evidence that these models also do fairly well as predicting turning points.

Finally, it is easy to show that these predictive models for the highs and lows of stocks and stock indices over various periods, furthermore, are not simply creations of modern program trading. The same regularities can be identified in earlier periods before easy access to computational power, in the 1980’s and early 1990’s, for example.

Hong Kong’s Hang Seng Index

Today, I want to reach out and look at international data and present findings for Hong Kong’s Hang Seng Index. I suspect Chinese investors will be interested in these results. Perhaps, releasing this information to such an active community of traders will test my hypothesis that these are self-fulfilling predictions, to a degree, and knowledge of their existence intensifies their predictive power.

A few facts about the Hang Seng Index – The Hang Seng Index (HSI) is a free-float adjusted, capitalization-weighted index of approximately 40 of the larger companies on the Hong Kong exchange. First published in 1969, the HSI, according to Investopedia, covers approximately 65% of the total market capitalization of the Hong Kong Stock Exchange. It is currently maintained by HSI Services Limited, a wholly owned subsidiary of Hang Seng Bank – the largest bank registered and listed in Hong Kong in terms of market capitalization.

For data, I download daily open, high, low, close and other metrics from Yahoo Finance. This data begins with the last day in 1986, continuing to the present.

The Hang Seng is a volatile index, as the following chart illustrates.

HSI

Now there are peculiarities about the data on HSI from Yahoo. Trading volumes are zero until 2001, for example, after which time large positive values are to be found in the volume column. Initially, I assume HSI was a pure index and later came to be actually traded in some fashion.

Nevertheless, the same type of predictive models can be developed for the Hang Seng Index, as can be estimated for the SPY and the US stocks.

Again, the key variables in these predictive relationships are the proximity of the period opening price to the previous period high and the previous period low. I estimate regressions with variables constructed from these explanatory variables, mapping them onto growth in period-by-period highs with ordinary least squares (OLS). I find the similar relationships for the Hang Seng in, say, a 30 day periodization as I estimate for the SPY ETF. At the same time there are differences, one of the most notable being the significantly less first order autocorrelation in the Hang Seng regression.

Essentially, higher growth rates for the period-over-previous-period high are predicted whenever the opening price of the current period is greater than the high of the previous period. There are other cases, however, and ultimately the rule is quantitative, taking into account the size of the growth rates for the high as well as these inequality relationships.

Findings

Here is another one of those charts showing the “hit-rate” for predictions of the direction of change of the sign of period-by-period growth rates for the high. In this case, the chart refers to daily trading data. The chart graphs 30 day moving averages of the proportions of time in which the predictive model forecasts the correct sign of the change or growth in the target or independent variable – the growth rate of daily highs (for consecutive trading days). Note that for recent years, the “hit rate” of the predictive model approaches 90 percent of the time, and all these are all out-of-sample predictions.

 HSIproportions

The relationship for the Hang Seng Index, thus, is powerful. Similarly impressive relationships can be derived to predict the daily lows and their direction of change.

But the result I really like with this data is developed with grouping the daily trading data by 30 day intervals.

HSItp

If you do this, you develop a tool which apparently is quite capable of predicting turning points in the Hang Seng.

Thus, between April 2005 and August 2012, a 30-day predictive model captures many of the key features of inflection and turning in the Hang Seng High for comparable periods.

Note that the predictive model makes these forecasts of the high for a period out-of-sample. All the relationships are estimated over historical data which do not include the high (or low) being predicted for the coming 30 day period. Only the opening price for the Hang Seng for that period is necessary.

Concluding Thoughts

I do not present the regression results here, but am pleased to share further information for readers responding to the Comments section to this blog (title ” Request for High/Low Model Information”) or who send requests to the following mail address: Clive Jones, PO Box 1009, Boulder, CO 80306 USA.

Top image from Ancient Chinese Fashion

Sales and new product forecasting in data-limited (real world) contexts