
Currently, I am privileged to have access to databases relating to health insurance and oil and gas developments.
But the richest source of Big Data available to researchers is probably financial, and I can’t resist exploring time series data on the S&P 500 and related exchange traded funds.
This is a tricky field. It is not only crowded with “quants,” but there are, in theory, pitfalls of “rational expectations.” There are strong and weak versions, but, essentially, if “rational expectations” operate, there should be no public information which can give anyone a predictive advantage, since otherwise it would already have been exploited.
Keep that in mind as I relate some remarkable discoveries – so far as I can determine nowhere else documented – on the predictability of the daily high and low values of the SPY, the exchange traded fund (ETF) linked with the S&P 500.
Some Results
A picture is worth a thousand words.
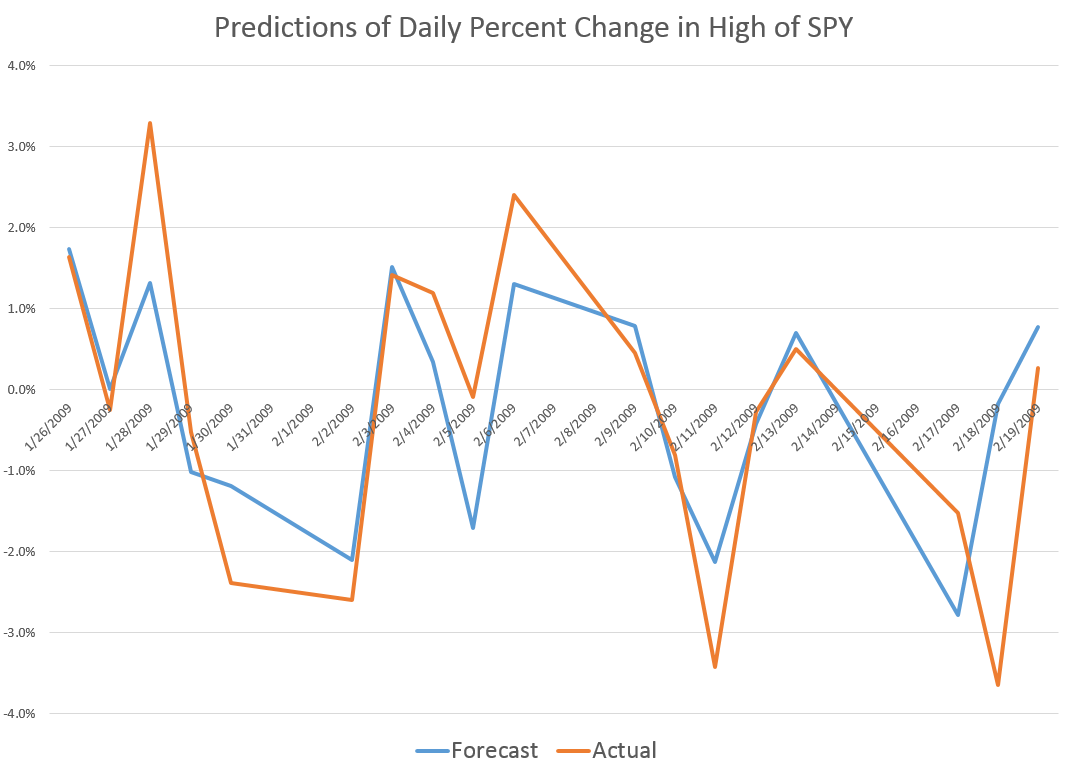
So the above chart shows out-of-sample predictions for several trading days in 2009 that can be achieved with a linear regression based on daily values available, for example, on Yahoo Finance.
Based on the opening value of the SPY, this regression predicts the percent change in the high for the SPY that will be achieved during the trading day – the percent change calculated with the high reached that day, compared with the previous day.
I find it remarkable that there is any predictability at all, since the daily high is an extreme value, highly sensitive to the volatility that day, and so forth.
And it may not be necessary to predict the exact percentage change of the high of SPY from day to day to gain a trading advantage.
Accurate predictions of the direction of change should be useful. In this respect, the analysis is especially powerful. For the particular dates in the chart shown above, for example, the predictive model correctly identifies the direction of change for every trading day but one – February 23, 2009.
I develop an analysis for the period 8/4/2005 to 1/4/2015, developing adaptive regressions to predict, out of sample, the high following the opening of each trading day.
I develop hundreds of regressions in this analysis with some indication that the underlying coefficients vary over time.
The explanatory variables are based on the spread between the opening price for the current period and the high or low of the previous period.
The coefficient of determination or R2 is about 0.6 – much higher than is typical for such regressions with stock or financial time series.This is a powerful relationship.
Here is a chart showing rolling 30 trading day averages of how often (1 = 100% of the time) this modeling effort correctly identifies the sign of the change in the high – again on an out-of-sample basis.

Note that for some 30 day periods, the “hit rate” in which the correct sign of change is predicted exceeds 0.9, or, in other words, is greater than 90 percent of the time.
Overall, for the whole period under consideration, which comes right up to the present, the model averages about 76 percent accuracy in identifying the direction of change in the daily high of SPY.
Stay tuned to Business Forecast blog for a similar analysis of predicting the low values of SPY.
In closing, though, let me note that this remarkable predictability does not, in itself, support profitable trading, at least with any type of simple or direct approach.
Here is why.
If at the opening of the trading day, the model indicates positive change in the level of the high for SPY that day, it would make sense to buy shares of this ETF. Then, you could unload them, presumably at a profit, when the SPY reached the previous day’s high value.
The catch, however, is that you cannot be sure this will happen. Given the forecast, it is probable, or at least has a calculable probability. However, it is also possible that the stock will not reach the previous day’s high during the trading day. The forecast may be correct in its sign, but wrong in its magnitude.
So then, you are stuck with shares of SPY.
If you want to sell that day, not having, for example, any clear idea what will happen the following trading day – in general you will not do very well. In fact, it’s easy to show that this trading strategy – buy when the model indicates growth in the level of the high, sell if you can at the previous high, and otherwise close out your position at the closing price for that trading day – this strategy generally does not do as well as buy-and-hold.
This is probably the rational expectations gremlin at work.
Anyway, stay tuned for some insights on modeling the low of the SPY daily price.