Here is a simulation of the SPDR SPY exchange traded fund index, using an autoregressive model estimated with maximum likehood methods, assuming the underlying distribution is not normal, but is instead a Student t distribution.

The underlying model is of the form
SPYRRt=a0+a1SPYRRt-1…a30SPYRRt-30
Where SPYRR is the daily return (trading day to trading day) of the SPY, based on closing prices.
This is a linear model, and an earlier post lists its exact parameters or, in other words, the coefficients attached to each of the lagged terms, as well as the value of the constant term.
This model is estimated on a training sample of daily returns from 1993 to 2008, and, is applied to out-of-sample data from 2008 to the present. It predicts about 53 percent of the signs of the next-day-returns correctly. The model generates more profits in the 2008 to the present period than a Buy & Hold strategy.
The simulation listed above uses the model equation and parameters, generating a series of 4000 values recursively, adding in randomized error terms from the fit of the equation to the training or estimation data.
This is work-in-progress. Currently, I am thinking about how to properly incorporate volatility. Obviously, any number of realizations are possible. The chart shows one of them, which has an uncanny resemblance to the actual historical series, due to the fact that volatility is created over certain parts of the simulation, in this case by chance.
To review, I set in motion the following process:
- Predict a xt = f(xt-1,..,xt-30) based on the 30 coefficients and a constant term from the autoregressive model, applied to 30 preceding values of xt generated by this process (The estimation is initialized with the first 30 actual values of the test data).
- Randomly select a residual for this xt based on the empirical distribution of errors from the fit of the predictive relationship to the training set.
- Iterate.
The error distribution looks like this.
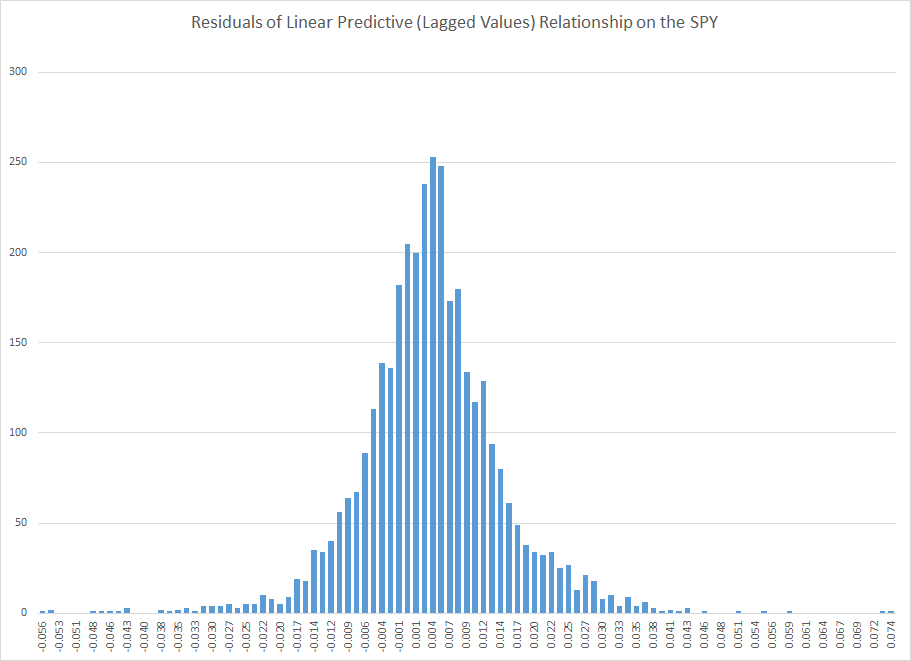
This is obviously not a normal distribution, since “too many” predictive errors are concentrated around the zero error line.
For puzzles and problems, this is a fertile area for research, and you can make money. But obviously, be careful.
In any case, I think this research, in an ultimate analysis, converges to the work being done by Didier Sornette and his co-researchers and co-authors. Sornette et al develop an approach through differential equations, focusing on critical points where a phase shift occurs in trading with a rapid collapse of an asset bubble.
This approach comes at similar, semi-periodic, logarithmically increasing values through linear autoregressive equations, which, as is well known, have complex dynamics when analyzed as difference equations.
The prejudice in economics and econometrics that “you can’t predict the stock market” is an impediment to integrating these methods.
While my research on modeling stock prices is a by-product of my general interest in forecasting and quantitative techniques, I may have an advantage because I will try stuff that more seasoned financial analysts may avoid, because they have been told it does not work.
So I maintain it is possible, at least in the era of quantitative easing (QE), to profit from autoregressive models of daily returns on a major index like the SPY. The models are, admittedly, weak predictors, but they interact with the weird error structure of SPY daily returns in interesting ways. And, furthermore, it is possible for anyone to verify my claims simply by calculating the predictions for the test period from 2008 to the present and then looking at what a Buy & Hold Strategy would have done over the same period.
In this post, I reverse the process. I take one of my autoregressive models and generate, by simulation, time series that look like historical SPY daily values.
On Sornette, about which I think we will be hearing more, since currently the US stock market seems to be in correction model, see – Turbulent times ahead: Q&A with economist Didier Sornette. Also check http://www.er.ethz.ch/presentations/index.