Tag Archives: Data Science

Dimension Reduction With Principal Components

The method of principal components regression has achieved new prominence in machine learning, data reduction, and forecasting over the last decade.

It’s highly relevant in the era of Big Data, because it facilitates analyzing “fat” or wide databases. Fat databases have more predictors than observations. So you might have ten years of monthly data on sales, but 1000 potential predictors, meaning your database would be 120 by 1001 – obeying here the convention of stating row depth first and the number of columns second.

After a brief discussion of these Big Data applications and some elements of principal components, I illustrate dimension reduction with a violent crime database from the UC Irvine Machine Learning Repository.

Dynamic Factor Models

In terms of forecasting, a lot of research over the past decade has focused on “many predictors” and reducing the dimensionality of “fat” databases. Key names are James Stock and Mark Watson (see also) and Bai.

Stock and Watson have a white paper that has been updated several times, which can be found in PDF format at this link

stock watson generalized shrinkage June _2012.pdf

They write in the June 2012 update,

We find that, for most macroeconomic time series, among linear estimators the DFM forecasts make efficient use of the information in the many predictors by using only a small number of estimated factors. These series include measures of real economic activity and some other central macroeconomic series, including some interest rates and monetary variables. For these series, the shrinkage methods with estimated parameters fail to provide mean squared error improvements over the DFM. For a small number of series, the shrinkage forecasts improve upon DFM forecasts, at least at some horizons and by some measures, and for these few series, the DFM might not be an adequate approximation. Finally, none of the methods considered here help much for series that are notoriously difficult to forecast, such as exchange rates, stock prices, or price inflation.

Here DFM refers to dynamic factor models, essentially principal components models which utilize PC’s for lagged data.

Note also that this type of autoregressive or classical time series approach does not work well, in Stock and Watson’s judgment, for “series that are notoriously difficult to forecast, such as exchange rates, stock prices, or price inflation.”

Presumably, these series are closer to being random walks in some configuration.

Intermediate Level Concepts

Essentially, you can take any bundle of data and compute the principal components. If you mean-center and (in most cases) standardize the data, the principal components divide up the variance of this data, based on the size of their associated eigenvalues. The associated eigenvectors can be used to transform the data into an equivalent and same size set of orthogonal vectors. Really, the principal components operate to change the basis of the data, transforming it into an equivalent representation, but one in which all the variables have zero correlation with each other.

The Wikipaedia article on principal components is useful, but there is no getting around the fact that principal components can only really be understood with matrix algebra.

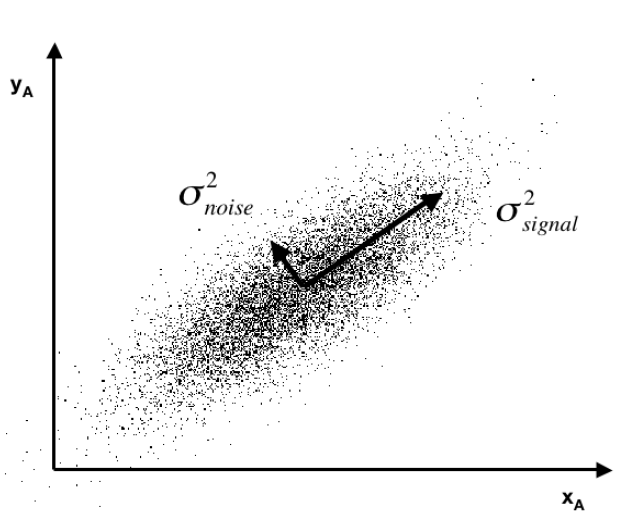
Often you see a diagram, such as the one below, showing a cloud of points distributed around a line passing through the origin of a coordinate system, but at an acute angle to those coordinates.

pcpic

This illustrates dimensionality reduction with principal components. If we express all these points in terms of this rotated set of coordinates, one of these coordinates – the signal – captures most of the variation in the data. Projections of the datapoints onto the second principal component, therefore, account for much less variance.

Principal component regression characteristically specifies only the first few principal components in the regression equation, knowing that, typically, these explain the largest portion of the variance in the data.

An Application to Crime Data

Looking for some non-macroeconomic data to illustrate principal components (PC) regression, I found the Communities and Crime Data Set in the University of California at Irving Machine Learning Repository.

The data do not illustrate “many predictors” in the sense of more predictors than observations.

Here, the crime and other data comprise 128 variables, including a violent crime variable, which are collated for 1994 cities. That is, there are more observations than predictors.

The variables included in the dataset involve the community, such as the percent of the population considered urban, and the median family income, and involving law enforcement, such as per capita number of police officers, and percent of officers assigned to drug units. The per capita violent crimes variable was calculated using population and the sum of crime variables considered violent crimes in the United States: murder, rape, robbery, and assault.

I standardize the data, dropping variables with a lot of missing values. That leaves me 100 variables, including the violent crime metric.

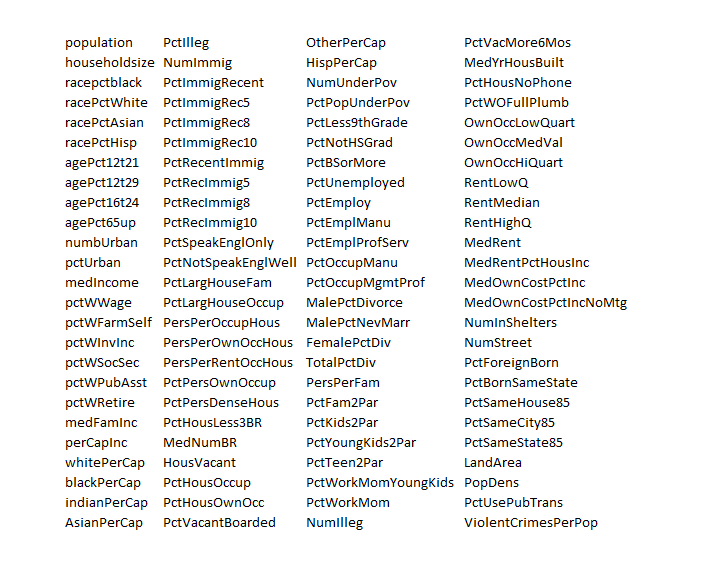
This table gives you a flavor of the variables included – you have to interpret the abbreviations

crime

I developed a comparison of OLS regression with principal components regression, finding that principal component regression can outperform OLS in out-of-sample predictions of violent crimes per capita.

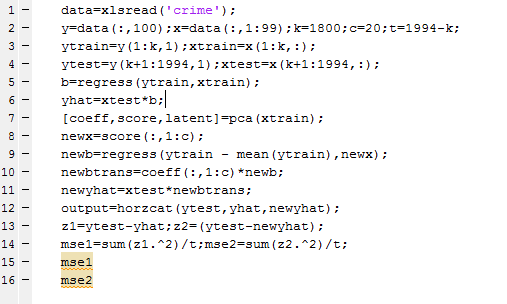
The Matlab program to carry out this analysis is as follows:

Matalbp

So I used a training set of 1800 cities, and developed OLS and PC regressions to predict violent crime per capita in the remaining 194 cities.  I calculate the  principal components (coeff) from a training set (xtrain) comprised of the first 1800 cities. Then, I select the first twenty pc’s  and translate them back to weightings on all 99 variables for application to the test set (xtest). I also calculate OLS regression coefficients on xtrain.

The mean square prediction error (mse1) of the OLS regression was 0.35 and the mean square prediction error (mse2) of the PC regression was 0.34 – really a marginal difference but large enough to make the point.

What’s really interesting is that I had to use the first twenty (20) principal components to achieve this improvement. Thus, this violent crime database has a quite diverse characteristic, compared with many socioeconomic datasets I have seen, where, as noted above, the first few principal components explain most of the variation in the data.

This method – PC regression – is especially good when there are predictors which are closely correlated (“multicollinearity”) as often is the case with market research surveys of consumer attitudes and income and wealth variables.

The bottom line here is that principal compoments can facilitate data reduction or regression regularization. Quite often, this can improve the prediction capabilities of a regression, when compared with an OLS regression using all the variables. The PC regression assigns higher weights to the most important predictors, in effect performing a kind of variable selection – although the coefficients or pc’s may not zero out variables per se.

I am continuing to work on this data with an eye to implementing k-fold cross-validation as a way of estimating the optimal number of principal components which should be used in the PC regressions.

Estimation and Variable Selection with Ridge Regression and the LASSO

I’ve posted on ridge regression and the LASSO (Least Absolute Shrinkage and Selection Operator) some weeks back.

Here I want to compare them in connection with variable selection  where there are more predictors than observations (“many predictors”).

1. Ridge regression does not really select variables in the many predictors situation. Rather, ridge regression “shrinks” all predictor coefficient estimates toward zero, based on the size of the tuning parameter λ. When ordinary least squares (OLS) estimates have high variability, ridge regression estimates of the betas may, in fact, produce lower mean square error (MSE) in prediction.

2. The LASSO, on the other hand, handles estimation in the many predictors framework and performs variable selection. Thus, the LASSO can produce sparse, simpler, more interpretable models than ridge regression, although neither dominates in terms of predictive performance. Both ridge regression and the LASSO can outperform OLS regression in some predictive situations – exploiting the tradeoff between variance and bias in the mean square error.

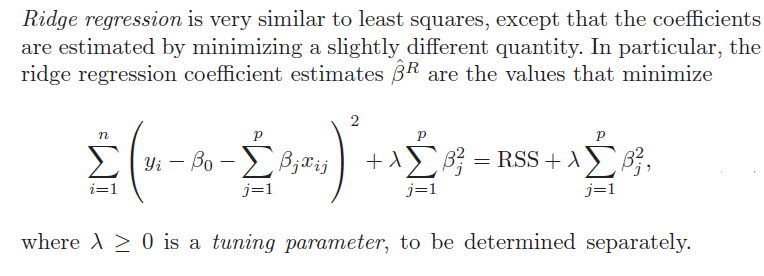
3. Ridge regression and the LASSO both involve penalizing OLS estimates of the betas. How they impose these penalties explains why the LASSO can “zero” out coefficient estimates, while ridge regression just keeps making them smaller. From
An Introduction to Statistical Learning

ridgeregressionOF

Similarly, the objective function for the LASSO procedure is outlined by An Introduction to Statistical Learning, as follows

LASSOobkf

4. Both ridge regression and the LASSO, by imposing a penalty on the regression sum of squares (RWW) shrink the size of the estimated betas. The LASSO, however, can zero out some betas, since it tends to shrink the betas by fixed amounts, as λ increases (up to the zero lower bound). Ridge regression, on the other hand, tends to shrink everything proportionally.

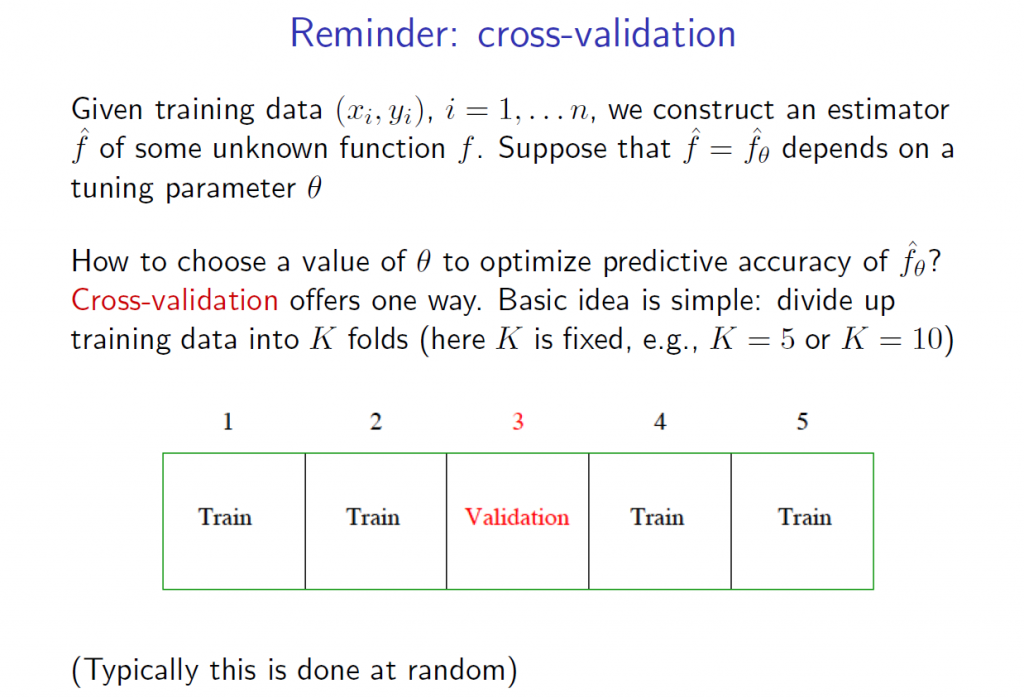
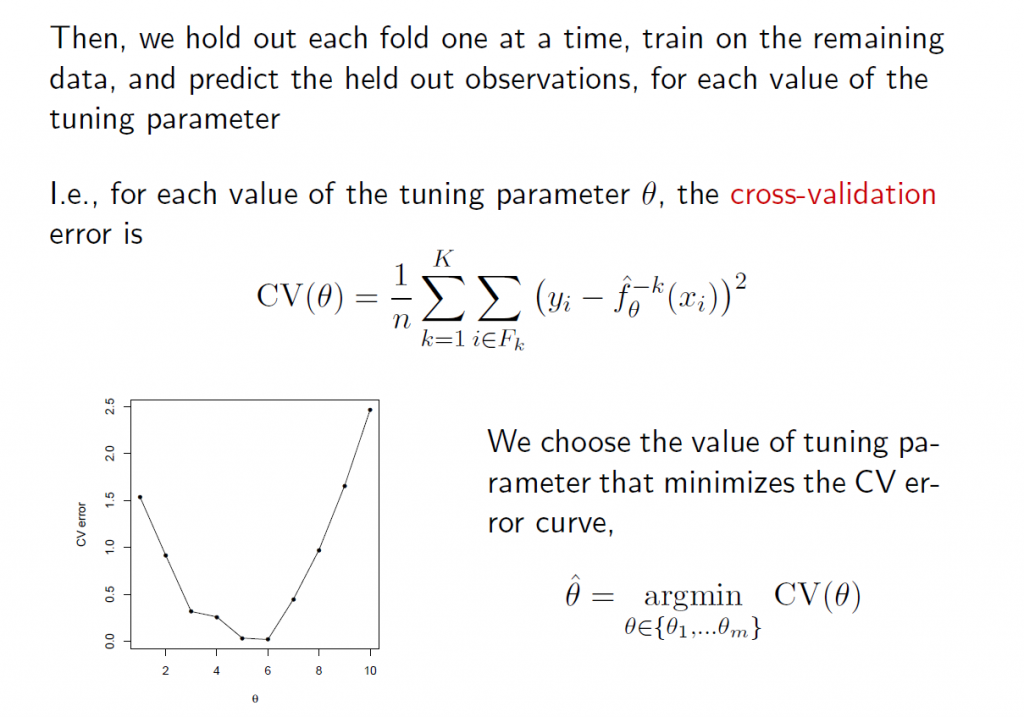
5.The tuning parameter λ in ridge regression and the LASSO usually is determined by cross-validation. Here are a couple of useful slides from Ryan Tibshirani’s Spring 2013 Data Mining course at Carnegie Mellon.

RTCV1

RTCV2

6.There are R programs which estimate ridge regression and lasso models and perform cross validation, recommended by these statisticians from Stanford and Carnegie Mellon. In particular, see glmnet at CRAN. Mathworks MatLab also has routines to do ridge regression and estimate elastic net models.

Here, for example, is R code to estimate the LASSO.

lasso.mod=glmnet(x[train,],y[train],alpha=1,lambda=grid)
plot(lasso.mod)
set.seed(1)
cv.out=cv.glmnet(x[train,],y[train],alpha=1)
plot(cv.out)
bestlam=cv.out$lambda.min
lasso.pred=predict(lasso.mod,s=bestlam,newx=x[test,])
mean((lasso.pred-y.test)^2)
out=glmnet(x,y,alpha=1,lambda=grid)
lasso.coef=predict(out,type=”coefficients”,s=bestlam)[1:20,]
lasso.coef
lasso.coef[lasso.coef!=0]

 What You Get

I’ve estimated quite a number of ridge regression and LASSO models, some with simulated data where you know the answers (see the earlier posts cited initially here) and other models with real data, especially medical or health data.

As a general rule of thumb, An Introduction to Statistical Learning notes,

 ..one might expect the lasso to perform better in a setting where a relatively small number of predictors have substantial coefficients, and the remaining predictors have coefficients that are very small or that equal zero. Ridge regression will perform better when the response is a function of many predictors, all with coefficients of roughly equal size.

The R program glmnet linked above is very flexible, and can accommodate logistic regression, as well as regression with continuous, real-valued dependent variables ranging from negative to positive infinity.


The Tibshirani’s – Statistics and Machine Learning Superstars

As regular readers of this blog know, I’ve migrated to a weekly (or potentially longer) topic focus, and this week’s topic is variable selection.

And the next planned post in the series will compare and contrast ridge regression and the LASSO (least absolute shrinkage and selection operator). There also are some new results for the LASSO. But all this takes time and is always better when actual computations can be accomplished to demonstrate points.

But in researching this, I’ve come to a deeper appreciation of the Tibshiranis.

Robert Tibshirani was an early exponent of the LASSO and has probably, as much as anyone, helped integrate the LASSO into standard statistical procedures.

Here’s his picture from Wikipedia.

RobertTib2

You might ask why put his picuture up, and my answer is that Professor Robert Tibshirani (Stanford) has a son Ryan Tibshirani, whose picture is just below.

Ryan Tibsharani has a great Data Mining course online from Carnegie Mellon, where he is an Assistant Professor.

RyanTib

Professor Ryan Tibshirani’s Spring 2013 a Data Mining course can be found at http://www.stat.cmu.edu/~ryantibs/datamining/

Reviewing Ryan Tibsharani’s slides is very helpful in getting insight into topics like cross validation, ridge regression and the LASSO.

And let us not forget Professor Ryan Tibshirani is author of essential reading about how to pick your target in darts, based on your skill level (hint – don’t go for the triple-20 unless you are good).

Free Books on Machine Learning and Statistics

Robert Tibshirani et al’s text – Elements of Statistical Learning is now in the 10th version and is available online free here.

But the simpler An Introduction to Statistical Leaning is also available for an online download of a PDF file here. This is the corrected 4th printing. The book, which I have been reading today, is really dynamite – an outstanding example of scientific exposition and explanation.

These guys and their collaborators are truly gifted teachers. They create windows into new mathematical and statistical worlds, as it were.

Selecting Predictors – the Specification Problem

I find toy examples helpful in exploratory work.

So here is a toy example showing the pitfalls of forward selection of regression variables, in the presence of correlation between predictors. In other words, this is an example of the specification problem.

Suppose the true specification or regression is –

y = 20x1-11x2+10x3

and the observations on x2 and x3 in the available data are correlated.

To produce examples of this system, I create columns of random numbers in which the second and third columns are correlated with a correlation coefficient of around 0.6. I also add a random error term with zero mean and constant variance of 10. Then, after generating the data and the error terms, I apply the coefficients indicated above and estimate values for the dependent variable y.

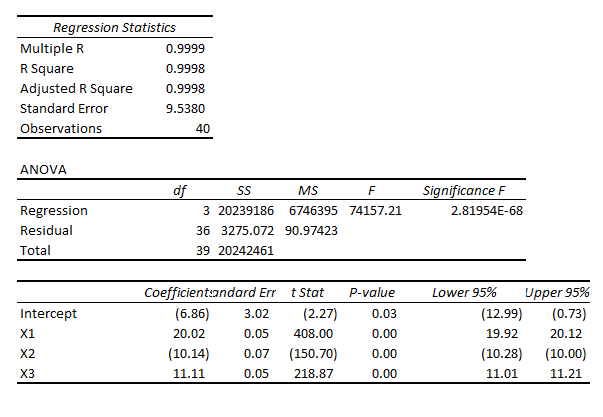
Then, specifying all three variables,  x1, x2, and x3, I estimate regressions which characteristically have coefficient values not far from the (20,-11, 10), such as,

spregThis, of course, is a regression output from Microsoft Excel, where I developed this simple Monte Carlo simulation which has 40 “observations.”

If you were lucky enough to estimate this regression initially, you well might stop and not bother about dropping variables to estimate other potentially competing models.

However, if you start with fewer variables, you encounter a significant difficulty.

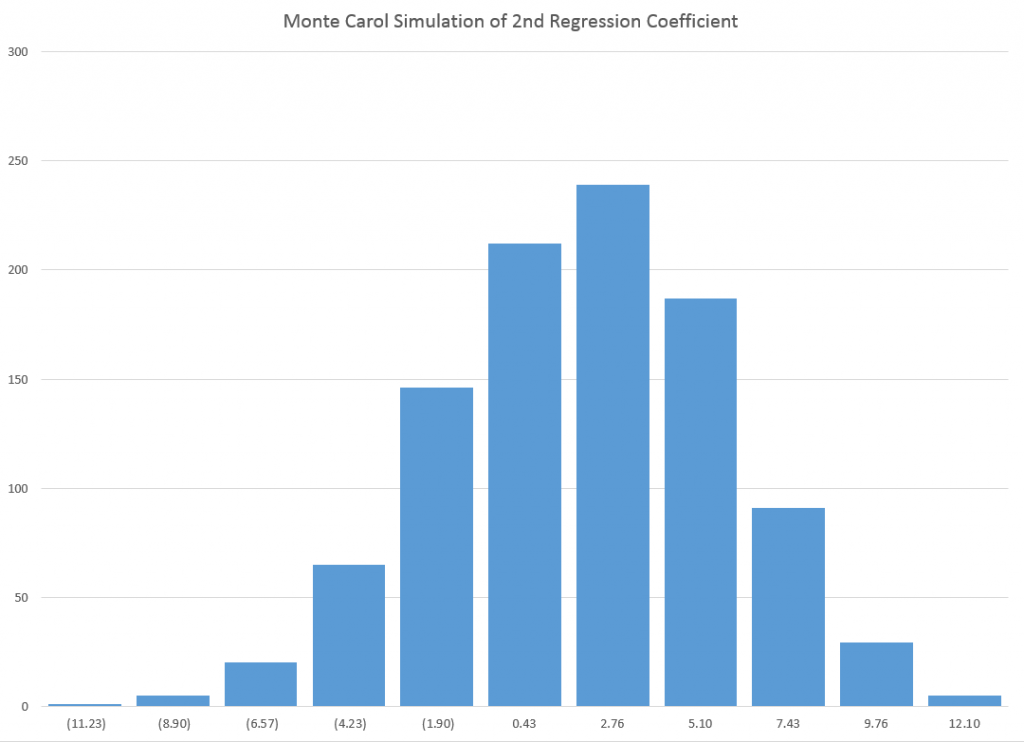
Here is the distribution of x2 in repeated estimates of a regression with explanatory variables x1 and x2 –

coeff2

As you can see, the various estimates of the value of this coefficient, whose actual or true value is -11, are wide of the mark. In fact, none of the 1000 estimates in this simulation proved to be statistically significant at standard levels.

Using some flavors of forward regression, therefore, you well might decide to drop x2 in the specification and try including x3.

But you would have the same type of problem in that case, too, since x2 and x3 are correlated.

I sometimes hear people appealing to stability arguments in the face of the specification problem. In other words, they strive to find a stable set of core predictors, believing that if they can do this, they will have controlled as effectively as they can for this problem of omitted variables which are correlated with other variables that are included in the specification.

Trend Following in the Stock Market

Noah Smith highlights some amazing research on investor attitudes and behavior in Does trend-chasing explain financial markets?

He cites 2012 research by Greenwood and Schleifer where these researchers consider correlations between investor expectations, as measured by actual investor surveys, and subsequent investor behavior.

A key graphic is the following:

Untitled

This graph shows rather amazingly, as Smith points out..when people say they expect stocks to do well, they actually put money into stocks. How do you find out what investor expectations are? – You ask them – then it’s interesting it’s possible to show that for the most part they follow up attitudes with action.

This discussion caught my eye since Sornette and others attribute the emergence of bubbles to momentum investing or trend-following behavior. Sometimes Sornette reduces this to “herding” or mimicry. I think there are simulation models, combining trend investors with others following a market strategy based on “fundamentals”, which exhibit cumulating and collapsing bubbles.

More on that later, when I track all that down.

For the moment, some research put out by AQR Capital Management in Greenwich CT makes big claims for an investment strategy based on trend following –

The most basic trend-following strategy is time series momentum – going long markets with recent positive returns and shorting those with recent negative returns. Time series momentum has been profitable on average since 1985 for nearly all equity index futures, fixed income futures, commodity futures, and currency forwards. The strategy explains the strong performance of Managed Futures funds from the late 1980s, when fund returns and index data first becomes available.

This paragraph references research by Moscowitz and Pederson published in the Journal of Financial Economics – an article called Time Series Momentum.

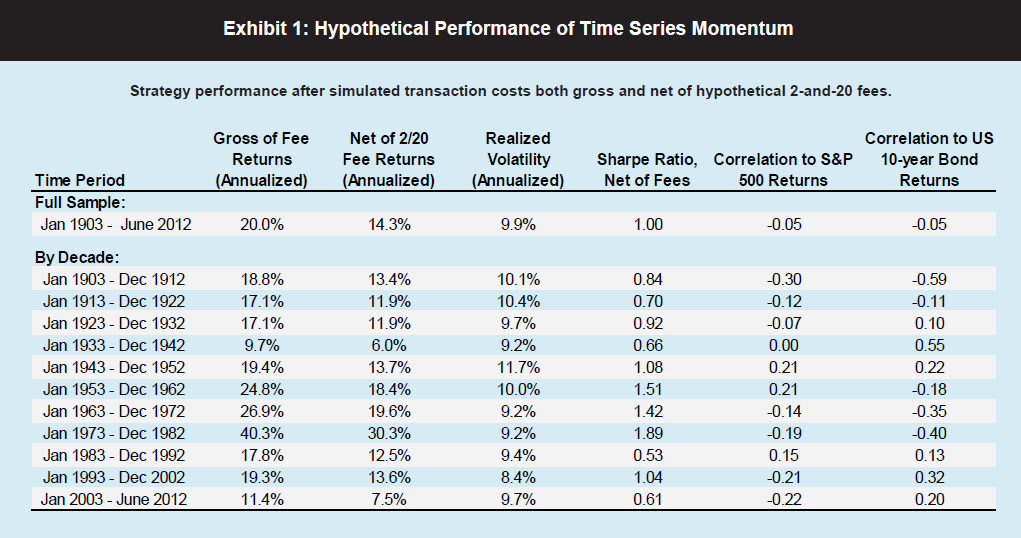
But more spectacularly, this AQR white paper presents this table of results for a trend-following investment strategy decade-by-decade.

Trend

There are caveats to this rather earth-shaking finding, but what it really amounts to for many investors is a recommendation to look into managed futures.

Along those lines there is this video interview, conducted in 2013, with Brian Hurst, one of the authors of the AQR white paper. He reports that recently trending-following investing has run up against “choppy” markets, but holds out hope for the longer term –

http://www.morningstar.com/advisor/v/69423366/will-trends-reverse-for-managed-futures.htm

At the same time, caveat emptor. Bloomberg reported late last year that a lot of investors plunging into managed futures after the Great Recession of 2008-2009 have been disappointed, in many cases, because of the high, unregulated fees and commissions involved in this type of alternative investment.

Medical/Health Predictive Analytics – Logistic Regression

The case for assessing health risk with logistic regression is made by authors of a 2009 study, which is also a sort of model example for Big Data in diagnostic medicine.

As the variables that help predict breast cancer increase in number, physicians must rely on subjective impressions based on their experience to make decisions. Using a quantitative modeling technique such as logistic regression to predict the risk of breast cancer may help radiologists manage the large amount of information available, make better decisions, detect more cancers at early stages, and reduce unnecessary biopsies

This study – A Logistic Regression Model Based on the National Mammography Database Format to Aid Breast Cancer Diagnosis  – pulled together 62,219 consecutive mammography records from 48,744 studies in 18,270 patients reported using the Breast Imaging Reporting and Data System (BI-RADS) lexicon and the National Mammography Database format between April 5, 1999 and February 9, 2004.

The combination of medical judgment and an algorithmic diagnostic tool based on extensive medical records is, in the best sense, the future of medical diagnosis and treatment.

And logistic regression has one big thing going for it – a lot of logistic regressions have been performed to identify risk factors for various diseases or for mortality from a particular ailment.

A logistic regression, of course, maps a zero/one or categorical variable onto a set of explanatory variables.

This is not to say that there are not going to be speedbumps along the way. Interestingly, these are data science speedbumps, what some would call statistical modeling issues.

Picking the Right Variables, Validating the Logistic Regression

The problems of picking the correct explanatory variables for a logistic regression and model validation are linked.

The problem of picking the right predictors for a logistic regression is parallel to the problem of picking regressors in, say, an ordinary least squares (OLS) regression with one or two complications. You need to try various specifications (sets of explanatory variables) and utilize a raft of diagnostics to evaluate the different models. Cross-validation, utilized in the breast cancer research mentioned above, is probably better than in-sample tests. And, in addition, you need to be wary of some of the weird features of logistic regression.

A survey of medical research from a few years back highlights the fact that a lot of studies shortcut some of the essential steps in validation.

A Short Primer on Logistic Regression

I want to say a few words about how the odds-ratio is the key to what logistic regression is all about.

Logistic regression, for example, does not “map” a predictive relationship onto a discrete, categorical index, typically a binary, zero/one variable, in the same way ordinary least squares (OLS) regression maps a predictive relationship onto dependent variables. In fact, one of the first things one tends to read, when you broach the subject of logistic regression, is that, if you try to “map” a binary, 0/1 variable onto a linear relationship β01x12x2 with OLS regression, you are going to come up against the problem that the predictive relationship will almost always “predict” outside the [0,1] interval.

Instead, in logistic regression we have a kind of background relationship which relates an odds-ratio to a linear predictive relationship, as in,

ln(p/(1-p)) = β01x12x2

Here p is a probability or proportion and the xi are explanatory variables. The function ln() is the natural logarithm to the base e (a transcendental number), rather than the logarithm to the base 10.

The parameters of this logistic model are β0, β1, and β2.

This odds ratio is really primary and from the logarithm of the odds ratio we can derive the underlying probability p. This probability p, in turn, governs the mix of values of an indicator variable Z which can be either zero or 1, in the standard case (there being a generalization to multiple discrete categories, too).

Thus, the index variable Z can encapsulate discrete conditions such as hospital admissions, having a heart attack, or dying – generally, occurrences and non-occurrences of something.

Chinesemathteacher

It’s exactly analogous to flipping coins, say, 100 times. There is a probability of getting a heads on a flip, usually 0.50. The distribution of the number of heads in 100 flips is a binomial, where the probability of getting say 60 heads and 40 tails is the combination of 100 things taken 60 at a time, multiplied into (0.5)60*(0.5)40. The combination of 100 things taken 60 at a time equals 60!/(60!40!) where the exclamation mark indicates “factorial.”

Similarly, the probability of getting 60 occurrences of the index Z=1 in a sample of 100 observations is (p)60*(1-p)40multiplied by 60!/(60!40!).

The parameters βi in a logistic regression are estimated by means of maximum likelihood (ML).  Among other things, this can mean the optimal estimates of the beta parameters – the parameter values which maximize the likelihood function – must be estimated by numerical analysis, there being no closed form solutions for the optimal values of β0, β1, and β2.

In addition, interpretation of the results is intricate, there being no real consensus on the best metrics to test or validate models.

SAS and SPSS as well as software packages with smaller market shares of the predictive analytics space, offer algorithms, whereby you can plug in data and pull out parameter estimates, along with suggested metrics for statistical significance and goodness of fit.

There also are logistic regression packages in R.

But you can do a logistic regression, if the data are not extensive, with an Excel spreadsheet.

This can be instructive, since, if you set it up from the standpoint of the odds-ratio, you can see that only certain data configurations are suitable. These configurations – I refer to the values which the explanatory variables xi can take, as well as the associated values of the βi – must be capable of being generated by the underlying probability model. Some data configurations are virtually impossible, while others are inconsistent.

This is a point I find lacking in discussions about logistic regression, which tend to note simply that sometimes the maximum likelihood techniques do not converge, but explode to infinity, etc.

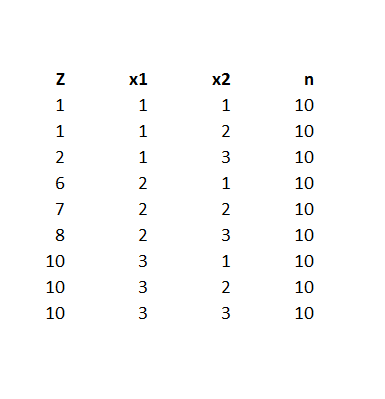
Here is a spreadsheet example, where the predicting equation has three parameters and I determine the underlying predictor equation to be,

ln(p/(1-p))=-6+3x1+.05x2

and we have the data-

logisticregmodel

Notice the explanatory variables x1 and x2 also are categorical, or at least, discrete, and I have organized the data into bins, based on the possible combinations of the values of the explanatory variables – where the number of cases in each of these combinations or populations is given to equal 10 cases. A similar setup can be created if the explanatory variables are continuous, by partitioning their ranges and sorting out the combination of ranges in however many explanatory variables there are, associating the sum of occurrences associated with these combinations. The purpose of looking at the data this way, of course, is to make sense of an odds-ratio.

The predictor equation above in the odds ratio can be manipulated into a form which explicitly indicates the probability of occurrence of something or of Z=1. Thus,

p= eβ0+β1×1+β2×2/(1+ eβ0+β1×1+β2×2)

where this transformation takes advantage of the principle that elny = y.

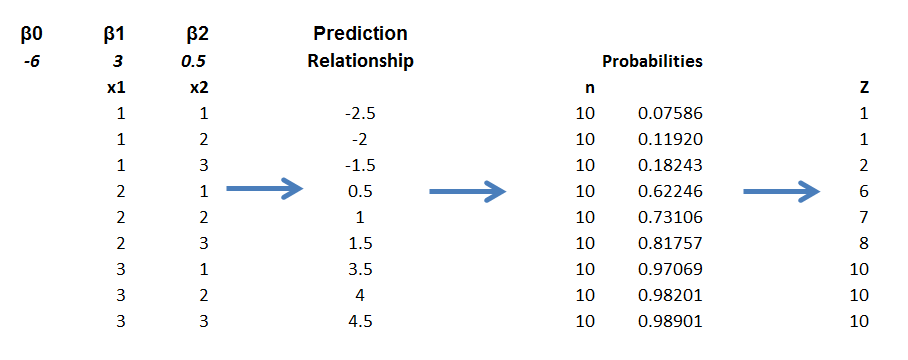
So with this equation for p, I can calculate the probabilities associated with each of the combinations in the data rows of the spreadsheet. Then, given the probability of that configuration, I calculate the expected value of Z=1 by the formula 10p. Thus, the mean of a binomial variable with probability p is np, where n is the number of trials. This sequence is illustrated below (click to enlarge).

sequence

Picking the “success rates” for each of the combinations to equal the expected value of the occurrences, given 10 “trials,” produces a highly consistent set of data.

Along these lines, the most valuable source I have discovered for ML with logistic regression is a paper by Scott
Czepiel – Maximum Likelihood Estimation of Logistic Regression Models: Theory and Implementation
.

I can readily implement Czepiel’s log likelihood function in his Equation (9) with an Excel spreadsheet and Solver.

It’s also possible to see what can go wrong with this setup.

For example, the standard deviation of a binomial process with probability p and n trials is np(1-p). If we then simulate the possible “occurrences” for each of the nine combinations, some will be closer to the estimate of np used in the above spreadsheet, others will be more distant. Peforming such simulations, however, highlights that some numbers of occurrences for some combinations will simply never happen, or are well nigh impossible, based on the laws of chance.

Of course, this depends on the values of the parameters selected, too – but it’s easy to see that, whatever values selected for the parameters, some low probability combinations will be highly unlikely to produce a high number for successes. This results in a nonconvergent ML process, so some parameters simply may not be able to be estimated.

This means basically that logistic regression is less flexible in some sense than OLS regression, where it is almost always possible to find values for the parameters which map onto the dependent variable.

What This Means

Logistic regression, thus, is not the exact analogue of OLS regression, but has nuances of its own. This has not prohibited its wide application in medical risk assessment (and I am looking for a survey article which really shows the extent of its application across different medical fields).

There also are more and more reports of the successful integration of medical diagnostic systems, based in some way on logistic regression analysis, in informing medical practices.

But the march of data science is relentless. Just when doctors got a handle on logistic regression, we have a raft of new techniques, such as random forests and splines.

Header image courtesy of: National Kidney & Urologic Diseases Information Clearinghouse (NKUDIC)

Predicting the Market Over Short Time Horizons

Google “average time a stock is held.” You will come up with figures that typically run around 20 seconds. High frequency trades (HFT) dominate trading volume on the US exchanges.

All of which suggests the focus on the predictability of stock returns needs to position more on intervals lasting seconds or minutes, rather than daily, monthly, or longer trading periods.

So, it’s logical that Michael Rechenthin, a newly minted Iowa Ph.D., and Nick Street, a Professor of Management, are getting media face time from research which purportedly demonstrates the existence of predictable short-term trends in the market (see Using conditional probability to identify trends in intra-day high-frequency equity pricing).

Here’s the abstract –

By examining the conditional probabilities of price movements in a popular US stock over different high-frequency intra-day timespans, varying levels of trend predictability are identified. This study demonstrates the existence of predictable short-term trends in the market; understanding the probability of price movement can be useful to high-frequency traders. Price movement was examined in trade-by-trade (tick) data along with temporal timespans between 1 s to 30 min for 52 one-week periods for one highly-traded stock. We hypothesize that much of the initial predictability of trade-by-trade (tick) data is due to traditional market dynamics, or the bouncing of the price between the stock’s bid and ask. Only after timespans of between 5 to 10 s does this cease to explain the predictability; after this timespan, two consecutive movements in the same direction occur with higher probability than that of movements in the opposite direction. This pattern holds up to a one-minute interval, after which the strength of the pattern weakens.

The study examined price movements of the exchange traded fund SPY, during 2005, finding that

.. price movements can be predicted with a better than 50-50 accuracy for anywhere up to one minute after the stock leaves the confines of its bid-ask spread. Probabilities continue to be significant until about five minutes after it leaves the spread. By 30 minutes, the predictability window has closed.

Of course, the challenges of generalization in this world of seconds and minutes is tremendous. Perhaps, for example, the patterns the authors identify are confined to the year of the study. Without any theoretical basis, brute force generalization means riffling through additional years of 31.5 million seconds each.

Then, there are the milliseconds, and the recent blockbuster written by Michael Lewis – Flash Boys: A Wall Street Revolt.

I’m on track for reading this book for a bookclub to which I belong.

As I understand it, Lewis, who is one of my favorite financial writers, has uncovered a story whereby high frequency traders, operating with optical fiber connections to the New York Stock Exchange, sometimes being geographically as proximate as possible, can exploit more conventional trading – basically buying a stock after you have put in a buy order, but before your transaction closes, thus raising your price if you made a market order.

MLewis

The LA Times  has a nice review of the book and ran the above photo of Lewis.

Stock Market Predictability – Controversy

In the previous post, I drew from papers by Neeley, who is Vice President of the Federal Reserve Bank of St. Louis, David Rapach at St. Louis University and Goufu Zhou at Washington University in St. Louis.

These authors contribute two papers on the predictability of equity returns.

The earlier one – Forecasting the Equity Risk Premium: The Role of Technical Indicators – is coming out in Management Science. Of course, the survey article – Forecasting the Equity Risk Premium: The Role of Technical Indicators – is a chapter in the recent volume 2 of the Handbook of Forecasting.

I go through this rather laborious set of citations because it turns out that there is an underlying paper which provides the data for the research of these authors, but which comes to precisely the opposite conclusion –

The goal of our own article is to comprehensively re-examine the empirical evidence as of early 2006, evaluating each variable using the same methods (mostly, but not only, in linear models), time-periods, and estimation frequencies. The evidence suggests that most models are unstable or even spurious. Most models are no longer significant even insample (IS), and the few models that still are usually fail simple regression diagnostics.Most models have performed poorly for over 30 years IS. For many models, any earlier apparent statistical significance was often based exclusively on years up to and especially on the years of the Oil Shock of 1973–1975. Most models have poor out-of-sample (OOS) performance, but not in a way that merely suggests lower power than IS tests. They predict poorly late in the sample, not early in the sample. (For many variables, we have difficulty finding robust statistical significance even when they are examined only during their most favorable contiguous OOS sub-period.) Finally, the OOS performance is not only a useful model diagnostic for the IS regressions but also interesting in itself for an investor who had sought to use these models for market-timing. Our evidence suggests that the models would not have helped such an investor. Therefore, although it is possible to search for, to occasionally stumble upon, and then to defend some seemingly statistically significant models, we interpret our results to suggest that a healthy skepticism is appropriate when it comes to predicting the equity premium, at least as of early 2006. The models do not seem robust.

This is from Ivo Welch and Amit Goyal’s 2008 article A Comprehensive Look at The Empirical Performance of Equity Premium Prediction in the Review of Financial Studies which apparently won an award from that journal as the best paper for the year.

And, very importantly, the data for this whole discussion is available, with updates, from Amit Goyal’s site now at the University of Lausanne.

AmitGoyal

Where This Is Going

Currently, for me, this seems like a genuine controversy in the forecasting literature. And, as an aside, in writing this blog I’ve entertained the notion that maybe I am on the edge of a new form of or focus in journalism – namely stories about forecasting controversies. It’s kind of wonkish, but the issues can be really, really important.

I also have a “hands-on” philosophy, when it comes to this sort of information. I much rather explore actual data and run my own estimates, than pick through theoretical arguments.

So anyway, given that Goyal generously provides updated versions of the data series he and Welch originally used in their Review of Financial Studies article, there should be some opportunity to check this whole matter. After all, the estimation issues are not very difficult, insofar as the first level of argument relates primarily to the efficacy of simple bivariate regressions.

By the way, it’s really cool data.

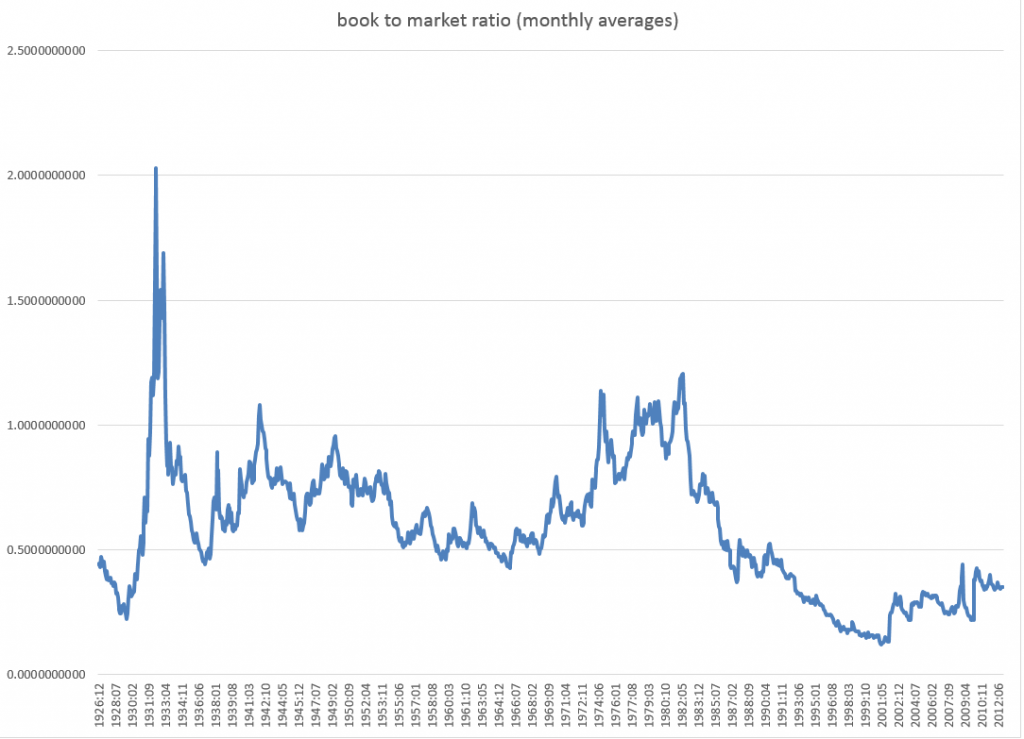
Here is the book-to-market ratio, dating back to 1926.

bmratio

But beyond these simple regressions that form a large part of the argument, there is another claim made by Neeley, Rapach, and Zhou which I take very seriously. And this is that – while a “kitchen sink” model with all, say, fourteen so-called macroeconomic variables does not outperform the benchmark, a principal components regression does.

This sounds really plausible.

Anyway, if readers have flagged updates to this controversy about the predictability of stock market returns, let me know. In addition to grubbing around with the data, I am searching for additional analysis of this point.

Bootstrapping

I’ve been reading about the bootstrap. I’m interested in bagging or bootstrap aggregation.

The primary task of a statistician is to summarize a sample based study and generalize the finding to the parent population in a scientific manner..

The purpose of a sample study is to gather information cheaply in a timely fashion. The idea behind bootstrap is to use the data of a sample study at hand as a “surrogate population”, for the purpose of approximating the sampling distribution of a statistic; i.e. to resample (with replacement) from the sample data at hand and create a large number of “phantom samples” known as bootstrap samples. The sample summary is then computed on each of the bootstrap samples (usually a few thousand). A histogram of the set of these computed values is referred to as the bootstrap distribution of the statistic.

These well-phrased quotes come from Bootstrap: A Statistical Method by Singh and Xie.

OK, so let’s do a simple example.

Suppose we generate ten random numbers, drawn independently from a Gaussian or normal distribution with a mean of 10 and standard deviation of 1.

vector

This sample has an average of 9.7684. We would like to somehow project a 95 percent confidence interval around this sample mean, to understand how close it is to the population average.

So we bootstrap this sample, drawing 10,000 samples of ten numbers with replacement.

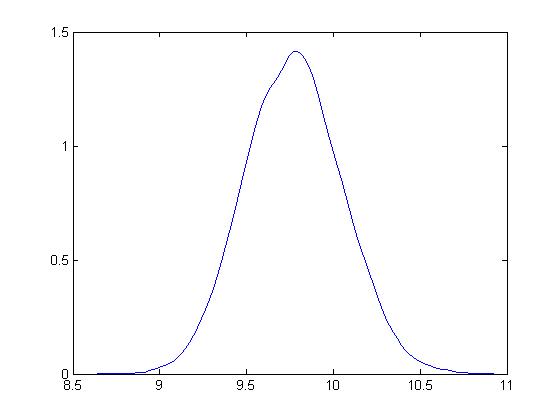
Here is the distribution of bootstrapped means of these samples.

bootstrapdist

The mean is 9.7713.

Based on the method of percentiles, the 95 percent confidence interval for the sample mean is between 9.32 and 10.23, which, as you note, correctly includes the true mean for the population of 10.

Bias-correction is another primary use of the bootstrap. For techies, there is a great paper from the old Bell Labs called A Real Example That Illustrates Properties of Bootstrap Bias Correction. Unfortunately, you have to pay a fee to the American Statistical Association to read it – I have not found a free copy on the Web.

In any case, all this is interesting and a little amazing, but what we really want to do is look at the bootstrap in developing forecasting models.

Bootstrapping Regressions

There are several methods for using bootstrapping in connection with regressions.

One is illustrated in a blog post from earlier this year. I treated the explanatory variables as variables which have a degree of randomness in them, and resampled the values of the dependent variable and explanatory variables 200 times, finding that doing so “brought up” the coefficient estimates, moving them closer to the underlying actuals used in constructing or simulating them.

This method works nicely with hetereoskedastic errors, as long as there is no autocorrelation.

Another method takes the explanatory variables as fixed, and resamples only the residuals of the regression.

Bootstrapping Time Series Models

The underlying assumptions for the standard bootstrap include independent and random draws.

This can be violated in time series when there are time dependencies.

Of course, it is necessary to transform a nonstationary time series to a stationary series to even consider bootstrapping.

But even with a time series that fluctuates around a constant mean, there can be autocorrelation.

So here is where the block bootstrap can come into play. Let me cite this study – conducted under the auspices of the Cowles Foundation (click on link) – which discusses the asymptotic properties of the block bootstrap and provides key references.

There are many variants, but the basic idea is to sample blocks of a time series, probably overlapping blocks. So if a time series yt  has n elements, y1,..,yn and the block length is m, there are n-m blocks, and it is necessary to use n/m of these blocks to construct another time series of length n. Issues arise when m is not a perfect divisor of n, and it is necessary to develop special rules for handling the final values of the simulated series in that case.

Block bootstrapping is used by Bergmeir, Hyndman, and Benıtez in bagging exponential smoothing forecasts.

How Good Are Bootstrapped Estimates?

Consistency in statistics or econometrics involves whether or not an estimate or measure converges to an unbiased value as sample size increases – or basically goes to infinity.

This is a huge question with bootstrapped statistics, and there are new findings all the time.

Interestingly, sometimes bootstrapped estimates can actually converge faster to the appropriate unbiased values than can be achieved simply by increasing sample size.

And some metrics really do not lend themselves to bootstrapping.

Also some samples are inappropriate for bootstrapping.  Gelman, for example, writes about the problem of “separation” in a sample

[In} ..an example of a poll from the 1964 U.S. presidential election campaign, … none of the black respondents in the sample supported the Republican candidate, Barry Goldwater… If zero black respondents in the sample supported Barry Goldwater, then zero black respondents in any bootstrap sample will support Goldwater as well. Indeed, bootstrapping can exacerbate separation by turning near-separation into complete separation for some samples. For example, consider a survey in which only one or two of the black respondents support the Republican candidate. The resulting logistic regression estimate will be noisy but it will be finite.

Here is a video doing a good job of covering the bases on boostrapping. I suggest sampling portions of it first. It’s quite good, but it may seem too much going into it.

Automatic Forecasting Programs – the Hyndman Forecast Package for R

I finally started learning R.

It’s a vector and matrix-based statistical programming language, a lot like MathWorks Matlab and GAUSS. The great thing is that it is free. I have friends and colleagues who swear by it, so it was on my to-do list.

The more immediate motivation, however, was my interest in Rob Hyndman’s automatic time series forecast package for R, described rather elegantly in an article in the Journal of Statistical Software.

This is worth looking over, even if you don’t have immediate access to R.

Hyndman and Exponential Smoothing

Hyndman, along with several others, put the final touches on a classification of exponential smoothing models, based on the state space approach. This facilitates establishing confidence intervals for exponential smoothing forecasts, for one thing, and provides further insight into the modeling options.

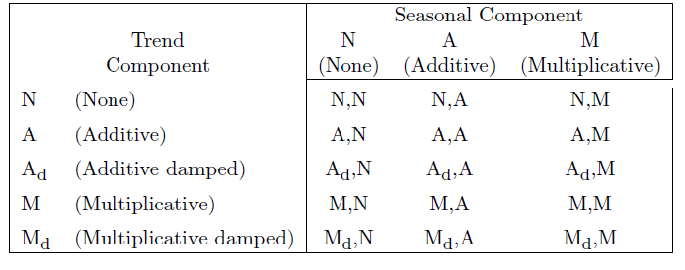
There are, for example, 15 widely acknowledged exponential smoothing methods, based on whether trend and seasonal components, if present, are additive or multiplicative, and also whether any trend is damped.

15expmethods

When either additive or multiplicative error processes are added to these models in a state space framewoprk, the number of modeling possibilities rises from 15 to 30.

One thing the Hyndman R Package does is run all the relevant models from this superset on any time series provided by the user, picking a recommended model for use in forecasting with the Aikaike information criterion.

Hyndman and Khandakar comment,

Forecast accuracy measures such as mean squared error (MSE) can be used for selecting a model for a given set of data, provided the errors are computed from data in a hold-out set and not from the same data as were used for model estimation. However, there are often too few out-of-sample errors to draw reliable conclusions. Consequently, a penalized method based on the in-sample  t is usually better.One such approach uses a penalized likelihood such as Akaike’s Information Criterion… We select the model that minimizes the AIC amongst all of the models that are appropriate for the data.

Interestingly,

The AIC also provides a method for selecting between the additive and multiplicative error models. The point forecasts from the two models are identical so that standard forecast accuracy measures such as the MSE or mean absolute percentage error (MAPE) are unable to select between the error types. The AIC is able to select between the error types because it is based on likelihood rather than one-step forecasts.

So the automatic forecasting algorithm, involves the following steps:

1. For each series, apply all models that are appropriate, optimizing the parameters (both smoothing parameters and the initial state variable) of the model in each case.

2. Select the best of the models according to the AIC.

3. Produce point forecasts using the best model (with optimized parameters) for as many steps ahead as required.

4. Obtain prediction intervals for the best model either using the analytical results of Hyndman et al. (2005b), or by simulating future sample paths..

This package also includes an automatic forecast module for ARIMA time series modeling.

One thing I like about Hyndman’s approach is his disclosure of methods. This, of course, is in contrast with leading competitors in the automatic forecasting market space –notably Forecast Pro and Autobox.

Certainly, go to Rob J Hyndman’s blog and website to look over the talk (with slides) Automatic time series forecasting. Hyndman’s blog, mentioned previously in the post on bagging time series, is a must-read for statisticians and data analysts.

Quick Implementation of the Hyndman R Package and a Test

But what about using this package?

Well, first you have to install R on your computer. This is pretty straight-forward, with the latest versions of the program available at the CRAN site. I downloaded it to a machine using Windows 8 as the OS. I downloaded both the 32 and 64-bit versions, just to cover my bases.

Then, it turns out that, when you launch R, a simple menu comes up with seven options, and a set of icons underneath. Below that there is the work area.

Go to the “Packages” menu option. Scroll down until you come on “forecast” and load that.

That’s the Hyndman Forecast Package for R.

So now you are ready to go, but, of course, you need to learn a little bit of R.

You can learn a lot by implementing code from the documentation for the Hyndman R package. The version corresponding to the R file that can currently be downloaded is at

http://cran.r-project.org/web/packages/forecast/forecast.pdf

Here are some general tutorials:

http://cran.r-project.org/doc/contrib/Verzani-SimpleR.pdf

http://cyclismo.org/tutorial/R/

http://cran.r-project.org/doc/manuals/R-intro.html#Simple-manipulations-numbers-and-vectors

http://www.statmethods.net/

And here is a discussion of how to import data into R and then convert it to a time series – which you will need to do for the Hyndman package.

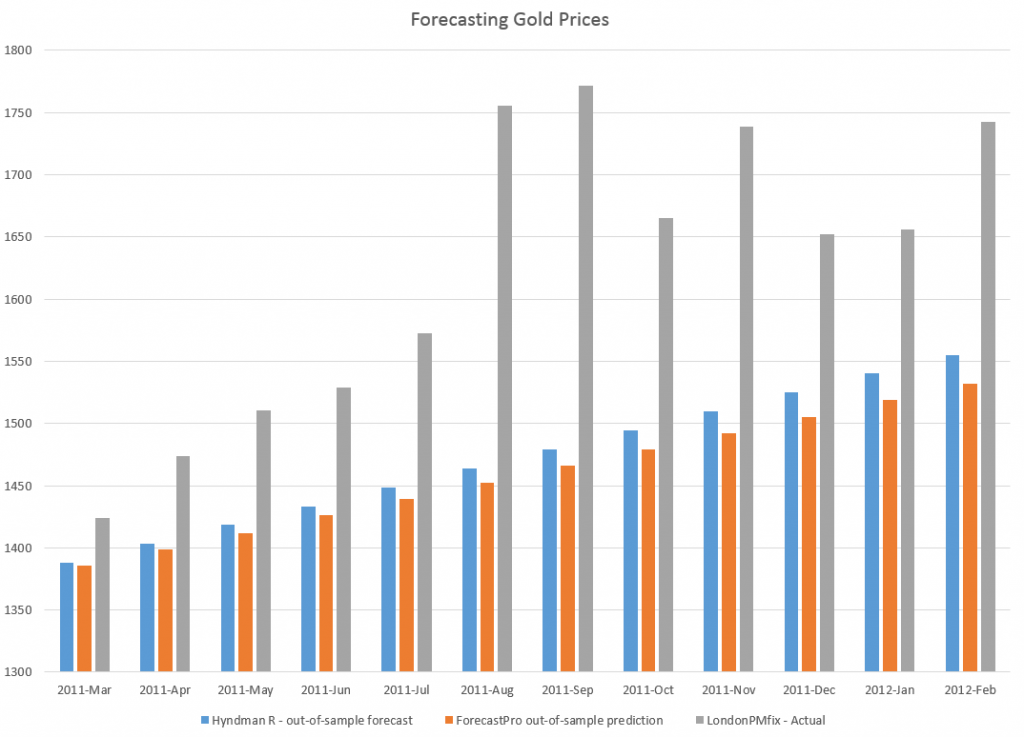
I used the exponential smoothing module to forecast monthly averages from London gold PM fix price series, comparing the results with a ForecastPro run. I utilized data from 2007 to February 2011 as a training sample, and produced forecasts for the next twelve months with both programs.

The Hyndman R package and exponential smoothing module outperformed Forecast Pro in this instance, as the following chart shows.

RFPcomp

Another positive about the R package is it is possible to write code to produce a whole number of such out-of-sample forecasts to get an idea of how the module works with a time series under different regimes, e.g. recession, business recovery.

I’m still caging together the knowledge to put programs like that together and appropriately save results.

But, my introduction to this automatic forecasting package and to R has been positive thus far.