Tag Archives: financial risk analysis

Portfolio Analysis

Greetings again. Took a deep dive into portfolio analysis for a colleague.

Portfolio analysis, of course, has been deeply influenced by Modern Portfolio Theory (MPT) and the work of Harry Markowitz and Robert Merton, to name a couple of the giants in this field.

Conventionally, investment risk is associated with the standard deviation of returns. So one might visualize the dispersion of actual returns for investments around expected returns, as in the following chart.

investmentrisk

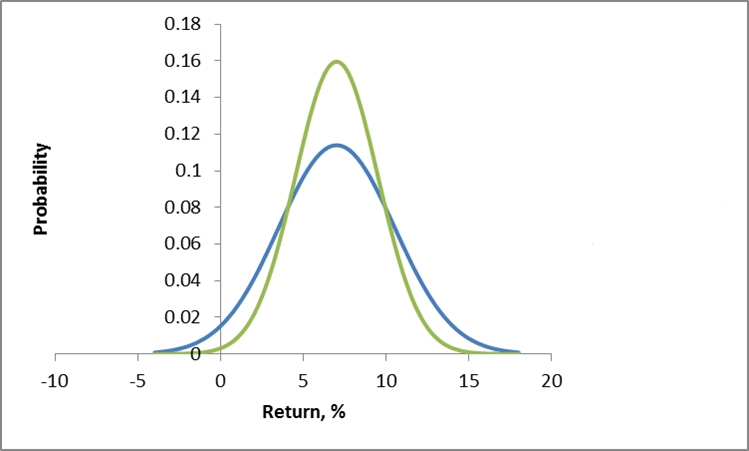
Here, two investments have the same expected rate of return, but different standard deviations. Viewed in isolation, the green curve indicates the safer investment.

More directly relevant for portfolios are curves depicting the distribution of typical returns for stocks and bonds, which can be portrayed as follows.

stocksbonds

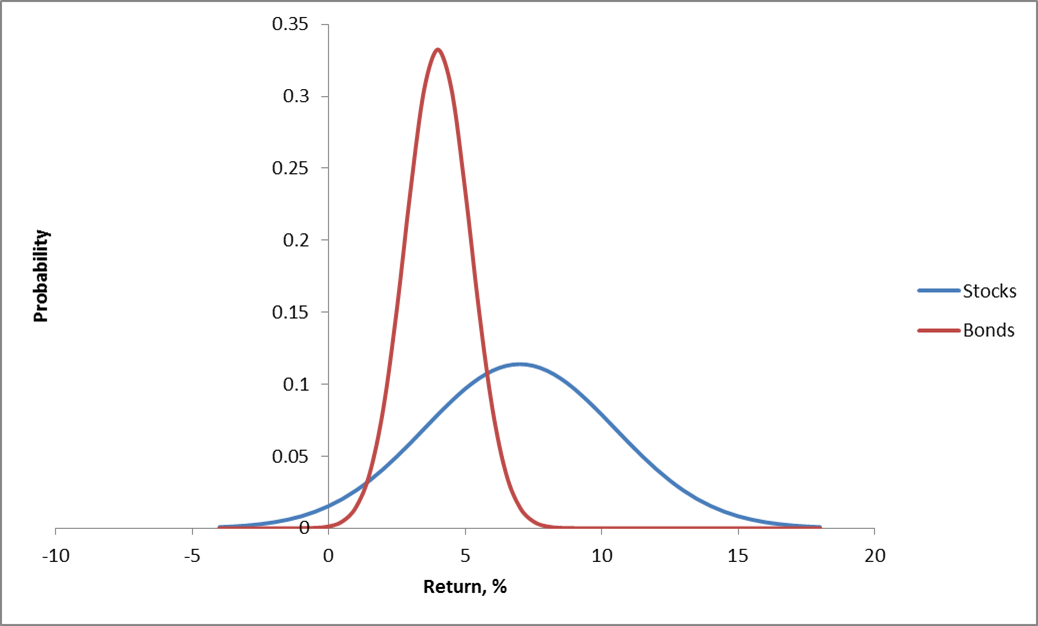
Now the classic portfolio is comprised of 60 percent stocks and 40 percent bonds.

Where would its expected return be? Well, the expected value of a sum of random variables is the sum of their expected values. There is an algebra of expectations to express this around the operator E(.). So we have E(.6S+.4B)=.6E(S)+.4E(B), since a constant multiplied into a random variable just shifts the expectation by that factor. Here, of course, S stands for “stocks” and B “bonds.”

Thus, the expected return for the classic 60/40 portfolio is less than the returns that could be expected from stocks alone.

But the benefit here is that the risks have been reduced, too.

Thus, the variance of the 60/40 portfolio usually is less than the variance of a portfolio composed strictly of stocks.

One of the ways this is true is when the correlation or covariation of stocks and bonds is negative, as it has been in many periods over the last century. Thus, high interest rates mean slow to negative economic growth, but can be associated with high returns on bonds.

Analytically, this is because the variance of the sum of two random variables is the sum of their variances, plus their covariance multiplied by a factor of 2.

Thus, algebra and probability facts underpin arguments for investment diversification. Pick investments which are not perfectly correlated in their reaction to events, and your chances of avoiding poor returns and disastrous losses can be improved.

Implementing MPF

When there are more than two assets, you need computational help to implement MPT portfolio allocations.

For a general discussion of developing optimal portfolios and the efficient frontier see http://faculty.washington.edu/ezivot/econ424/portfoliotheorymatrixslides.pdf

There are associated R programs and a guide to using Excel’s Solver with this University of Washington course.

Also see Package ‘Portfolio’.

These programs help you identify the minimum variance portfolio, based on a group of assets and histories of their returns. Also, it is possible to find the minimum variance combination from a designated group of assets which meet a target rate of return, if, in fact, that is feasible with the assets in question. You also can trace out the efficient frontier – combinations of assets mapped in a space of returns and variances. These assets in each case have expected returns on the curve and are minimum variance compared with all other combinations that generate that rate of return (from your designated group of assets).

One of the governing ideas is that this efficient frontier is something an individual investor might travel along as they age – going from higher risk portfolios when they are younger, to more secure, lower risk portfolios, as they age.

Issues

As someone who believes you don’t really know something until you can compute it, it interests me that there are computational issues with implementing MPT.

I find, for example, that the allocations are quite sensitive to small changes in expected returns, variances, and the underlying covariances.

One of the more intelligent, recent discussions with suggested “fixes” can be found in An Improved Estimation to Make Markowitz’s Portfolio Optimization Theory Users Friendly and Estimation Accurate with Application on the US Stock Market Investment.

The more fundamental issue, however, is that MPT appears to assume that stock returns are normally distributed, when everyone after Mandelbrot should know this is hardly the case.

Again, there is a vast literature, but a useful approach seems to be outlined in Modelling in the spirit of Markowitz portfolio theory in a non-Gaussian world. These authors use MPT algorithms as the start of a search for portfolios which minimize value-at-risk, instead of variances.

Finally, if you want to cool off and still stay on point, check out the 2014 Annual Report of Berkshire Hathaway, and, especially, the Chairman’s Letter. That’s Warren Buffett who has truly mastered an old American form which I believe used to be called “cracker barrel philosophy.” Good stuff.

Video Friday – Volatility

Here are a couple of short YouTube videos from Bionic Turtle on estimating a GARCH (generalized autoregressive conditional heteroskedasticity) model and the simpler exponentially weighted moving average (EWMA) model.

GARCH models are designed to capture the clustering of volatility illustrated in the preceding post.

Forecast volatility with GARCH(1,1)

The point is that the parameters of a GARCH model are estimated over historic data, so the model can be utilized prospectively, to forecast future volatility, usually in the near term.

EWMA models, insofar as they put more weight on recent values, than on values more distant back in time, also tend to capture clustering phenomena.

Here is a comparison.

EWMA versus GARCH(1,1) volatility

Several of the Bionic Turtle series on estimating financial metrics are worth checking out.

Predicting Financial Crisis – the Interesting Case of Nassim Taleb

Note: This is good post from the old series, and I am re-publishing it with the new citation to Taleb’s book in progress Hidden Risk and a new video.

———————————————–

One of the biggest questions is whether financial crises can be predicted in any real sense. This is a major concern of mine. I was deep in the middle of forecasting on an applied basis during 2008-2010, and kept hoping to find proxies to indicate, for example, when we were coming out of it, or whether it would “double-dip.”

Currently, as noted in this blog, a chorus of voices (commentators, analysts, experts) says that all manner of asset bubbles are forming globally, beginning with the US stock and the Chinese real estate markets.

But does that mean that we can predict the timing of this economic and financial crisis, or are we all becoming “Chicken Littles?”

What we want is well-described by Mark Buchanan, when he writes

The challenge for economists is to find those indicators that can provide regulators with reliable early warnings of trouble. It’s a complicated task. Can we construct measures of asset bubbles, or devise ways to identify “too big to fail” or “too interconnected to fail” institutions? Can we identify the architectural features of financial networks that make them prone to cascades of distress? Can we strike the right balance between the transparency needed to make risks evident, and the privacy required for markets to function?

And, ah yes – there is light at the end of the tunnel –

Work is racing ahead. In the U.S., the newly formed Office of Financial Research has published various papers on topics such as stress tests and data gaps — including one that reviews a list of some 31 proposed systemic-risk measures. The economists John Geanakoplos and Lasse Pedersen have offered specific proposals on measuring the extent to which markets are driven by leverage, which tends to make the whole system more fragile.

The Office of Financial Research (OFR) in the Treasury Department was created by the Dodd-Frank legislation, and it is precisely here Nassim Taleb enters the picture, at a Congressional hearing on formation of the OFR.

   untitled

Mr. Chairman, Ranking Member, Members of the Committee, thank you for giving me the opportunity to testify on the analytical ambitions and centralized risk-management plans of Office of Financial Research (OFR). I am here primarily as a practitioner of risk —not as an analyst but as a decision-maker, an eyewitness of the poor, even disastrous translation of risk research into practice. I spent close to two decades as a derivatives trader before becoming a full-time scholar and researcher in the areas of risk and probability, so I travelled the road between theory and practice in the opposite direction of what is commonly done. Even when I was in full-time practice I specialized in errors linked to theories, and the blindness from the theories of risk management. Allow me to present my conclusions upfront and in no uncertain terms: this measure, if I read it well, aims at the creation of an omniscient Soviet-style central risk manager. It makes us fall into the naive illusion of risk management that got us here —the same illusion has led in the past to the blind accumulation of Black Swan risks. Black Swans are these large, consequential, but unpredicted deviations in the eyes of a given observer —the observer does not see them coming, but, by some mental mechanism, thinks that he predicted them. Simply, there are limitations to our ability to measure the risks of extreme events and throwing government money on it will carry negative side effects. 1) Financial risks, particularly those known as Black Swan events cannot be measured in any possible quantitative and predictive manner; they can only be dealt with nonpredictive ways.  The system needs to be made robust organically, not through centralized risk management. I will keep repeating that predicting financial risks has only worked on computers so far (not in the real world) and there is no compelling reason for that to change—as a matter of fact such class of risks is becoming more unpredictable

A reviewer in the Harvard Business Review notes Taleb is a conservative with a small c. But this does not mean that he is a toady for the Koch brothers or other special interests. In fact, in this Congressional testimony, Taleb also recommends, as his point #3

..risks need to be handled by the entities themselves, in an organic way, paying for their mistakes as they go. It is far more effective to make bankers accountable for their mistakes than try the central risk manager version of Soviet-style central planner, putting hope ahead of empirical reality.

Taleb’s argument has a mathematical side. In an article in the International Journal of Forecasting appended to his testimony, he develops infographics to suggest that fat-tailed risks are intrinsically hard to evaluate. He also notes, correctly, that in 2008, despite manifest proof to the contrary, leading financial institutions often applied risk models based on the idea that outcomes followed a normal or Gaussian probability distribution. It’s easy to show that this is not the case for daily stock and other returns. The characteristic distributions exhibit excess kurtosis, and are hard to pin down in terms of specific distributions. As Taleb points out, the defining events that might tip the identification one way or another are rare. So mistakes are easy to make, and possibly have big effects.

But, Taleb’s extraordinary talent for exposition is on full view in an recent article How To Prevent Another Financial Crisis, coauthored with George Martin. The first paragraphs give us the conclusion,

We believe that “less is more” in complex systems—that simple heuristics and protocols are necessary for complex problems as elaborate rules often lead to “multiplicative branching” of side effects that cumulatively may have first order effects. So instead of relying on thousands of meandering pages of regulation, we should enforce a basic principle of “skin in the game” when it comes to financial oversight: “The captain goes down with the ship; every captain and every ship.” In other words, nobody should be in a position to have the upside without sharing the downside, particularly when others may be harmed. While this principle seems simple, we have moved away from it in the finance world, particularly when it comes to financial organizations that have been deemed “too big to fail.”

Then, the authors drive this point home with a salient reference –

The best risk-management rule was formulated nearly 4,000 years ago. Hammurabi’s code specifies: “If a builder builds a house for a man and does not make its construction firm, and the house which he has built collapses and causes the death of the owner of the house, that builder shall be put to death.” Clearly, the Babylonians understood that the builder will always know more about the risks than the client, and can hide fragilities and improve his profitability by cutting corners—in, say, the foundation. The builder can also fool the inspector (or the regulator). The person hiding risk has a large informational advantage over the one looking for it.

My hat’s off to Taleb. A brilliant example, and the rest of the article bears reading too.

While I have not thrown in the towel when it comes to devising metrics to signal financial crisis, I have to say that thoughts like Taleb’s probability argument occurred to me recently, when considering the arguments over extreme weather events.

Here’s a recent video.