Tag Archives: Global Business Forecasts

US Growth Stalls

The US Bureau of Economic Analysis (BEA) announced today that,

Real gross domestic product — the output of goods and services produced by labor and property located in the United States — increased at an annual rate of 0.1 percent in the first quarter (that is, from the fourth quarter of 2013 to the first quarter of 2014), according to the “advance” estimate released by the Bureau of Economic Analysis.  In the fourth quarter, real GDP increased 2.6 percent.

This flatline growth number is in stark contrast to the median forecast of 83 economists surveyed by Bloomberg, which called for a 1.2 percent increase for the first quarter.

Bloomberg writes in a confusingly titled report – Dow Hits Record as Fed Trims Stimulus as Economy Improves

The pullback in growth came as snow blanketed much of the eastern half of the country, keeping shoppers from stores, preventing builders from breaking ground and raising costs for companies including United Parcel Service Inc. Another report today showing a surge in regional manufacturing this month adds to data on retail sales, production and employment that signal a rebound is under way as temperatures warm.

Here’s is the BEA table of real GDP, along with the advanced estimates for the first quarter 2014 (click to enlarge).

usgdp

The large negative slump in investment in equipment (-5.5) indicates to me something more is going on than bad weather.

Indeed, Econbrowser notes that,

Both business fixed investment and new home construction fell in the quarter, which would be ominous developments if they’re repeated through the rest of this year. And a big drop in exports reminds us that America is not immune to weakness elsewhere in the world.

Even the 2% growth in consumption spending is not all that encouraging. As Bricklin Dwyer of BNP Paribas noted, 1.1% of that consumption growth– more than half– was attributed to higher household expenditures on health care.

What May Be Happening

I think there is some amount of “happy talk” about the US economy linked to the urgency about reducing Fed bond purchases. So just think of what might happen if the federal funds rate is still at the zero bound when another recession hits. What tools would the Fed have left? Somehow the Fed has to position itself rather quickly for the inevitable swing of the business cycle.

I have wondered, therefore, whether some of the pronouncements recently from the Fed did not have a unrealistic slant.

So, as the Fed unwinds quantitative easing (QE), dropping bond (mortgage-backed securities) purchases to zero, surely there will be further impacts on the housing markets.

Also, China is not there this time to take up the slack.

And it is always good to remember that new employment numbers are basically a lagging indicator of the business cycle.

Let’s hope for a better second and third quarter, and that this flatline growth for the first quarter is a blip.

Links – April 26, 2014

These Links help orient forecasting for companies and markets. I pay particular attention to IT developments. Climate change is another focus, since it is, as yet, not fully incorporated in most longer run strategic plans. Then, primary global markets, like China or the Eurozone, are important. I usually also include something on data science, predictive analytics methods, or developments in economics. Today, I include an amazing YouTube of an ape lighting a fire with matches.

China

Xinhua Insight: Property bubble will not wreck China’s economy

Information Technology (IT)

Thoughts on Amazon earnings for Q1 2014

Amazon

This chart perfectly captures Amazon’s current strategy: very high growth at 1% operating margins, with the low margins caused by massive investment in the infrastructure necessary to drive growth. It very much feels as though Amazon recognizes that there’s a limited window of opportunity for it to build the sort of scale and infrastructure necessary to dominate e-commerce before anyone else does, and it’s scraping by with minimal margins in order to capture as much as possible of that opportunity before it closes.

Apple just became the world’s biggest-dividend stock

Apple

The Disruptive Potential of Artificial Intelligence Applications Interesting discussion of vertical search, virtual assistants, and online product recommendations.

Hi-tech giants eschew corporate R&D, says report

..the days of these corporate “idea factories” are over according to a new study published by the American Institute of Physics (AIP). Entitled Physics Entrepreneurship and Innovation (PDF), the 308-page report argues that many large businesses are closing in-house research facilities and instead buying in new expertise and technologies by acquiring hi-tech start-ups.

Climate Change

Commodity Investors Brace for El Niño

Commodities investors are bracing themselves for the ever-growing possibility for the occurrence of a weather phenomenon known as El Niño by mid-year which threatens to play havoc with commodities markets ranging from cocoa to zinc.

The El Niño phenomenon, which tends to occur every 3-6 years, is associated with above-average water temperatures in the central and eastern Pacific and can, in its worst form, bring drought to West Africa (the world’s largest cocoa producing region), less rainfall to India during its vital Monsoon season and drier conditions for the cultivation of crops in Australia.

Economics

Researchers Tested The ‘Gambler’s Fallacy’ On Real-Life Gamblers And Stumbled Upon An Amazing Realization I love this stuff. I always think of my poker group.

..gamblers appear to be behaving as though they believe in the gambler’s fallacy, that winning or losing a bunch of bets in a row means that the next bet is more likely to go the other way. Their reactions to that belief — with winners taking safer bets under the assumption they’re going to lose and losers taking long-shot bets believing their luck is about to change — lead to the opposite effect of making the streaks longer

Foreign Affairs Focus on Books: Thomas Piketty on Economic Inequality


Is the U.S. Shale Boom Going Bust?

Among drilling critics and the press, contentious talk of a “shale bubble” and the threat of a sudden collapse of America’s oil and gas boom have been percolating for some time. While the most dire of these warnings are probably overstated, a host of geological and economic realities increasingly suggest that the party might not last as long as most Americans think.

Apes Can Definitely Use Tools

Bonobo Or Boy Scout? Great Ape Lights Fire, Roasts Marshmallows


The Interest Elasticity of Housing Demand

What we really want to know, in terms of real estate market projections, is the current or effective interest elasticity of home sales.

So, given that the US Federal Reserve has embarked on the “taper,” we know long term interest rates will rise (and have since the end of 2012).

What, then, is the likely impact of moving the 30 year fixed mortgage rate from around 4 percent back to its historic level of six percent or higher?

What is an Interest Elasticity?

Recall that the concept of a demand elasticity here is the percentage change in demand – this case housing sales, divided by the percentage change in the mortgage interest rate.

Typically, thus, the interest elasticity of housing demand is a negative number, indicating that higher interest rates result in lower housing demand, other things being equal.

This “other things being equal” (ceteris paribus) is the hooker, of course, as is suggested by the following chart from FRED.

30mortsale

Here the red line is the 30 year fixed mortgage rate (right vertical axis) and the blue line is housing sales (left vertical axis).

A Rough and Ready Interest Rate Elasticity

Now the thing that jumps out at you when you glance over these two curves is the way housing sales (the blue line) drops when the 30 year fixed mortgage rate went through the roof in about 1982, reaching a peak of nearly 20 percent.

After the rates came down again in about 1985, an approximately 20 year period of declining mortgage interest rates ensued – certainly with bobbles and blips in this trend.

Now suppose we take just the period 1975-85, and calculate a simple interest rate elasticity. This involves getting the raw numbers behind these lines on the chart, and taking log transformations of them. We calculate the regression,

interestelasticityregThis corresponds to the equation,

ln(sales)=   5.7   –   0.72*ln(r)

where the t-statistics of the constant term and coefficient of the log of the interest rate r are highly significant, statistically.

This equation implies that the interest elasticity of housing sales in this period is -0.72. So a 10 percent increase in the 30-year fixed mortgage rate is associated with an about 7 percent reduction in housing sales, other things being equal.

In the spirit of heroic generalization, let’s test this elasticity by looking at the reduction in the mortgage rate after 1985 to 2005, and compare this percent change with the change in the housing sales over this period.

So at the beginning of 1986, the mortgage rate was 10.8 and sales were running 55,000 per month. At the end of 2005, sales had risen to 87, 000 per month and the 30 year mortgage rate for December was 6.27.

So the mortgage interest rates fell by 53 percent and housing sales rose 45 percent – calculating these percentage changes over the average base of the interest rates and house sales. Applying a -0.72 price elasticity to the (negative) percent change in interest rates suggests an increase in housing sales of 38 percent.

That’s quite remarkable, considering other factors operative in this period, such as consistent population growth.

OK, so looking ahead, if the 30 year fixed mortgage rate rises 33 percent to around 6 percent, housing sales could be expected to drop around 20-25 percent.

Interestingly, recent research conducted at the Wharton School and the Board of Governors of the Federal Reserve suggests that,

The relationship between the mortgage interest rate and a household’s demand for mortgage debt has important implications for a host of public policy questions. In this paper, we use detailed data on over 2.7 million mortgages to provide novel estimates of the interest rate elasticity of mortgage demand. Our empirical strategy exploits a discrete jump in interest rates generated by the conforming loan limit|the maximum loan size eligible for securitization by Fannie Mae and Freddie Mac. This discontinuity creates a large notch” in the intertemporal budget constraint of prospective mortgage borrowers, allowing us to identify the causal link between interest rates and mortgage demand by measuring the extent to which loan amounts bunch at the conforming limit. Under our preferred specifications, we estimate that 1 percentage point increase in the rate on a 30-year fixed-rate mortgage reduces first mortgage demand by between 2 and 3 percent. We also present evidence that about one third of the response is driven by borrowers who take out second mortgages while leaving their total mortgage balance unchanged. Accounting for these borrowers suggests a reduction in total mortgage debt of between 1.5 and 2 percent per percentage point increase in the interest rate. Using these estimates, we predict the changes in mortgage demand implied by past and proposed future increases to the guarantee fees charged by Fannie and Freddie. We conclude that these increases would directly reduce the dollar volume of new mortgage originations by well under 1 percent.

So a 33 percent increase in the 30 year fixed mortgage rate, according to this analysis, would reduce mortgage demand by well under 33 percent. So how about 20-25 percent?

I offer this “take-off” as an example of an exploratory analysis. Thus, the elasticity estimate developed with data from the period of greatest change in rates provides a ballpark estimate of the change in sales over a longer period of downward trending interest rates. This supports a forward projection, which, at a first order approximation seem consistent with estimates from a completely different line of analysis.

All this suggests a more comprehensive analysis might be warranted, taking into account population growth, inflation, and, possibly, other factors.

The marvels of applied economics in a forecasting context.

Lead picture courtesy of the University of Maryland Department of Economics.

Inflation/Deflation-2

The following chart, courtesy of the Bank of Japan (BOJ), shows inflation and deflation dynamics in Japan since the 1980’s.

Japandeflation

There is interesting stuff in this chart, not the least of which is the counterintuitive surge in Japanese consumer prices in the Great Recession (2008 et passim).

Note, however, that the GDP deflator fell below zero in 1994, returning to positive territory only briefly around 2009. The other index in the chart – the DCGPI  –  is a Domestic Corporate Goods Price Index calculated by Japanese statistical agencies.

The Japanese experience with deflation is relevant to deflation dynamics in the Eurozone, and has been central to the thinking and commentary of US policymakers and macroeconomic/monetary theorists, such as Benjamin Bernanke.

The conventional wisdom explains inflation and deflation with the Phillips Curve. Thus, in one variant, inflation is projected to be a function of inflationary expectations, the output gap between potential and actual GDP, and other factors – decline in export prices, demographic changes, “unlucky” historical developments, or institutional issues in the financial sector.

It makes a big difference how you model inflationary expectations in this model, as John Williams points out in a Federal Reserve Bank of San Francisco Economic Letter.

If inflationary expectations are unanchored, a severe recession can lead to a deflationary spiral.

The logic is as follows: In the early stage of recession, the emergence of slack causes the inflation rate to dip. The resulting lower inflation rate prompts people to reduce their future inflation expectations. Continued economic slack causes the inflation rate to fall still further. If the recession is severe and long enough, this process eventually will cause prices to fall and then spiral lower and lower, resulting in ever-faster deflation rates. The deflation rate stabilizes only when slack is eliminated. And inflation turns positive again only after a sustained period of tight labor markets.

This contrasts with “well anchored” inflationary expectations, where people expect the monetary authorities will step in and end deflationary episodes at some point. In technical time series terms – inflation time series exhibit longer term returns to mean values and this acts as a magnet pulling prices up in some deflationary circumstances. Janet Yellen and her husband George Ackerlof have commented on this type of dynamic in inflationary expectations.

The Industrial Side of the Picture

The BOJ Working Paper responsible for the introductory chart also considers “other factors” in the Phillips Curve explanation, presenting a fascinating table.

JapanGDPdeflatiorbreakout

The huge drop in prices of electric machinery in Japan over 1990-2009 caught my attention.

The collapse in electric machinery prices represent changed conditions in export markets with cheaper and high quality electronics manufactured in China and other areas harboring contract electronics manufacturing.

Could this be a major contributor to persisting Japanese deflation, initially triggered obviously by massive drops in Japanese real estate in the earlyi 1990’s?

An interesting paper by Haruhiko Murayama of the Kyoto Research Institute – Reality and Cause of Deflation in Japan – makes a persuasive case for just that conclusion.

Murayama argues competition from China and other lower wage electronics producers is a major factor in continuing Japanese deflation.

The greatest cause of the deflation is a lack of demand, which in turn is attributable to the fact that emerging countries such as China, South Korea and Taiwan have come to manufacture inexpensive high-quality electrical products by introducing new equipment and by taking advantage of their cheap labor. While competing with emerging countries, Japanese electrical machinery makers have been forced to lower their export prices. In addition, an influx of foreign products has reduced their domestic sales, and as a result, overall earnings and demand in Japan have declined, leading to continuous price drops.

He goes on to say that,

..Japan is the only developed country whose electric machinery makers have been struggling because of the onslaught of competition from emerging countries. General Electric of the United States, which is known as a company founded by Thomas Edison and which was previously the largest electric machinery maker in the world, has already shifted its focus to the aircraft and nuclear industries, after facing intense competition with Japanese manufacturers. Other U.S. companies such as RCA (Radio Corporation of America), Motorola and Zenith no longer exist for reasons such as because they failed or were acquired by Japanese companies. The situation is similar in Europe. Consequently, whereas electric machinery accounts for as much as 19.5% of Japan’s nominal exports, equivalent products in the United States (computers and peripherals) take up only 2.3% of the overall U.S. exports (in the October-December quarter of 2012)

This explanation corresponds more directly to my personal observation with contract electronics manufacturing and, earlier, US-based electronics manufacturing. And it seems to apply relatively well for Europe – where Chinese competition in broadening areas of production pressure many European companies – creating a sort of vacuum for future employment and economic growth.

The Kyoto analysis also gets the policy prescription about right –

..the deflation in Japan is much more pervasive than is indicated by the CPI and its cause is a steep drop in export prices of electrical machinery, the main export item for the country, which has been triggered by the increasing competition from emerging countries and which makes it impossible to offset the effects of a rise in import prices by raising export prices. The onslaught of competition from emerging countries is unlikely to wane in the future. Rather, we must accept it as inevitable that emerging countries will continue to rise one after another and attempt to overtake countries that have so far enjoyed economic prosperity.

If so, what is most important is that companies facing the competition from emerging countries recognize that point and try to create high-value products that will be favored by foreign customers. It is also urgently necessary to save energy and develop new energy sources.

Moreover, companies which have not been directly affected by the rise of emerging countries should also take action on the assumption that demand will remain stagnant and deflation will continue in Japan until the electrical machinery industry recovers [or, I would add, until alternative production centers emerges]. They should tackle fundamental challenges with a sense of crisis, including how to provide products and services that precisely meet users’ needs, expand sales channels from the global perspective and exert creativity. Policymakers must develop a price index that more accurately reflects the actual price trend and take appropriate measures in light of the abovementioned challenges.

Maybe in a way that’s what Big Data is all about.

Interest Rates – Forecasting and Hedging

A lot relating to forecasting interest rates is encoded in the original graph I put up, several posts ago, of two major interest rate series – the federal funds and the prime rates.

IratesFRED1

This chart illustrates key features of interest rate series and signals several important questions. Thus, there is relationship between a very short term rate and a longer term interest rates – a sort of two point yield curve. Almost always, the federal funds rate is below the prime rate. If for short periods this is not the case, it indicates a radical reversion of the typical slope of the yield curve.

Credit spreads are not illustrated in this figure, but have been shown to be significant in forecasting key macroeconomic variables.

The shape of the yield curve itself can be brought into play in forecasting future rates, as can typical spreads between interest rates.

But the bottom line is that interest rates cannot be forecast with much accuracy beyond about a two quarter forecast horizon.

There is quite a bit of research showing this to be true, including –

Professional Forecasts of Interest Rates and Exchange Rates: Evidence from the Wall Street Journal’s Panel of Economists

We use individual economists’ 6-month-ahead forecasts of interest rates and exchange rates from the Wall Street Journal’s survey to test for forecast unbiasedness, accuracy, and heterogeneity. We find that a majority of economists produced unbiased forecasts but that none predicted directions of changes more accurately than chance. We find that the forecast accuracy of most of the economists is statistically indistinguishable from that of the random walk model when forecasting the Treasury bill rate but that the forecast accuracy is significantly worse for many of the forecasters for predictions of the Treasury bond rate and the exchange rate. Regressions involving deviations in economists’ forecasts from forecast averages produced evidence of systematic heterogeneity across economists, including evidence that independent economists make more radical forecasts

Then, there is research from the London School of Economics Interest Rate Forecasts: A Pathology

In this paper we have demonstrated that, in the two countries and short data periods studied, the forecasts of interest rates had little or no informational value when the horizon exceeded two quarters (six months), though they were good in the next quarter and reasonable in the second quarter out. Moreover, all the forecasts were ex post and, systematically, inefficient, underestimating (overestimating) future outturns during up (down) cycle phases. The main reason for this is that forecasters cannot predict the timing of cyclical turning points, and hence predict future developments as a convex combination of autoregressive momentum and a reversion to equilibrium

Also, the Chapter in the Handbook of Forecasting Forecasting interest rates is relevant, although highly theoretical.

Hedging Interest Rate Risk

As if in validation of this basic finding – beyond about two quarters, interest rate forecasts generally do not beat a random walk forecast – interest rate swaps, are the largest category of interest rate contracts of derivatives, according to the Bank of International Settlements (BIS).

BIStable

Not only that, but interest rate contracts generally are, by an order of magnitude, the largest category of OTC derivatives – totaling more than a half a quadrillion dollars as of the BIS survey in July 2013.

The gross value of these contracts was only somewhat less than the Gross Domestic Product (GDP) of the US.

A Bank of International Settlements background document defines “gross market values” as follows;

Gross positive and negative market values: Gross market values are defined as the sums of the absolute values of all open contracts with either positive or negative replacement values evaluated at market prices prevailing on the reporting date. Thus, the gross positive market value of a dealer’s outstanding contracts is the sum of the replacement values of all contracts that are in a current gain position to the reporter at current market prices (and therefore, if they were settled immediately, would represent claims on counterparties). The gross negative market value is the sum of the values of all contracts that have a negative value on the reporting date (ie those that are in a current loss position and therefore, if they were settled immediately, would represent liabilities of the dealer to its counterparties).  The term “gross” indicates that contracts with positive and negative replacement values with the same counterparty are not netted. Nor are the sums of positive and negative contract values within a market risk category such as foreign exchange contracts, interest rate contracts, equities and commodities set off against one another. As stated above, gross market values supply information about the potential scale of market risk in derivatives transactions. Furthermore, gross market value at current market prices provides a measure of economic significance that is readily comparable across markets and products.

Clearly, by any account, large sums of money and considerable exposure are tied up in interest rate contracts in the over the counter (OTC) market.

A Final Thought

This link between forecastability and financial derivatives is interesting. There is no question but that, in practical terms, business is putting eggs in the basket of managing interest rate risk, as opposed to refining forecasts – which may not be possible beyond a certain point, in any case.

What is going to happen when the quantitative easing maneuvers of central banks around the world cease, as they must, and long term interest rates rise in a consistent fashion? That’s probably where to put the forecasting money.

Forecasting the Price of Gold – 1

I’m planning posts on forecasting the price of gold this week. This is an introductory post.

The Question of Price

What is the “price” of gold, or, rather, is there a single, integrated global gold market?

This is partly an anthropological question. Clearly in some locales, perhaps in rural India, people bring their gold jewelry to some local merchant or craftsman, and get widely varying prices. Presumably, though this merchant negotiates with a broker in a larger city of India, and trades at prices which converge to some global average. Very similar considerations apply to interest rates, which are significantly higher at pawnbrokers and so forth.

The World Gold Council uses the London PM fix, which at the time of this writing was $1,379 per troy ounce.

The Wikipedia article on gold fixing recounts the history of this twice daily price setting, dating back, with breaks for wars, to 1919.

One thing is clear, however. The “price of gold” varies with the currency unit in which it is stated. The World Gold Council, for example, supplies extensive historical data upon registering with them. Here is a chart of the monthly gold prices based on the PM or afternoon fix, dating back to 1970.

Goldprices

Another insight from this chart is that the price of gold may be correlated with the price of oil, which also ramped up at the end of the 1970’s and again in 2007, recovering quickly from the Great Recession in 2008-09 to surge up again by 2010-11.

But that gets ahead of our story.

The Supply and Demand for Gold

Here are two valuable tables on gold supply and demand fundamentals, based on World Gold Council sources, via an  An overview of global gold market and gold price forecasting. I’ve more to say about the forecasting model in that article, but the descriptive material is helpful (click to enlarge).

Tab1and2These tables give an idea of the main components of gold supply and demand over a several years recently.

Gold is an unusual commodity in that one of its primary demand components – jewelry – can contribute to the supply-side. Thus, gold is in some sense renewable and recyclable.

Table 1 above shows the annual supplies in this period in the last decade ran on the order of three to four thousand tonnes, where a tonne is 2,240 pounds and equal conveniently to 1000 kilograms.

Demand for jewelry is a good proportion of this annual supply, with demands by ETF’s or exchange traded funds rising rapidly in this period. The industrial and dental demand is an order of magnitude lower and steady.

One of the basic distinctions is between the monetary versus nonmonetary uses or demands for gold.

In total, central banks held about 30,000 tonnes of gold as reserves in 2008.

Another estimated 30,000 tonnes was held in inventory for industrial uses, with a whopping 100,000 tonnes being held as jewelry.

India and China constitute the largest single countries in terms of consumer holdings of gold, where it clearly functions as a store of value and hedge against uncertainty.

Gold Market Activity

In addition to actual purchases of gold, there are gold futures. The CME Group hosts a website with gold future listings. The site states,

Gold futures are hedging tools for commercial producers and users of gold. They also provide global gold price discovery and opportunities for portfolio diversification. In addition, they: Offer ongoing trading opportunities, since gold prices respond quickly to political and economic events, Serve as an alternative to investing in gold bullion, coins, and mining stocks

Some of these contracts are recorded at exchanges, but it seems the bulk of them are over-the-counter.

A study by the London Bullion Market Association estimates that 10.9bn ounces of gold, worth $15,200bn, changed hands in the first quarter of 2011 just in London’s markets. That’s 125 times the annual output of the world’s gold mines – and twice the quantity of gold that has ever been mined.

The Forecasting Problem

The forecasting problem for gold prices, accordingly, is complex. Extant series for gold prices do exist and underpin a lot of the market activity at central exchanges, but the total volume of contracts and gold exchanging hands is many times the actual physical quantity of the product. And there is a definite political dimension to gold pricing, because of the monetary uses of gold and the actions of central banks increasing and decreasing their reserves.

But the standard approaches to the forecasting problem are the same as can be witnessed in any number of other markets. These include the usual time series methods, focused around arima or autoregressive moving average models and multivariate regression models. More up-to-date tactics revolve around tests of cointegration of time series and VAR models. And, of course, one of the fundamental questions is whether gold prices in their many incarnations are best considered to be a random walk.

Forecasting Gold Prices – Goldman Sachs Hits One Out of the Park

March 25, 2009, Goldman Sachs’ Commodity and Strategy Research group published Global Economics Paper No 183: Forecasting Gold as a Commodity.

This offers a fascinating overview of supply and demand in global gold markets and an immediate prediction –

This “gold as a commodity” framework suggests that gold prices have strong support at and above current price levels should the current low real interest rate environment persist. Specifically, assuming real interest rates stay near current levels and the buying from gold-ETFs slows to last year’s pace, we would expect to see gold prices stay near $930/toz over the next six months, rising to $962/toz on a 12-month horizon.

The World Gold Council maintains an interactive graph of gold prices based on the London PM fix.

GoldpriceNow, of course, the real interest rate is an inflation-adjusted nominal interest rate. It’s usually estimated as a difference between some representative interest rate and relevant rate of inflation. Thus, the real interest rates in the Goldman Sachs report is really an extrapolation from extant data provided, for example, by the US Federal Reserve FRED database.

Gratis of Paul Krugman’s New York Times blog from last August, we have this time series for real interest rates –

realinterestrates

The graph shows that “real interest rates stay near current levels” (from spring 2009), putting the Goldman Sachs group authoring Report No 183 on record as producing one of the most successful longer term forecasts that you can find.

I’ve been collecting materials on forecasting systems for gold prices, and hope to visit that topic in coming posts here.

Geopolitical Outlook 2014

One service forecasting “staff” can provide executives and managers is a sort of list of global geopolitical risks. This is compelling only at certain times – and 2014 and maybe 2015 seem to be shaping up as one of these periods.

Just a theory, but, in my opinion, the sustained lackluster economic performance in the global economy, especially in Europe and also, by historic standards, the United States adds fuel to the fire of many conflicts. Conflict intensifies as people fight over an economic pie that is shrinking, or at least, not getting appreciably bigger, despite population growth and the arrival of new generations of young people on the scene.

Some Hotspots

Asia

First, the recent election in Thailand solved nothing, so far. The tally of results looks like it is going to take months – sustaining a kind of political vacuum after many violent protests. Economic growth is impacted, and the situation looks to be fluid.

But the big issue is whether China is going to experience significantly slower economic growth in 2014-2015, and perhaps some type of debt crisis.

For the first time, we are seeing municipal bond defaults and the run-on effects are not pretty.

The default on a bond payment by China’s Chaori Solar last week signalled a reassessment of credit risk in a market where even high-yielding debt had been seen as carrying an implicit state guarantee. On Tuesday, another solar company announced a second year of net losses, leading to a suspension of its stock and bonds on the Shanghai stock exchange and stoking fears that it, too, may default.

There are internal and external forces at work in the Chinese situation. It’s important to remember lackluster growth in Europe, one of China’s biggest customers, is bound to exert continuing downward pressure on Chinese economic growth.

Chinapic

Michael Pettis addresses some of these issues in his recent post Will emerging markets come back? Concluding that –

Emerging markets may well rebound strongly in the coming months, but any rebound will face the same ugly arithmetic. Ordinary households in too many countries have seen their share of total GDP plunge. Until it rebounds, the global imbalances will only remain in place, and without a global New Deal, the only alternative to weak demand will be soaring debt. Add to this continued political uncertainty, not just in the developing world but also in peripheral Europe, and it is clear that we should expect developing country woes only to get worse over the next two to three years.

Indonesia is experiencing persisting issues with the stability of its currency.

Europe

In general, economic growth in Europe is very slow, tapering to static and negative growth in key economies and the geographic periphery.

The European Commission, the executive arm of the European Union, on Tuesday forecast growth in the 28-county EU at 1.5 per cent this year and 2 per cent in 2015. But growth in the 18 euro zone countries, many of which are weighed down by high debt and lingering austerity, is forecast at only 1.2 per cent this year, up marginally from 1.1 per cent in the previous forecast, and 1.8 per cent next year.

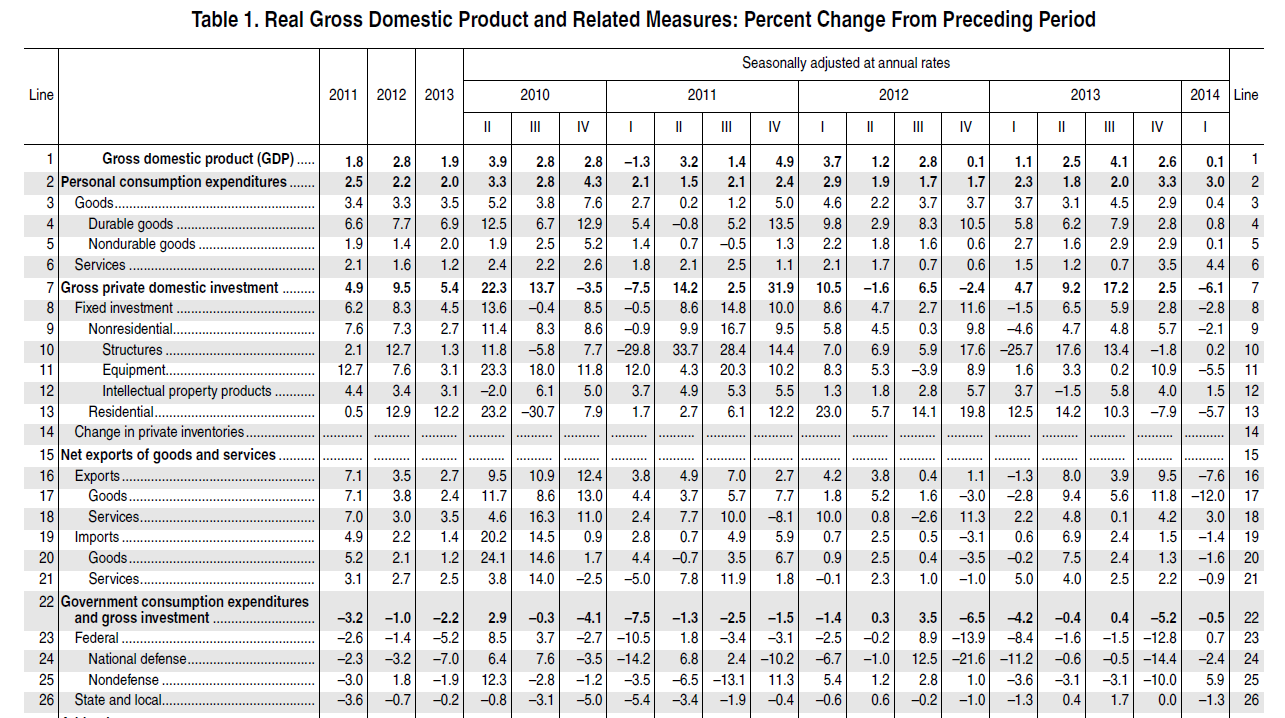
France avoided recession by posting 0.3 % GDP in the final quarter of calendar year 2013.

Since margin of error for real GDP forecasts is on the order of +/- 2 percent, current forecasts are, in many cases, indistinguishable from a prediction of another recession.

And what could cause such a wobble?

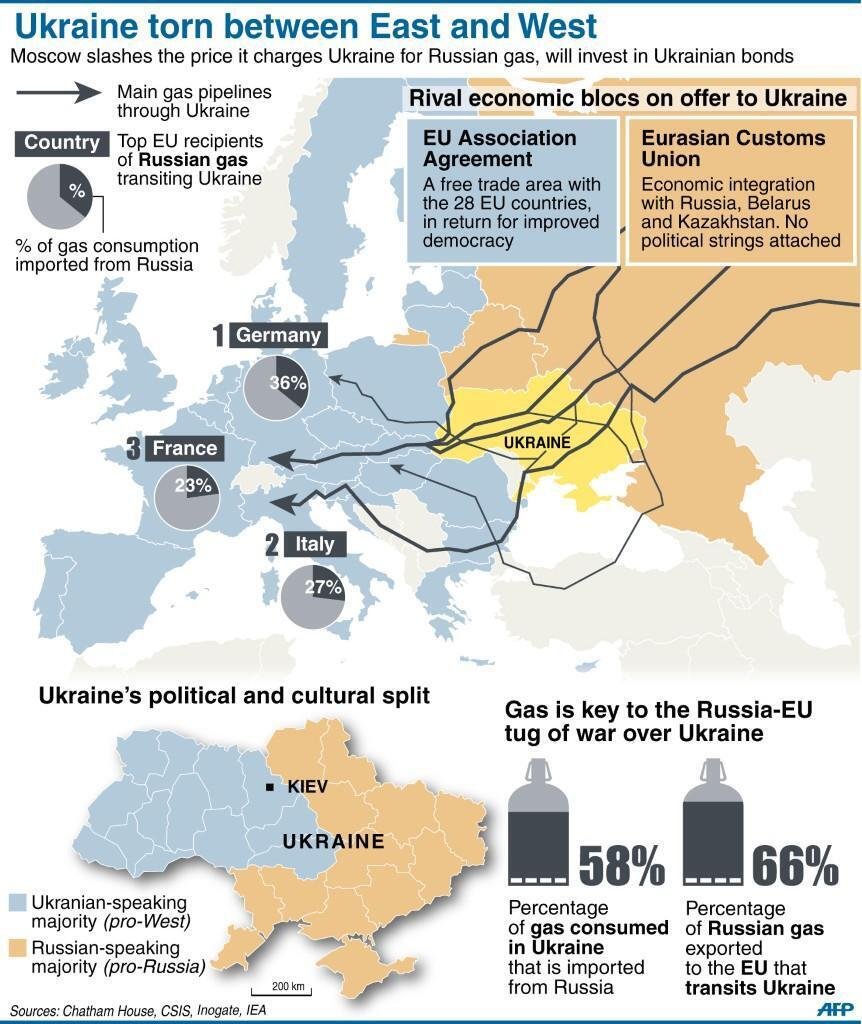
Well, possibly increases in natural gas prices, as a result of political conflict between Russia and the west, or perhaps the outbreak of civil war in various eastern European locales?

The Ukraine

The issue of the Ukraine is intensely ideological and politicized and hard to evaluate without devolving into propaganda.

The population of the Ukraine has been in radical decline. Between 1991 and 2011 the Ukrainian population decreased by 11.8%, from 51.6 million to 45.5 million, apparently the result of very low fertility rates and high death rates. Transparency International also rates the Ukraine 144th out of 177th in terms of corruption – with 177th being worst.

ukraine

“Market reforms” such as would come with an International Monetary Fund (IMF) loan package would probably cause further hardship in the industrialized eastern areas of the country.

Stratfor and other emphasize the role of certain “oligarchs” in the Ukraine, operating more or less behind the scenes. I take it these immensely rich individuals in many cases were the beneficiaries of privatization of former state enterprise assets.

The Middle East

Again, politics is supreme. Political alliances between Saudi Arabia and others seeking to overturn Assad in Syria create special conditions, for sure. The successive governments in Egypt, apparently returning to rule by a strongman, are one layer – another layer is the increasingly challenged economic condition in the country – where fuel subsidies are commonly doled out to many citizens. Israel, of course, is a focus of action and reaction, and under Netanyahu is more than ready to rattle the sword. After Iraq and Afghanistan, it seems always possible for conflict to break out in unexpected directions in this region of the world.

A situation seems to be evolving in Turkey, which I do not understand, but may be involved with corruption scandals and spillovers from conflicts not only Syria but also the Crimea.

The United States

A good part of the US TV viewing audience has watched part or all of House of Cards, the dark, intricate story of corruption and intrigue at the highest levels of the US Congress. This show reinforces the view, already widely prevalent, that US politicians are just interested in fund-raising and feathering their own nest, and that they operate more or less in callous disregard or clear antagonism to the welfare of the people at large.

HC

This is really too bad, in a way, since more than ever the US needs people to participate in the political process.

I wonder whether the consequence of this general loss of faith in the powers that be might fall naturally into the laps of more libertarian forces in US politics. State control and policies are so odious – how about trimming back the size of the central government significantly, including its ability to engage in foreign military and espionage escapades? Shades of Ron Paul and maybe his son, Senator Rand Paul of Kentucky. 

South and Central America

Brazil snagged the Summer 2016 Olympics and is rushing to construct an ambitious number of venues around that vast country.

While the United States was absorbed in wars in the Middle East, an indigenous, socialist movement emerged in South American – centered around Venezuela and perhaps Bolivia, or Chile and Argentina. At least in Venezuela, sustaining these left governments after the charismatic leader passes from the scene is proving difficult.

Africa

Observing the ground rule that this sort of inventory has to be fairly easy, in order to be convincing – it seems that conflict is the order of the day across Africa. At the same time, the continent is moving forward, experiencing economic development, dealing with AIDS. Perhaps the currency situation in South Africa is the biggest geopolitical risk.

Bottom Line

The most optimistic take is that the outlook and risks now define a sort of interim period, perhaps lasting several years, when the level of conflict will increase at various hotspots. The endpoint, hopefully, will be the emergence of new technologies and products, new industries, which will absorb everyone in more constructive growth – perhaps growth defined ecologically, rather than merely in counting objects.

Geopolitical Risk

USA Today has a headline today What Wall Street is watching in Ukraine crisis and a big red strip across the top of the page with Breaking News Russia issues surrender ultimatum to Ukrainian forces in Crimea.

But the article itself projects calming thoughts, such as,

History also shows that market shocks caused by war, terrorism and other fear-rattling events tend to be short-lived.

In 14 shocks dating back to the attack on Pearl Harbor in December 1941, the median one-day decline has been 2.4%. And the shocks, which also include the Sept. 11 terror attacks and the 1962 Cuban missile crisis, lasted just eight days, with total losses of 7.4%, data from S&P Capital IQ show. The market recouped its losses 14 days later.

Similarly, the Economist February 26 ran an article The return of geopolitical risk noting that,

If there is a consensus, it is probably that geopolitical risks have a tendency to go away. Think back over the last 24 years, going all the way back to the Kuwait crisis, and you will recall that markets sold off initially but recovered as the conflicts turned out either to be shorter, or less economically damaging, than they feared. Hence, while the markets have sold off today, the declines have hardly been substantial (between 0.8% and for the FTSE and 1.4% for the Dax at the time of writing).

Professional organizations in the geopolitical risk space offer to provide information to companies operating in risk-prone areas or with vital interests in, say, natural gas markets globally.

One of these is Stratfor, founded by George Friedman in 1996, with subscription services and reports for purchase by business and other organizations. For the interested, here is a friendly but critical review of Friedman’s supposedly best-selling The Next 100 Years: A Forecast for the 21st Century (2009). Friedman actually predicts the disintegration of Russia in the 2020’s, following a re-assertion of Russian power westward, toward Europe. Hmmm.

Currently, Stratfor is highlighting the potential for the emergence of extreme right-wing groups in the Ukraine. This is a similar focus to one developed in an excellent article in Le Monde Diplomatique Ukraine beyond politics.

I don’t want to comment too extensively on the US role in the Ukraine, or the inevitable saber-rattling and accusations that not enough is being done.

Rather, I think it’s important to look at one particular graphic, presented initially by Business Insider and extensively tweeted thereafter.

Ukrainegas

So from a purely predictive standpoint, it seems unlikely the United States can originate and see implemented significant economic sanctions against Russia – since then, clearly, Russia has the power to retaliate through its control of significant natural gas supplies for western Europe.

The risk – plunging western Europe back into recession, again threatening the US economic recovery.

Economic rationality may provide some constraints to wild responses and actions, but the low performance of many economies since 2009 creates a fertile environment for the emergence of hot-heads, demagogues, and madmen.

So, what I guess I worry about is that the general geopolitical dynamics seem to be moving into greater and greater vulnerability to some idiotic minor event which functions as a tipping point.

But then again, the markets may go forth to a new stabilization very shortly, and it will be business as usual, with more than a modicum of background noise from politics.

Links – February 28

Data Science and Predictive Analytics

Data Scientists Predict Oscar® Winners Again; Social Media May Love Leo, But Data Says “No”

..the data shows that Matthew McConaughey will win best actor for his role in the movie Dallas Buyers Guide; Alfonso Cuaron will win best director for the movie Gravity; and 12 Months a Slave will win the coveted prize for best picture – which is the closest among all the races. The awards will not be a clean sweep for any particular picture, although the other award winners are expected to be Jared Leto for best supporting actor in Dallas Buyers Club; Cate Blanchet for best actress in Blue Jasmine; and Lupita Nyong’o for best supporting actress in 12 Years a Slave.

10 Most Influential Analytics Leaders in India

Pankaj Kulshreshtha – Business Leader, Analytics & Research at Genpact

Rohit Tandon – Vice President, Strategy WW Head of HP Global Analytics

Sameer Dhanrajani – Business Leader, Cognizant Analytics

Srikanth Velamakanni – Co founder and Chief Executive Officer at Fractal Analytics

Pankaj Rai – Director, Global Analytics at Dell

Amit Khanna – Partner at KPMG

Ashish Singru – Director eBay India Analytics Center

Arnab Chakraborty – Managing Director, Analytics at Accenture Consulting

Anil Kaul – CEO and Co-founder at Absolutdata

Dr. N.R.Srinivasa Raghavan, Senior Vice President & Head of Analytics at Reliance Industries Limited

Interview with Jörg Kienitz, co-author with Daniel Wetterau of Financial Modelling: Theory, Implementation and Practice with MATLAB Source

JB: Why MATLAB? Was there a reason for choosing it in this context?

JK: Our attitude was that it was a nice environment for developing models because you do not have to concentrate on the side issues. For instance, if you want to calibrate a model you can really concentrate on implementing the model without having to think about the algorithms doing the optimisation for example. MATLAB offers a lot of optimisation routines which are really reliable and which are fast, which are tested and used by thousands of people in the industry. We thought it was a good idea to use standardised mathematical software, a programming language where all the mathematical functions like optimisation, like Fourier transform, random number generator and so on, are very reliable and robust. That way we could concentrate on the algorithms which are necessary to implement models, and not have to worry about a programming a random number generator or such stuff. That was the main idea, to work on a strong ground and build our house on a really nice foundation. So that was the idea of choosing MATLAB.

Knowledge-based programming: Wolfram releases first demo of new language, 30 years in the making


Economy

Credit Card Debt Threatens Turkey’s Economy – kind of like the subprime mortgage scene in the US before 2008.

..Standard & Poor’s warned in a report last week that the boom in consumer credit had become a serious risk for Turkish lenders. Slowing economic growth, political turmoil and increasing reluctance by foreign investors to provide financing “are prompting a deterioration in the operating environment for Turkish banks,”

A shadow banking map from the New York Fed. Go here and zoom in for detail.

China Sees Expansion Outweighing Yuan, Shadow Bank Risk

China’s Finance Minister Lou Jiwei played down yuan declines and the risks from shadow banking as central bank Governor Zhou Xiaochuan signaled that the nation’s economy can sustain growth of between 7 percent and 8 percent.

Outer Space

715 New Planets Found (You Read That Number Right)

Speaks for itself. That’s a lot of new planets. One of the older discoveries – Tau Boötis b – has been shown to have water vapor in its atmosphere.

Hillary, ‘The Family,’ and Uganda’s Anti-Gay Christian Mafia

GayBashers

I heard about this at the SunDance film gathering in 2013. Apparently, there are links between US and Ugandan groups in promulgating this horrific law.

An Astronaut’s View of the North Korean Electricity Black Hole

NorthKorea