Tag Archives: weather forecasting

Forecasting Controversy – the Polar Vortex

Three short, amusing videos to watch while keeping warm as the snow falls in Las Vegas and most other places are plunged into subzero weather.

The Polar Vortex Explained in 2 Minutes from the White House.

This video clip, originally distributed through the Office of Science and Technology Policy, kicked off the controversy.

Rush Limbaugh Response

Rush Limbaugh, always a reliable source on science and general systems theory, says the polar vortex was invented by liberal conspirators to scare folks.

Limbaugh is Full of Hot Air

Weatherman Al Roker fired back at Limbaugh’s ‘Polar Vortex’ Conspiracy, showing a page from his meteorology textbook from way back when, defining the term,”polar vortex.”

But can the Polar Vortex – recognized as a real weather phenomenon for decades – be forecast and is it related to climate change?

Well, this year there was an interesting split between weather forecasting services. As an article reacting to the October 16 release of the NWS Long Range Forecast notes .. the commercial forecasters are telling us to brace for the return of the Arctic air in the U.S. while the federal forecasters have countered by saying another wavy vortex dipping far south is “unlikely.”

Thus, we had NOAA: Another warm winter likely for western U.S., South may see colder weather           .

Well, the National Weather Service and its Canadian counterpart missed the big cold snap in November and the current incursion of artic air to lower lattitudes, due to shifting of the polar vortex.

Accuweather and the Weather Channel, on the other hand, scored big on their forecasts.

At the same time, Internet studies do not show that Accuweather has any leg up in long range forecasting –  snow in New York, for example – beyond a few days from the release of the forecast.

Also, the scientific basis for linking climate change and these polar vortex events is tenuous, or at least multi-factor.

Thus, a recent article in Nature – Weakening of the stratospheric polar vortex by Arctic sea-ice loss – concludes [footnote numbers removed] –

Through a combination of observation-based data analysis and climate model experiments, we provide corroborative evidence for the notion that Arctic sea-ice loss over the B–K seas plays an important role in weakening the stratospheric polar vortex. Regional sea-ice reductions over the B–K seas cause not only in situ surface warming but also significant upper-level responses that exhibit positive geopotential height anomalies over Eastern Europe and negative anomalies from East Asia to the Eastern Pacific along the wave-guide of the tropospheric westerly jet. This anomaly pattern projects heavily into the climatological wave, intensifying the vertical propagation of planetary-scale wave into the stratosphere and, in turn, weakening the stratospheric polar vortex. Therefore, planetary-scale wave generation by sea-ice losses and its upward propagation during early winter months underline the link between surface climate variability and polar stratospheric variability.

The weakened stratospheric polar vortex is often followed by a negative phase of the AO at the surface, favoring cold surface temperatures across Northern Hemisphere continents during the late winter months (Supplementary Fig. 1). Several physical mechanisms for this downward coupling have been proposed. They include the balanced response of the troposphere to stratospheric potential vorticity anomalies and wave-driven changes in the meridional circulation. It is also suggested that the tropospheric response involves changes in the synoptic eddies. However, it has been difficult to isolate the key process, and the detailed nonlinear processes involved are still under investigation21

As a final remark, we note that Arctic sea-ice loss represents only one of the possible factors that can affect the stratospheric polar vortex. Other factors reported in previous works include Eurasian snow cover, the Quasi Biannual Oscillation, the El-Nino and Southern Oscillation and solar activity.

I think it’s probably possible to show – through psychological and historical studies – that human decision-making over risky alternatives is most likely to fail with respect to (a) collective choices over (b) complex outcomes where target events have relatively low probability, although possibly huge costs. This makes the climate change issue and responding appropriately to it hugely difficult.

Top image from Medical Daily

Climate Change by 2030

Is climate change real? Is it predictable? How much warming can we expect by 2020 and then by 2030 in a business as usual scenario? How bad can it get? What about mitigation? Is there any credibility to the loud protestations of the climate change deniers? What about the so-called hockey stick and the exchange of sinister emails?

The Fifth Assessment Report of the Intergovernmental Panel on Climate Change (IPCC) addresses some of these questions. Its section The Physical Science Basis, which collates contributions of 250 scientists, contains this interesting graphic (click to enlarge) showing the upward trend in global temperature and the importance of the anthropogenic component, along with contributions from fluctuations in solar intensity and volcanic activity.

IPCCtemp

The Hockey Stick

Paleoclimate studies, also documented in this report, are the basis for the famous (notorious) hockey stick chart of long term global temperatures.

I was surprised to read, in catching up on this controversy, that the climate scientist Michael Mann who originated this chart has been totally vindicated (See The Hockey Stick: The Most Controversial Chart in Science, Explained).

Currently, scientific evidence suggests,

… present-day (2011) concentrations of the atmospheric greenhouse gases (GHGs) carbon dioxide (CO2), methane (CH4) and nitrous oxide (N2O) exceed the range of concentrations recorded in ice cores during the past 800,000 years. Past changes in atmospheric GHG concentrations can be determined with very high confidence1 from polar ice cores. Since AR4 these records have been extended from 650,000 years to 800,000 years ago.

The Drumbeat

In preparation for a September 23 summit, the UN has commissioned videos of weather forecasters supposedly announcing dire droughts, floods, and other weather catastrophes in 2050.

The IPCC also has videos. I include two – one on the physical science basis and the second on mitigation.

IPCC video 2013 –The Physical Science Basis

Climate summit 2014 – Mitigation

I personally am persuaded by the basic physics involved. As global GDP rises, so will energy consumption (although the details of this need to be examined carefully – conservation and change of technology can make big differences). In any case, more carbon dioxide and other similar gases will increase the greenhouse effect, raising global temperatures. It’s a good idea to call this climate change, rather than global warming, however, since volatility of weather patterns is a main result. There will be more climatic extremes, more droughts, but also more precipitation and flooding. Additionally, there could be changes in regional weather and climate patterns which could wreak havoc with the current distribution of population over geographic space. More rapid desertification is likely, and, of course, melting of glacial and polar ice will result in increases in sea level. And, as IPCC reports document, a lot of this is already happening.

There are, however, several problems that offer intellectual grounds for stalling the type of economic sacrifice that probably will be necessary to slow or reduce emissions.

First, there is the complexity of the evidence and argument, an issue flagged by Nate Silver recently. Secondly, there is the problem that, despite increases in greenhouse gas emissions after the turn of the century, there has been some leveling of global temperature increase, according to some metrics. Finally, there is the related problem of whether current climate models predict the recent past, whether they “retrodict.”

I’d like to address these issues or problems in a future post, along with my take on these projections or forecasts for 2020 and 2030.

Forecasting – Climate Change and Infrastructure

You really have to become something like a social philosopher to enter the climate change and infrastructure discussion. I mean this several ways.

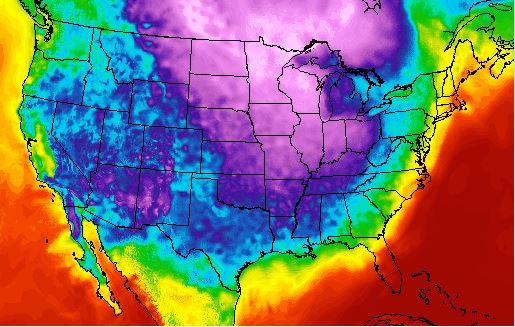
Of course, there is first the continuing issue of whether or not climate change is real, or is currently being reversed by a “pause” due to the oceans or changes in trade winds absorbing some of the increase in temperatures. So for purposes of discussion, I’m going to assume that climate change is real, and with a new El Niño this year global temperatures and a whole panoply of related weather phenomena – like major hurricanes – will come back in spades.

But then can we do anything about it? Is it possible for a developed or “mature” society to plan for an uncertain, but increasingly likely future? With this question come visions of the amazingly dysfunctional US Congress, mordantly satirized in the US TV show House of Cards.

The National Society of Professional Engineers points out that major infrastructure bills relating to funding the US highway system and water systems are coming up in Congress in 2014.

Desperately needed long-term infrastructure projects were deferred to address other national priorities or simply fell victim to the ongoing budget crisis. In fact, federal lawmakers extended the surface transportation authorization an unprecedented 10 times between 2005 and 2012, when Congress finally authorized the two-year Moving Ahead for Progress in the 21st Century Act (MAP-21). Now, with MAP-21 set to expire before the end of 2014, two of the most significant pieces of infrastructure legislation are taking center stage in Congress. The Water Resources Reform and Development Act (WRRDA) and the reauthorization of the surface transportation bill present a rare opportunity for Congress to set long-term priorities and provide needed investment in our nation’s infrastructure. Collectively, these two bills cover much, though not all, of US infrastructure. The question then becomes, can Congress overcome continuing partisan gridlock and a decades-long pattern of short-term fixes to make a meaningful commitment to the long-term needs of US infrastructure?

Yes, for sure, that is the question.

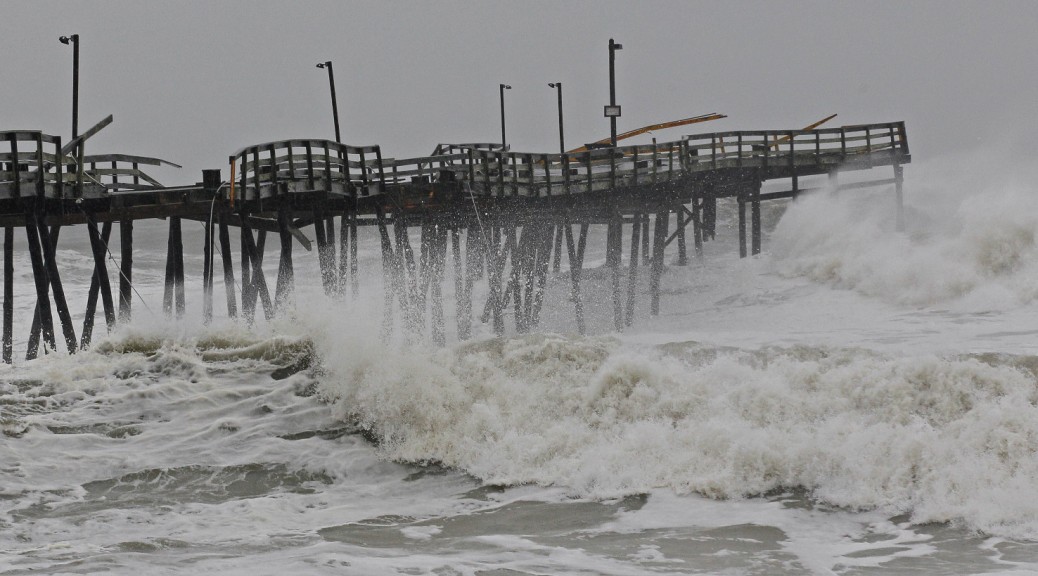
Hurricane Sandy – really by the time it hit New Jersey and New York a fierce tropical storm – wreaked havoc on Far Rockaway, flooding the New York City subway system in 2012. This gave rise to talk of sea walls after the event.  And I assume something like that is in the planning stages on drawing boards somewhere on the East Coast. But the cost of “ten story tall pilings” on which would be hinged giant gates is on the order of billions of US dollars.

California

I notice interesting writing coming out of California, pertaining to the smart grid and the need to extend this concept from electricity to water.

The California Energy Commission (CEC) publishes an Integrated Energy Policy Report (IEPR – pronounced eye-per) every two years, and the 2013 IEPR was just approved ..Let’s look at two climate change impacts – temperature and precipitation.  From a temperature perspective, the IEPR anticipates that as the thermometer rises, so does the demand for electricity to run AC.  San Francisco Peninsula communities that never had a need for AC will install a couple million units to deal with summer temperatures formerly confined to the Central Valley.  PG&E and municipal utilities in Northern California will notice impacts in seasonal demand for electricity in both the duration of heat waves and peak apexes during the hottest times of day.  In the southern part of the state, the demand will also grow as AC units work harder to offset hotter days. At the same time, increased temperatures decrease power plant efficiencies, whether the plant generates electricity from natural gas, solar thermal, nuclear, or geothermal.  Their cooling processes are also negatively impacted by heat waves.  Increased temperatures also impact transmission lines – reducing their efficiency and creating line sags that can trigger service disruptions. Then there’s precipitation.  Governor Jerry Brown just announced a drought emergency for the state.  A significant portion of California’s water storage system relies on the Sierra Mountains snowpack, which is frighteningly low this winter.  This snowpack supplies most of the water sourced within the state, and hydropower derived from it supplies about 15% of the state’s homegrown electricity.  A hotter climate means snowfall becomes rainfall, and it is no longer freely stored as snow that obligingly melts as temperatures rise.  It may not be as reliably scheduled for generation of hydro power as snowfalls shift to rainfalls. We may also receive less precipitation as a result of climate change – that’s a big unknown right now.  One thing is certain.  A hotter climate will require more water for agriculture – a $45 billion economy in California – to sustain crops.  And whether it is water for industrial, commercial, agricultural, or residential uses, what doesn’t fall from the skies will require electricity to pump it, transport it, desalinate it, or treat it.

Boom – A Journal of California packs more punch in discussing the “worst case”

“The choice before us is not to stop climate change,” says Jonathan Parfrey, executive director of Climate Resolve in Los Angeles. “That ship has sailed. There’s no going back. There will be impacts. The choice that’s before humanity is how bad are we going to do it to ourselves?”

So what will it be? Do you want the good news or the bad news first?

The bad news. OK.

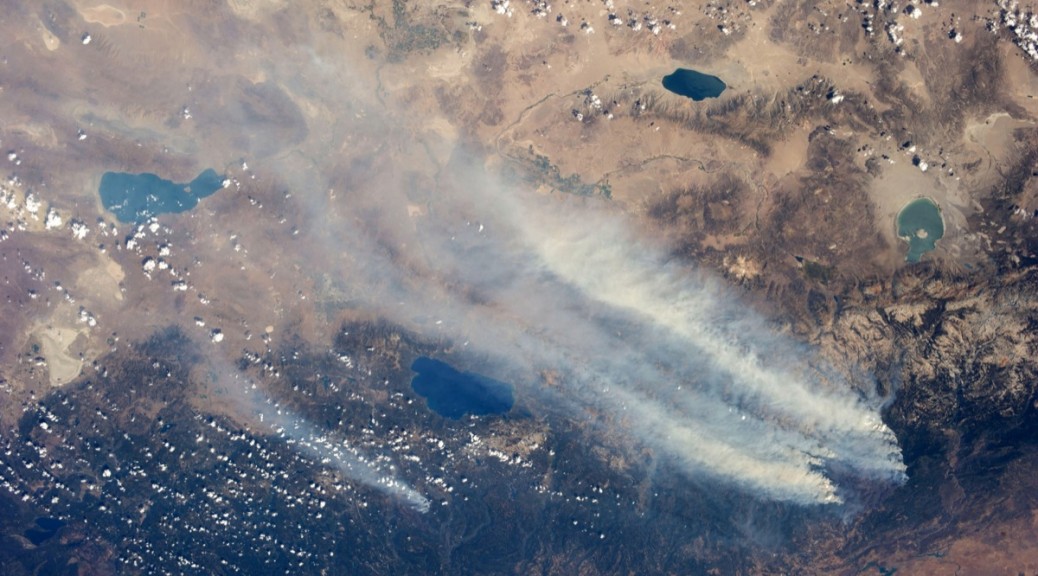
If we choose to do nothing, the nightmare scenario plays out something like this: amid prolonged drought conditions, wildfires continuously burn across a dust-dry landscape, while potable water has become such a precious commodity that watering plants is a luxury only residents of elite, gated communities can afford. Decimated by fires, the power grid infrastructure that once distributed electricity—towers and wires—now loom as ghostly relics stripped of function. Along the coast, sea level rise has decimated beachfront properties while flooding from frequent superstorms has transformed underground systems, such as Bay Area Rapid Transit (BART), into an unintended, unmanaged sewer system..

This article goes on to the “good news” which projects a wave of innovations and green technology by 2050 to 2075 in California.

Sea Level Rise

Noone knows, at this point, the extent of the rise in sea level in coming years, and interestingly, I never seen a climate change denier also, in the same breath, deny that sea levels have been rising historically.

There are interesting resources on sea level rise, although projections of how much rise over what period are uncertain, because no one knows whether a big ice mass, such as parts of the Antarctic ice shelf are going to melt on an accelerated schedule sometime soon.

An excellent scientific summary of the sea level situation historically can be found in Understanding global sea levels: past, present and future.

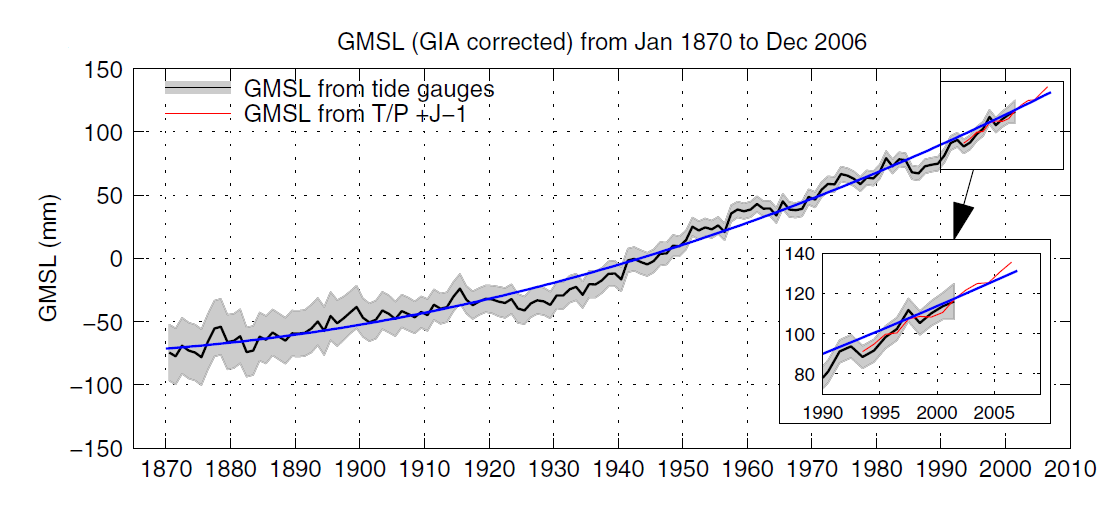
Here is an overall graph of Global Mean Sea Level –

GMSL

This inexorable trend has given rise to map resources which suggest coastal areas which would be underwater or adversely affected in the future by sea surges.

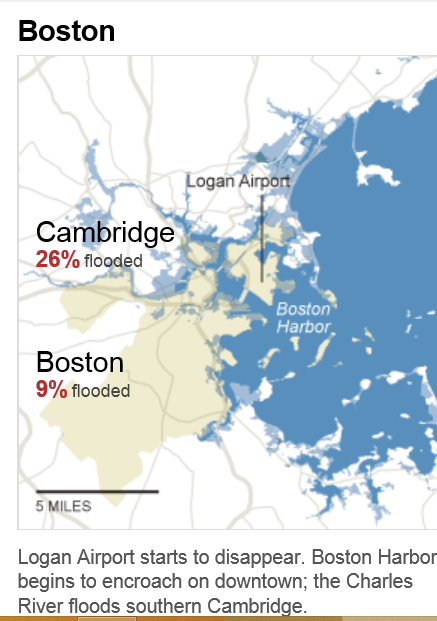
The New York Times’ interactive What Could Disappear suggests Boston might look like this, with a five foot rise in sea level expected by 2100

Boston

The problem, of course, is that globally populations are concentrated in coastal areas.

Also, storm surges are nonlinearly related to sea level. Thus, a one (1) foot rise in sea level could be linked with significantly more than 1 foot increases in the height of storm surges.

Longer Term Forecasts

Some years back, an interesting controversy arose over present value discounting in calculating impacts of climate change.

So, currently, the medium term forecasts of climate change impacts – sea level rises of maybe 1 to 2 feet, average temperature increases of one or two degrees, and so forth – seem roughly manageable. The problem always seems to come in the longer term – after 2100 for example in the recent National Academy of Sciences study funded, among others, by the US intelligence community.

The problem with calculating the impacts and significance of these longer term impacts today is that the present value accounting framework just makes things that far into the future almost insignificant.

Currently, for example, global output is on the order of 80 trillion dollars. Suppose we accept a discount rate of 4 percent. Then, calculating the discount factor 150 years from today, in 2154, we have 0 .003. So according to this logic, the loss of 80 trillion dollars worth of production in 2154 has a present value of about 250 billion dollars. Thus, losing an amount of output in 150 years equal to the total productive activity of the planet today is worth a mere 250 billion dollars in present value terms, or about the current GDP of Ireland.

Now I may have rounded and glossed some of the arithmetic possibly, but the point stands no matter how you make the computation.

This is totally absurd. Because as a guide to losing future output of $80 trillion dollars in a century and one half, it seems we should be willing to spend on a planetary basis more than a one-time cost of $35 per person today, when the per capita global output is on the order of $1000 per person.

So we need a better accounting framework.

Of course, there are counterarguments. For example, in 150 years, perhaps science will have discovered how to boost the carbon dioxide processing capabilities of plants, so we can have more pollution. And looking back 150 years to the era of the horse and buggy, we can see that there has been tremendous technological change.

But this is a little like waiting for the amazing “secret weapons” to be unveiled in a war you are losing.

Header photo courtesy of NASA

Predicting the Hurricane Season

I’ve been focusing recently on climate change and extreme weather events, such as hurricanes and tornados. This focus is interesting in its own right, offering significant challenges to data analysis and predictive analytics, and I also see strong parallels to economic forecasting.

The Florida State University Center for Ocean-Atmospheric Prediction Studies (COAPS) garnered good press 2009-2012, for its accurate calls on the number of hurricanes and named tropical storms in the North Atlantic. Last year was another story, however, and it’s interesting to explore why 2013 was so unusual – there being only two (2) hurricanes and no major hurricanes over the whole season.

Here’s the track record for COAPS, since it launched its new service.

Hurricaneforecastaccuracy

The forecast for 2013 was a major embarrassment, inasmuch as the Press Release at the beginning of June 2013 predicted an “above-average season.”

Tim LaRow, associate research scientist at COAPS, and his colleagues released their fifth annual Atlantic hurricane season forecast today. Hurricane season begins June 1 and runs through Nov. 30.

This year’s forecast calls for a 70 percent probability of 12 to 17 named storms with five to 10 of the storms developing into hurricanes. The mean forecast is 15 named storms, eight of them hurricanes, and an average accumulated cyclone energy (a measure of the strength and duration of storms accumulated during the season) of 135.

“The forecast mean numbers are identical to the observed 1995 to 2010 average named storms and hurricanes and reflect the ongoing period of heightened tropical activity in the North Atlantic,” LaRow said.

The COAPS forecast is slightly less than the official National Oceanic and Atmospheric Administration (NOAA) forecast that predicts a 70 percent probability of 13 to 20 named storms with seven to 11 of those developing into hurricanes this season…

What Happened?

Hurricane forecaster Gary Bell is quoted as saying,

“A combination of conditions acted to offset several climate patterns that historically have produced active hurricane seasons,” said Gerry Bell, Ph.D., lead seasonal hurricane forecaster at NOAA’s Climate Prediction Center, a division of the National Weather Service. “As a result, we did not see the large numbers of hurricanes that typically accompany these climate patterns.”

More informatively,

Forecasters say that three main features loom large for the inactivity: large areas of sinking air, frequent plumes of dry, dusty air coming off the Sahara Desert, and above-average wind shear. None of those features were part of their initial calculations in making seasonal projections. Researchers are now looking into whether they can be predicted in advance like other variables, such as El Niño and La Niña events.

I think it’s interesting NOAA stuck to its “above-normal season” forecast as late as August 2013, narrowing the numbers only a little. At the same time, neutral conditions with respect to la Nina and el Nino in the Pacific were acknowledged as influencing the forecasts. The upshot – the 2013 hurricane season in the North Atlantic was the 7th quietest in 70 years.

Risk Behaviors and Extreme Events

Apparently, it’s been more than 8 years since a category 3 hurricane hit the mainland of the US. This is chilling, inasmuch as Sandy, which caused near-record damage on the East Coast, was only a category 1 when it made landfall in New Jersey in 2012.

Many studies highlight a “ratchet pattern” in risk behaviors following extreme weather, such as a flood or hurricane. Initially, after the devastation, people engage in lots of protective, pre-emptive behavior. Typically, flood insurance coverage shoots up, only to gradually fall off, when further flooding has not been seen for a decade or more.

Similarly, after a volcanic eruption, in Indonesia, for example, and destruction of fields and villages by lava flows or ash – people take some time before they re-claim those areas. After long enough, these events can give rise to rich soils, supporting high crop yields. So since the volcano has not erupted for, say, decades or a century, people move back and build even more intensively than before.

This suggests parallels with economic crisis and its impacts, and measures taken to make sure “it never happens again.”

I also see parallels between weather and economic forecasting.

Maybe there is a chaotic element in economic dynamics, just as there almost assuredly is in weather phenomena.

Certainly, the curse of dimension in forecasting models translates well from weather to economic forecasting. Indeed, a major review of macroeconomic forecasting, especially of its ability to predict recessions, concludes that economic models are always “fighting the last war,” in the sense that new factors seem to emerge and take control during every major economic crises. Things do not repeat themselves exactly. So, if the “true” recession forecasting model has legitimately 100 drivers or explanatory variables, it takes a long historic record to sort out the separate influences of these – and the underlying technological basis of the economy is changing all the time.

Tornado Frequency Distribution

Data analysis, data science, and advanced statistics have an important role to play in climate science.

James Elsner’s blog Hurricane & Tornado Climate offers salient examples, in this regard.

Yesterday’s post was motivated by an Elsner suggestion that the time trend in maximum wind speeds of larger or more powerful hurricanes is strongly positive since weather satellite observations provide better measurement (post-1977).

Here’s a powerful, short video illustrating the importance of proper data segmentation and statistical characterization for tornado data – especially for years of tremendous devastation, such as 2011.

Events that year have a more than academic interest for me, incidentally, since my city of birth – Joplin, Missouri – suffered the effects of a immense supercell which touched down and destroyed everything in its path, including my childhood home. The path of this monster was, at points, nearly a mile wide, and it gouged out a track several miles through this medium size city.

Here is Elsner’s video integrating data analysis with matters of high human import.

There is a sort of extension, in my mind, of the rational expectations issue to impacts of climate change and extreme weather. The question is not exactly one people living in areas subject to these events might welcome. But it is highly relevant to data analysis and statistics.

The question simply is whether US property and other insurance companies are up-to-speed on the type of data segmentation and analysis that is needed to adequately capture the probable future impacts of some of these extreme weather events.

This may be where the rubber hits the road with respect to Bayesian techniques – popular with at least some prominent climate researchers, because they allow inclusion of earlier, less-well documented historical observations.

Quantile Regression

There’s a straight-forward way to understand the value and potential significance of quantile regression – consider the hurricane data referenced in James Elsner’s blog Hurricane & Tornado Climate.

Here is a plot of average windspeed of hurricanes in the Atlantic and Gulf Coast since satellite observations began after 1977.

HurricaneAvgWS

Based on averages, the linear trend line increases about 2 miles per hour over this approximately 30 year period.

An 80th percentile quantile regression trend line, on the other hand, with this data indicates that the trend in the more violent hurricanes shows an about 15 mph increase over this same period.

HurricaneQuartileReg

In other words, if we look at the hurricanes which are in the 80th percentile or more, there is a much stronger trend in maximum wind speeds, than in the average for all US-related hurricanes in this period.

A quantile q, 0<q<1, splits the data into proportions q below and 1-q above. The most familiar quantile, thus, may be the 50th percentile which is the quantile which splits the data at the median – 50 percent below and 50 percent above.

Quantile regression (QR) was developed, in its modern incarnation by Koenker and Basset in 1978. QR is less influenced by non-normal errors and outliers, and provides a richer characterization of the data.

Thus, QR encourages considering the impact of a covariate on the entire distribution of y, not just is conditional mean.

Roger Koenker and Kevin F. Hallock’s Quantile Regression in the Journal of Economic Perspectives 2001 is a standard reference.

We say that a student scores at the tth quantile of a standardized exam if he performs better than the proportion t of the reference group of students and worse than the proportion (1–t). Thus, half of students perform better than the median student and half perform worse. Similarly, the quartiles divide the population into four segments with equal proportions of the reference population in each segment. The quintiles divide the population into five parts; the deciles into ten parts. The quantiles, or percentiles, or occasionally fractiles, refer to the general case.

Just as we can define the sample mean as the solution to the problem of minimizing a sum of squared residuals, we can define the median as the solution to the problem of minimizing a sum of absolute residuals.

Ordinary least squares (OLS) regression minimizes the sum of squared errors of observations minus estimates. This minimization leads to explicit equations for regression parameters, given standard assumptions.

Quantile regression, on the other hand, minimizes weighted sums of absolute deviations of observations on a quantile minus estimates. This minimization problem is solved by the simplex method of linear programming, rather than differential calculus. The solution is robust to departures from normality of the error process and outliers.

Koenker’s webpage is a valuable resource with directions for available software to estimate QR. I utilized Mathworks Matlab for my estimate of a QR with the hurricane data, along with a supplemental program for quantreg(.) I downloaded from their site.

Here are a couple of short, helpful videos from Econometrics Academy.

Featured image from http://www.huffingtonpost.com/2012/10/29/hurricane-sandy-apps-storm-tracker-weather-channel-red-cross_n_2039433.html