Here is an update on the forecasts from last Monday – forecasts of the high and low of SPY, QQQ, GE, and MSFT.
This table is easy to read, even though it is a little” busy”.
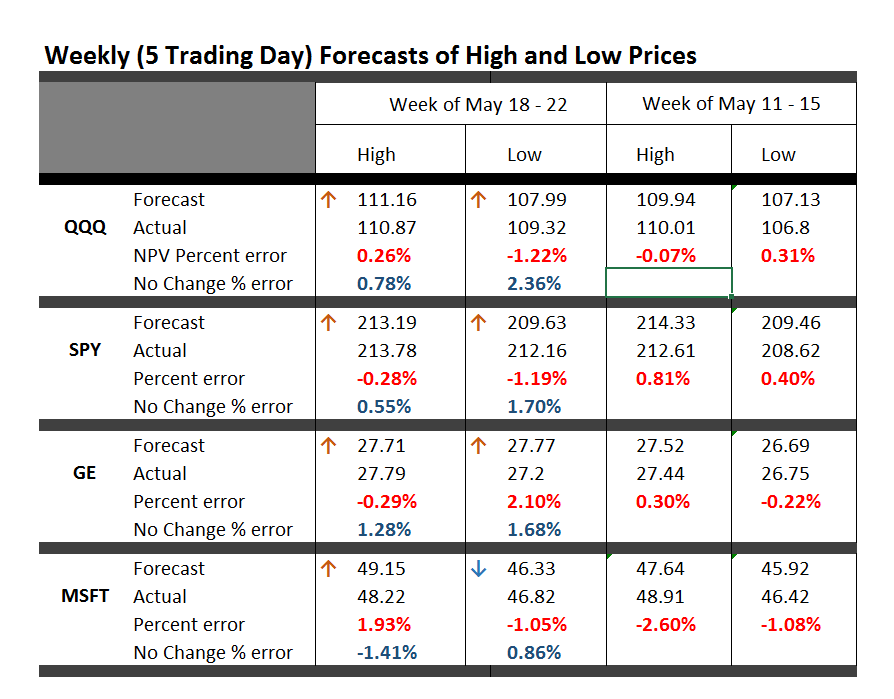
One key is to look at the numbers highlighted in red and blue (click to enlarge).
These are the errors from the week’s forecast based on the NPV algorithm (explained further below) and a No Change forecast.
So if you tried to forecast the high for the week to come, based on nothing more than the high achieved last week – you would be using a No Change model. This is a benchmark in many forecasting discussions, since it is optimal (subject to some qualifications) for a random walk. Of course, the idea stock prices are a random walk came into favor several decades ago, and now gradually is being rejected of modified, based on findings such as those above.
The NPV forecasts are more accurate for this last week than No Change projections 62.5 percent of the time, or in 5 out of the 8 forecasts in the table for the week of May 18-22. Furthermore, in all three cases in which the No Change forecasts were better, the NPV forecast error was roughly comparable in absolute size. On the other hand, there were big relative differences in the absolute size of errors in the situations in which the NPV forecasts proved more accurate, for what that is worth.
The NPV algorithm, by the way, deploys various price ratios (nearby prices) and their transformations as predictors. Originally, the approach focused on ratios of the opening price in a period and the high or low prices in the previous period. The word “new” indicates a generalization has been made from this original specification.
Ridge Regression
I have been struggling with Visual Basic and various matrix programming code for ridge regression with the NPV specifications.
Using cross validation of the λ parameter, ridge regression can improve forecast accuracy on the order of 5 to 10 percent. For forecasts of the low prices, this brings forecast errors closer to acceptable error ranges.
Having shown this, however, I am now obligated to deploy ridge regression in several of the forecasts I provide for a week or perhaps a month ahead.
This requires additional programming to be convenient and transparent to validation.
So, I plan to work on that this coming week, delaying other tables with weekly or maybe monthly forecasts for a week or so.
I will post further during the coming week, however, on the work of Andrew Lo (MIT Financial Engineering Center) and high frequency data sources in business forecasts.
Probable Basis of Success of NPV Forecasts
Suppose you are an observer of a market in which securities are traded. Initially, tests show strong evidence stock prices in this market follow random walk processes.
Then, someone comes along with a theory that certain price ratios provide a guide to when stock prices will move higher.
Furthermore, by accident, that configuration of price ratios occurs and is associated with higher prices at some date, or maybe a couple dates in succession.
Subsequently, whenever price ratios fall into this configuration, traders pile into a stock, anticipating its price will rise during the next trading day or trading period.
Question – isn’t this entirely plausible, and would it not be an example of a self-confirming prediction?
I have a draft paper pulling together evidence for this, and have shared some findings in previous posts. For example, take a look at the weird mirror symmetry of the forecast errors for the high and low.
And, I suspect, the absence or ambivalence of this underlying dynamic is why closing prices are harder to predict than period high or low prices of a stock. If I tell you the closing price will be higher, you do not necessarily buy the stock. Instead, you might sell it, since the next morning opening prices could jump down. Or there are other possibilities.
Of course, there are all kinds of systems traders employ to decide whether to buy or sell a stock, so you have to cast your net pretty widely to capture effects of the main methods.
Long Term Versus Short Term
I am getting mixed results about extending the NPV approach to longer forecast horizons – like a quarter or a year or more.
Essentially, it looks to me as if the No Change model becomes harder and harder to beat over longer forecast horizons – although there may be long run persistence in returns or other features that I see other researchers (such as Andrew Lo) have noted.