Statistica put together this graphic showing quarter-over-quarter growth in US real GDP from 2009 to the 2nd quarter of 2014.
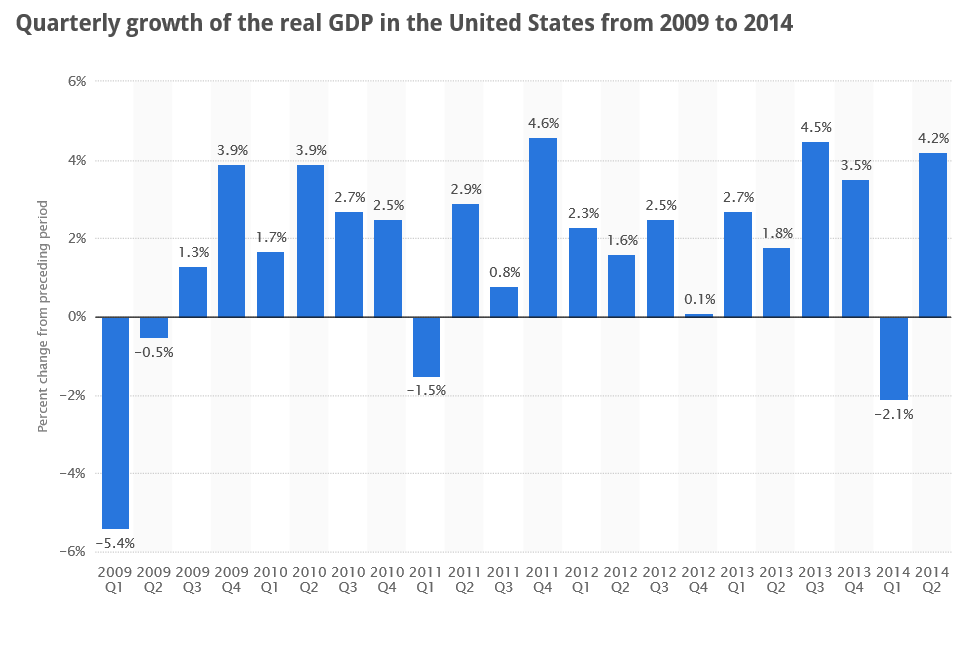
The last bar in the chart, showing 4.2 percent growth, is the 2nd quarter 2014 estimate, released by The Bureau of Economic Analysis (BEA) August 28. This represents a slight upward revision from the 4.0 percent “advance estimate” released in July.
Notice these are quarter-over-quarter growth rates, and, as the Statistica chart shows, are fairly volatile.
Thus, a 4.1 percent real or inflation-adjusted growth rate for the April through June 2014 period does not mean 2014 growth will roll in at this rate.
In fact, as the Forbes item on this release highlights,
Dan North, chief economist at Euler Hermes North America… warns GDP watchers should not get too excited…since the economy contracted 2.1% in the first quarter of this year the large jump is payback and in the first half of 2014 the economy gained just 1%. North expects third and fourth quarter GDP to gain around 3% which would round out to an uninspiring roughly 2% growth for the year.
The BEA presents the following detail on the growth estimate (click to enlarge).

Personal consumption expenditures are the largest component in the real GDP series, and bounced back to 2.5 percent growth in the 2nd quarter. Gross private domestic investment surged 17.5 percent for Q2 over Q1, and included healthy 10.7 Q-over-Q growth in investment in equipment. Exports also showed solid Q-over-Q growth.
Europe and Japan
Europe and Japan numbers for the 2nd Quarter are more pessimistic.
Here’s a comparison with European Q-over-Q real growth rates from Eurostat .
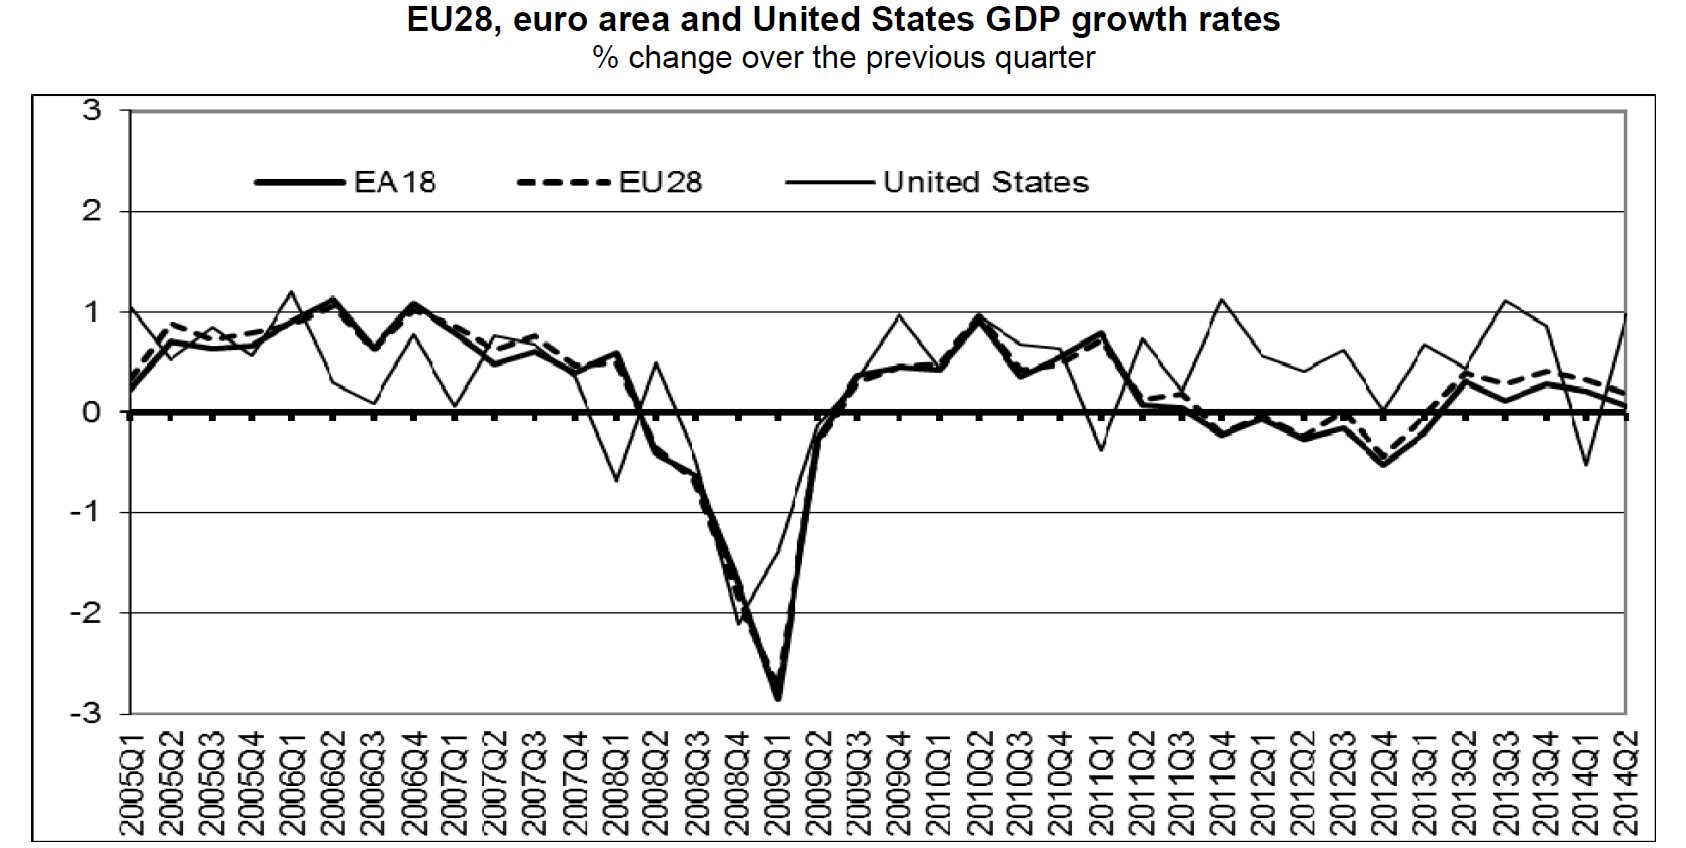
The EA 18 is the Euro Area, which includes Belgium, Germany, Estonia, Ireland, Greece, Spain, France, Italy, Cyprus, Latvia, Luxembourg, Malta, the Netherlands, Austria, Portugal, Slovenia, Slovakia and Finland.
Germany and Italy report -0.2 percent declines Q-over-Q growth in the 2nd quarter.
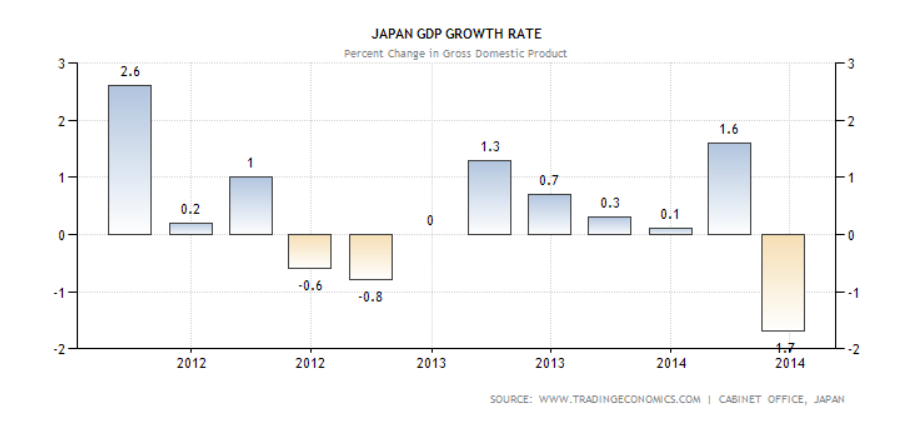
Trading Economics compiles the following chart of Japanese Q-over-Q real GDP growth, which tanked the 2nd quarter.
From this data, I think it is safe to say the recovery from 2008-2009 is still under-performing.
Whether these data will be followed on by year-over-year declines in future quarters remains to be seen.