
Well, not exactly, since I never left it.
But the US and other markets opened higher today, after round-the-clock negotiations on the Greek debt.
I notice that Jeff Miller of Dash of Insight frequently writes stuff like, We would all like to know the direction of the market in advance. Good luck with that! Second best is planning what to look for and how to react.
Running the EVPA with this morning’s pop up in the opening price of the SPY, I get a predicted high for the day of 210.17 and a predicted low of 207.5. The predicted low for the day will be spot-on, if the current actual low for the trading range holds.
I can think of any number of arguments to the point that the stock market is basically not predictable, because unanticipated events constantly make an impact on prices. I think it would even be possible to invoke Goedel’s Theorem – you know, the one that uses meta-mathematics to show that every axiomatic system of complexity greater than a group is essentially incomplete. There are always new truths.
On the other hand, backtesting the EVPA – extreme value prediction algorithm – is opening up new vistas. I’m appreciative of helpful comments of and discussions with professionals in the finance and stock market investing field.
I strain every resource to develop backtests which are out-of-sample (OOS), and recently have found a way to predict closing prices with resources from the EVPA.
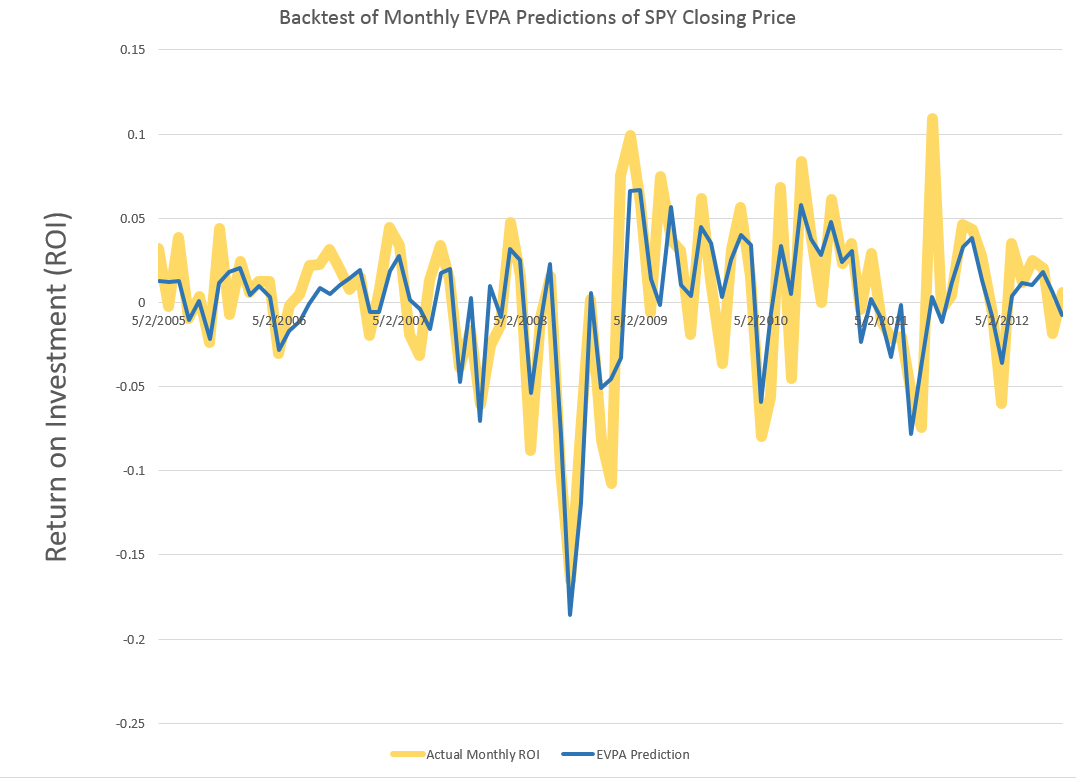
Great chart. The wider gold lines are the actual monthly ROI for the SPY, based on monthly closing prices. The blue line shows the OOS prediction of these closing prices, based on EVPA metrics. As you can see, the blue line predictions flat out miss or under-predict some developments in the closing prices. At the same time, in other cases, the EVPA predictions show uncanny accuracy, particularly in some of the big dips down.
Recognize this is something new. Rather than, say, predicting developments likely over a range of trading days – the high and low of a month, the chart above shows predictions for stock prices at specific times, at the closing bell of the market the last trading day of each month.
I calculate the OOS R2 at 0.63 for the above series, which I understand is better than can be achieved with an autoregressive model for the closing prices and associated ROI’s.
I’ve also developed spreadsheets showing profits, after broker fees and short term capital gains taxes, from trading based on forecasts of the EVPA.
But, in addition to guidance for my personal trading, I’m interested in following out the implications of how much the historic prices predict about the prices to come.