Category Archives: macroeconomic forecasting

Links – 2014, Early January

US and Global Economy

Bernanke sees headwinds fading as US poised for growth – happy talk about how good things are going to be as quantitative easing is “tapered.”

Slow Growth and Short Tails But Dr. Doom (Nouriel Roubini) is guardedly optimistic about 2014

The good news is that economic performance will pick up modestly in both advanced economies and emerging markets. The advanced economies, benefiting from a half-decade of painful private-sector deleveraging (households, banks, and non-financial firms), a smaller fiscal drag (with the exception of Japan), and maintenance of accommodative monetary policies, will grow at an annual pace closer to 1.9%. Moreover, so-called tail risks (low-probability, high-impact shocks) will be less salient in 2014. The threat, for example, of a eurozone implosion, another government shutdown or debt-ceiling fight in the United States, a hard landing in China, or a war between Israel and Iran over nuclear proliferation, will be far more subdued.

GOLDMAN: Here’s What Will Happen With GDP, Housing, The Fed, And Unemployment Next year Goldman Sachs chief economist Jan Hatzius writes: 10 Questions for 2014  – Jan Hatzius is very bullish on 2014!

Three big macro questions for 2014 Gavyn Davies – tapering QE, China, and the euro. Requires free registration to read.

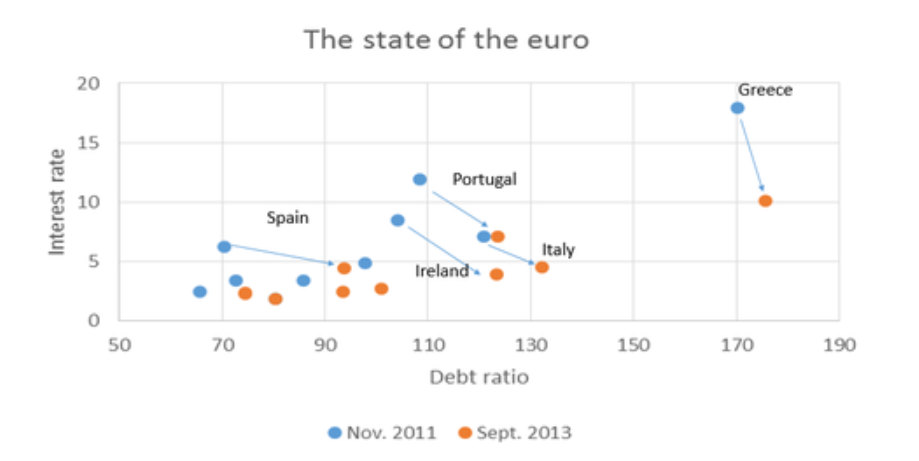
The State of the Euro, In One Graph From Paul Krugman, the point being that the EU’s austerity policies have significantly worsened the debt ratios of Spain, Portugal, Ireland, Greece, and Italy, despite lower interest rates. (Click to enlarge)

StateofEuro

Technology

JCal’s 2014 predictions: Intense competition for YouTube and a shake up in online video economics

Rumblings in the YouTube community in the midst of tremendous growth in video productions – interesting.

Do disruptive technologies really overturn market leadership?

Discusses tests of the idea that ..such technologies have the characteristic that they perform worse on an important metric (or metrics) than current market leading technologies. Of course, if that were it, then the technologies could hardly be called disruptive and would be confined, at best, to niche uses.

The second critical property of such technologies is that while they start behind on key metrics, they improve relatively rapidly and eventually come to outperform existing technologies on many metrics. It is there that disruptive technologies have their bite. Initially, they are poor performers and established firms would not want to integrate them into their products as they would disappoint their customers who happen to be most of the current market. However, when performance improves, the current technologies are displaced and established firms want to get in on the game. The problem is that they may be too late. In other words, Christensen’s prediction was that established firms would have legitimate “blind spots” with regard to disruptive technologies leaving room open for new entrants to come in, adopt those technologies and, ultimately, displace the established firms as market leaders.

Big Data – A Big Opportunity for Telecom Players

Today with sharp increase in online and mobile shopping with use of Apps, telecom companies have access to consumer buying behaviours and preference which are actually being used with real time geo-location and social network analysis to target consumers. Hmmm.

5 Reasons Why Big Data Will Crush Big Research

Traditional marketing research or “big research” focuses disproportionately on data collection.  This mentality is a hold-over from the industry’s early post-WWII boom –when data was legitimately scarce.  But times have changed dramatically since Sputnik went into orbit and the Ford Fairlane was the No. 1-selling car in America.

Here is why big data is going to win.

Reason 1: Big research is just too small…Reason 2 : Big research lacks relevance… Reason 3: Big research doesn’t handle complexity well… Reason 4: Big research’s skill sets are outdated…  Reason 5: Big research lacks the will to change…

I know “market researchers” who fit the profile in this Forbes article, and who are more or less lost in the face of the new extent of data and techniques for its analysis. On the other hand, I hear from the grapevine that many executives and managers can’t really see what the Big Data guys in their company are doing. There are success stories on the Internet (see the previous post here, for example), but this may be best case. Worst case is a company splurges on the hardware to implement Big Data analytics, and the team just comes up with gibberish – very hard to understand relationships with no apparent business value.

Some 2013 Recaps

Top Scientific Discoveries of 2013

Humankind goes interstellar ..Genome editing ..Billions and billions of Earths

exoplanets-660x326

Global warming: a cause for the pause ..See-through brains ..Intergalactic Neutrinos ..A new meat-eating mammal

olinguito

Pesticide controversy grows ..Making organs from stem cells ..Implantable electronics ..Dark matter shows up — or doesn’t ..Fears of the fathers

The 13 Most Important Charts of 2013

TopCharts

And finally, a miscellaneous item. Hedge funds apparently do beat the market, or at least companies operating in the tail of the performance distribution show distinctive characteristics.

How do Hedge Fund “Stars” Create Value? Evidence from Their Daily Trades

I estimate hedge fund performance by computing calendar-time transaction portfolios (see, e.g., Seasholes and Zhu, 2010) with holding periods ranging from 21 to 252 days. Across all holding periods, I find no evidence that the average or median hedge fund outperforms, after accounting for trading commissions. However, I find significant evidence of outperformance in the right-tail of the distribution. Specifically, bootstrap simulations indicate that the annual performance of the top 10-30% of hedge funds cannot be explained by luck. Similarly, I find that superior performance persists. The top 30% of hedge funds outperform by a statistically significant 0.25% per month over the subsequent year. In sharp contrast to my hedge fund findings, both bootstrap simulations and performance persistence tests fail to reveal any outperformance among non-hedge fund institutional investors….

My remaining tests investigate how outperforming hedge funds (i.e., “star” hedge funds) create value. My main findings can be summarized as follows. First, star hedge funds’ profits are concentrated over relatively short holding periods. Specifically, more than 25% (50%) of star hedge funds’ annual outperformance occurs within the first month (quarter) after a trade. Second, star hedge funds tend to be short-term contrarians with small price impacts. Third, the profits of star hedge funds are concentrated in their contrarian trades. Finally, the performance persistence of star hedge funds is substantially stronger among funds that follow contrarian strategies (or funds with small price impacts) and is not at all present for funds that follow momentum strategies (or funds with large price impacts).

The On-Coming Tsunami of Data Analytics

More than 25,000 visited businessforecastblog, March 2012-December 2013, some spending hours on the site. Interest ran nearly 200 visitors a day in December, before my ability to post was blocked by a software glitch, and we did this re-boot.

Now I have hundreds of posts offline, pertaining to several themes, discussed below. How to put this material back up – as reposts, re-organized posts, or as longer topic summaries?

There’s a silver lining. This forces me to think through forecasting, predictive and data analytics.

One thing this blog does is compile information on which forecasting and data analytics techniques work, and, to some extent, how they work, how key results are calculated. I’m big on computation and performance metrics, and I want to utilize the SkyDrive more extensively to provide full access to spreadsheets with worked examples.

Often my perspective is that of a “line worker” developing sales forecasts. But there is another important focus – business process improvement. The strength of a forecast is measured, ultimately, by its accuracy. Efforts to improve business processes, on the other hand, are clocked by whether improvement occurs – whether costs of reaching customers are lower, participation rates higher, customer retention better or in stabilization mode (lower churn), and whether the executive suite and managers gain understanding of who the customers are. And there is a third focus – that of the underlying economics, particularly the dynamics of the institutions involved, such as the US Federal Reserve.

Right off, however, let me say there is a direct solution to forecasting sales next quarter or in the coming budget cycle. This is automatic forecasting software, with Forecast Pro being one of the leading products. Here’s a YouTube video with the basics about that product.

You can download demo versions and participate in Webinars, and attend the periodic conferences organized by Business Forecast Systems showcasing user applications in a wide variety of companies.

So that’s a good solution for starters, and there are similar products, such as the SAS/ETS time series software, and Autobox.

So what more would you want?

Well, there’s need for background information, and there’s a lot of terminology. It’s useful to know about exponential smoothing and random walks, as well as autoregressive and moving averages.  Really, some reaches of this subject are arcane, but nothing is worse than a forecast setup which gains the confidence of stakeholders, and then falls flat on its face. So, yes, eventually, you need to know about “pathologies” of the classic linear regression (CLR) model – heteroscedasticity, autocorrelation, multicollinearity, and specification error!

And it’s good to gain this familiarity in small doses, in connection with real-world applications or even forecasting personalities or celebrities. After a college course or two, it’s easy to lose track of concepts. So you might look at this blog as a type of refresher sometimes.

Anticipating Turning Points in Time Series

But the real problem comes with anticipating turning points in business and economic time series. Except when modeling seasonal variation, exponential smoothing usually shoots over or under a turning point in any series it is modeling.

If this were easy to correct, macroeconomic forecasts would be much better. The following chart highlights the poor performance, however, of experts contributing to the quarterly Survey of Professional Forecasters, maintained by the Philadelphia Fed.

SPFcomp2

So, the red line is the SPF consensus forecast for GDP growth on a three quarter horizon, and the blue line is the forecast or nowcast for the current quarter (there is a delay in release of current numbers). Notice the huge dips in the current quarter estimate, associated with four recessions 1981, 1992, 2001-2, and 2008-9. A mere three months prior to these catastrophic drops in growth, leading forecasters at big banks, consulting companies, and universities totally missed the boat.

This is important in a practical sense, because recessions turn the world of many businesses upside down. All bets are off. The forecasting team is reassigned or let go as an economy measure, and so forth.

Some forward-looking information would help business intelligence focus on reallocating resources to sustain revenue as much as possible, using analytics to design cuts exerting the smallest impact on future ability to maintain and increase market share.

Hedgehogs and Foxes

Nate Silver has a great table in his best-selling The
Signal and the Noise
on the qualities and forecasting performance of hedgehogs and foxes. The idea comes from a Greek poet, “The fox knows many little things, but the hedgehog knows one big thing.”

Following Tetlock, Silver finds foxes are multidisplinary, adaptable, self-critical, cautious, and empirical, tolerant of complexity. By contrast, the Hedgehog is specialized, sticks to the same approaches, stubbornly adheres to his model in spite of counter-evidence, is order-seeking, confident, and ideological. The evidence suggests foxes generally outperform hedgehogs, just as ensemble methods typically outperform a single technique in forecasting.

Message – be a fox.

So maybe this can explain some of the breadth of this blog. If we have trouble predicting GDP growth, what about forecasts in other areas – such as weather, climate change, or that old chestnut, sun spots? And maybe it is useful to take a look at how to forecast all the inputs and associated series – such as exchange rates, growth by global region, the housing market, interest rates, as well as profits.

And while we are looking around, how about brain waves? Can brain waves be forecast? Oh yes, it turns out there is a fascinating and currently applied new approach called neuromarketing, which uses headbands and electrodes, and even MRI machines, to detect deep responses of consumers to new products and advertising.

New Methods

I know I have not touched on cluster analysis and classification, areas making big contributions to improvement of business process. But maybe if we consider the range of “new” techniques for predictive analytics, we can see time series forecasting and analysis of customer behavior coming under one roof.

There is, for example, this many predictor thread emerging in forecasting in the late 1990’s and especially in the last decade with factor models for macroeconomic forecasting. Reading this literature, I’ve become aware of methods for mapping N explanatory variables onto a target variable, when there are M<N observations. These are sometimes called methods of data shrinkage, and include principal components regression, ridge regression, and the lasso. There are several others, and a good reference is The Elements of Statistical Learning, Data Mining, Learning and Prediction, 2nd edition, by Trevor Hastie, Robert Tibshirani, and Jerome Friedman. This excellent text is downloadable, accessible via the Tools, Apps, Texts, Free Stuff menu option located just to the left of the search utility on the heading for this blog.

There also is bagging, which is the topic of the previous post, as well as boosting, and a range of decision tree and regression tree modeling tactics, including random forests.

I’m actively exploring a number of these approaches, ginning up little examples to see how they work and how the computation goes. So far, it’s impressive. This stuff can really improve over the old approaches, which someone pointed out, have been around since the 1950’s at least.

It’s here I think that we can sight the on-coming wave, just out there on the horizon – perhaps hundreds of feet high. It’s going to swamp the old approaches, changing market research forever and opening new vistas, I think, for forecasting, as traditionally understood.

I hope to be able to ride that wave, and now I put it that way, I get a sense of urgency in keeping practicing my web surfing.

Hope you come back and participate in the comments section, or email me at [email protected]