
Predicting global temperature is challenging. This is not only because climate and weather are complex, but because carbon dioxide (CO2) concentrations continue to skyrocket, while global temperature has stabilized since around 2000.
Changes in Global Mean Temperature
The NASA Goddard Institute for Space Studies maintains extensive and updated charts on global temperature.
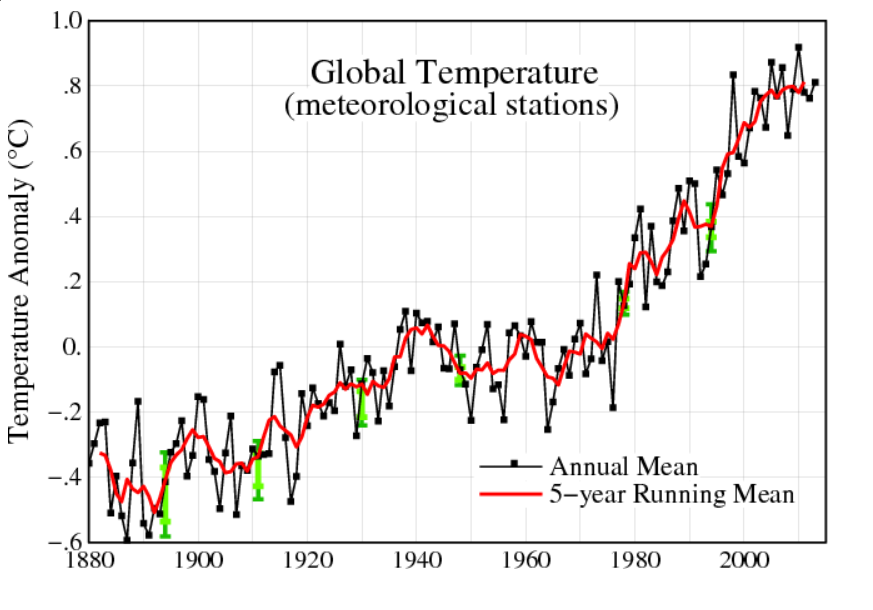
The chart for changes annual mean global temperature is compiled from weather stations from around the planet.
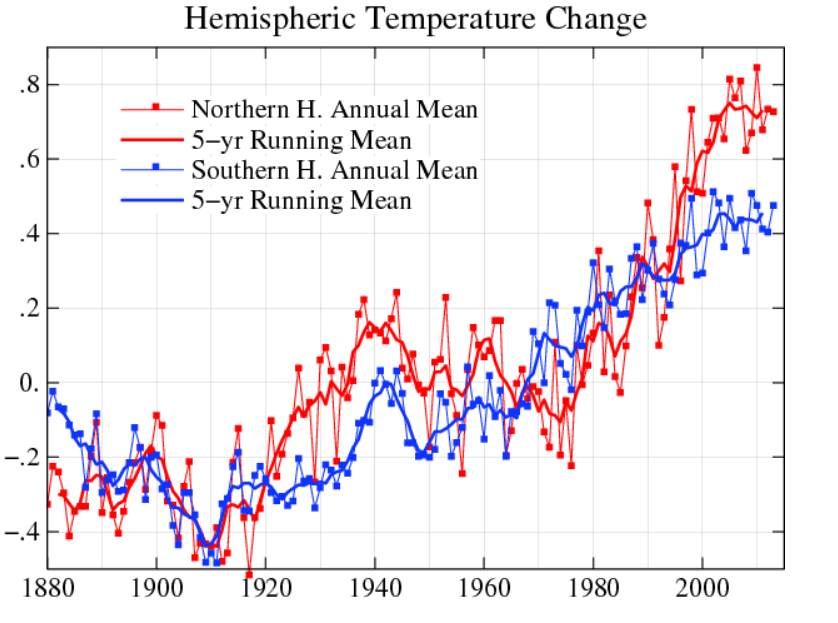
There is also hermispheric variation, with the northern hemisphere showing more increases than the southern hemisphere.
At the same time, observations of the annual change in mean temperature have stabilized since around 2000, as the five year moving averages show.
Atmospheric Carbon Dioxide Concentrations
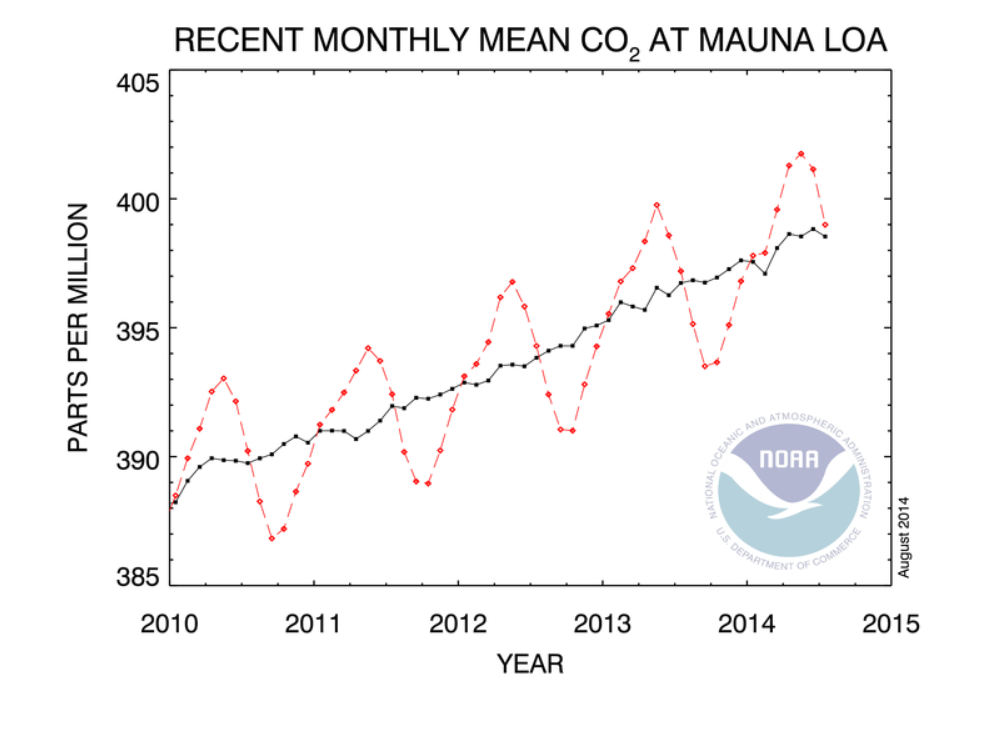
The National Oceanic and Atmospheric Administration (NOAA) maintains measurements of atmospheric carbon dioxide taken in Hawaii at Mauna Loa. These show continual increase since the measurements were first initiated in the late 1950’s.
Here’s a chart showing recent monthly measurements, highlighting the consistent seasonal pattern and strong positive trend since 2010.
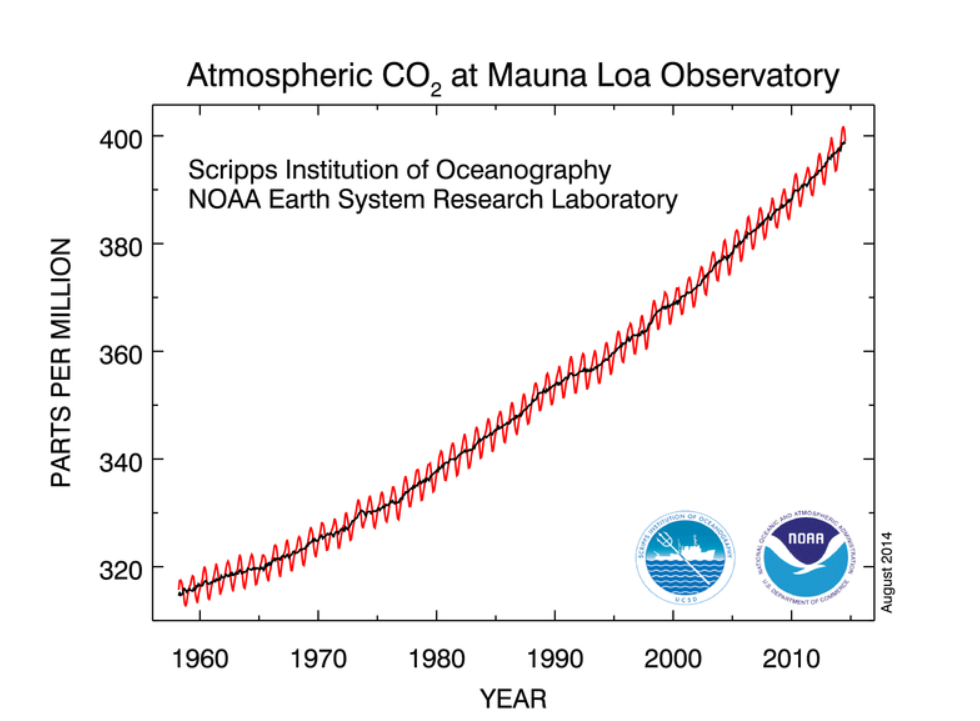
Here’s all the data. The black line in both charts represents the seasonally corrected trend.
A Forecasting Problem
This is a big problem for anyone interested in predicting the future trajectory of climate.
So, according to these measurements on Mauna Loa, carbon dioxide concentrations in the atmosphere have been increasing monotonically (with seasonal variation) since 1958, when measurements first began. Yet global temperatures have not increased on a clear trend since around 2000.
I want to comment in detail sometime on the forecasting controversies that have swirled around these types of measurements and their interpretation, but here let me just suggest the outlines of the problem.
So, it’s clear that the relationship between atmospheric CO2 concentrations and global temperature is not linear, or that there are major intervening variables. Cloud cover may increase with higher temperatures, due to more evaporation. The oceans are still warming, so maybe they are absorbing the additional heat. Perhaps there are other complex feedback processes involved.
However, if my reading of the IPCC literature is correct, these suggestions are still anecdotal, since the big systems models seem quite unable to account for this trajectory of temperature – or at least, recent data appear as outliers.
So there you have it. As noted in earlier posts here, global population is forecast to increase by perhaps one billion by 2030. Global output, even given uncertain impacts of coming recessions, may grow to $150 trillion dollars by 2030. Emissions of greenhouse gases, including but not limited to CO2 also will increase – especially given the paralyzing impacts of the current “pause in global warming” on coordinated policy responses. Deforestation is certainly a problem in this context, although we have not here reviewed the prospects.
One thing to note, however, is that the first two charts presented above trace out changes in global mean temperature by year. The actual level of global mean temperature surged through the 1990’s and remains high. That mean that ice caps are melting, and various processes related to higher temperatures are currently underway.