Searching “forecasting gold prices” on Google lands on a number of ARIMA (autoregressive integrated moving average) models of gold prices. Ideally, researchers focus on shorter term forecast horizons with this type of time series model.
I take a look at this approach here, moving onto multivariate approaches in subsequent posts.
Stylized Facts
These ARIMA models support stylized facts about gold prices such as: (1) gold prices constitute a nonstationary time series, (2) first differencing can reduce gold price time series to a stationary process, and, usually, (3) gold prices are random walks.
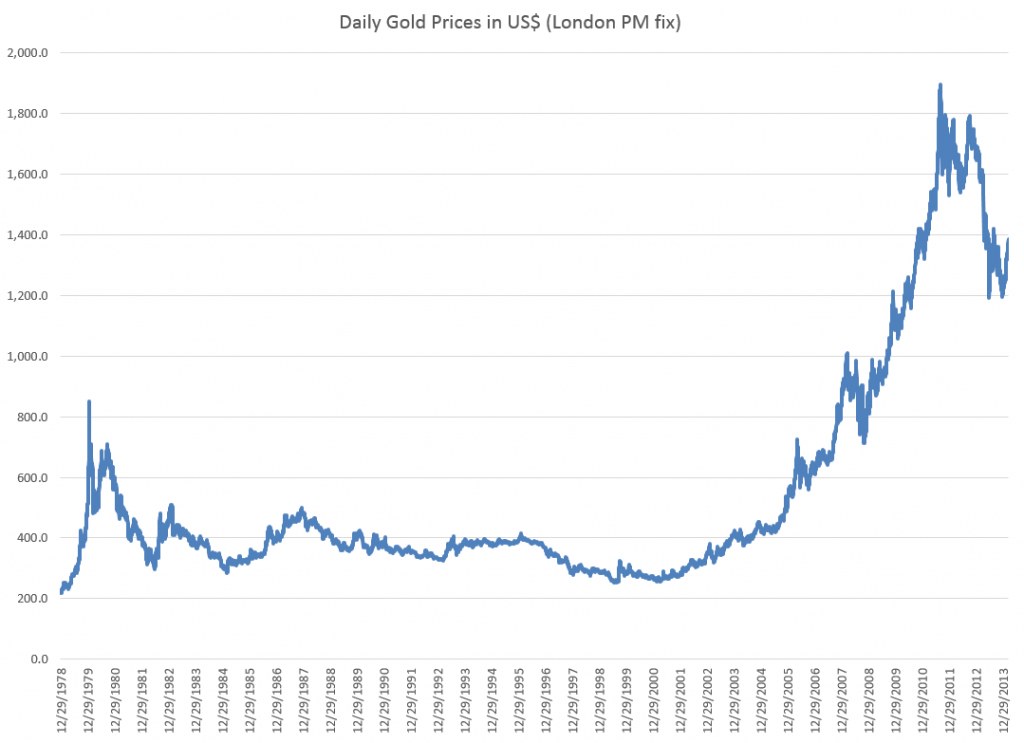
For example, consider daily gold prices from 1978 to the present.
This chart, based World Gold Council data and the London PM fix, shows gold prices do not fluctuate about a fixed level, but can move in patterns with a marked trend over several years.
The trick is to reduce such series to a mean stationary series through appropriate differencing and, perhaps, other data transformations, such as detrending and taking out seasonal variation. Guidance in this is provided by tools such as the autocorrelation function (ACF) and partial autocorrelation function (PACF) of the time series, as well as tests for unit roots.
Some Terminology
I want to talk about specific ARIMA models, such as ARIMA(0,1,1) or ARIMA(p,d,q), so it might be a good idea to review what this means.
Quickly, ARIMA models are described by three parameters: (1) the autoregressive parameter p, (2) the number of times d the time series needs to be differenced to reduce it to a mean stationary series, and (3) the moving average parameter q.
ARIMA(0,1,1) indicates a model where the original time series yt is differenced once (d=1), and which has one lagged moving average term.
If the original time series is yt, t=1,2,..n, the first differenced series is zt=yt-yt-1, and an ARIMA(0,1,1) model looks like,
zt = θ1εt-1
or converting back into the original series yt,
yt = μ + yt-1 + θ1εt-1
This is a random walk process with a drift term μ, incidentally.
As a note in the general case, the p and q parameters describe the span of the lags and moving average terms in the model. This is often done with backshift operators Lk (click to enlarge)
So you could have a sum of these backshift operators of different orders operating against yt or zt to generate a series of lags of order p. Similarly a sum of backshift operators of order q can operate against the error terms at various times. This supposedly provides a compact way of representing the general model with p lags and q moving average terms.
Similar terminology can indicate the nature of seasonality, when that is operative in a time series.
These parameters are determined by considering the autocorrelation function ACF and partial autocorrelation function PACF, as well as tests for unit roots.
I’ve seen this referred to as “reading the tea leaves.”
Gold Price ARIMA models
I’ve looked over several papers on ARIMA models for gold prices, and conducted my own analysis.
My research confirms that the ACF and PACF indicates gold prices (of course, always defined as from some data source and for some trading frequency) are, in fact, random walks.
So this means that we can take, for example, the recent research of Dr. M. Massarrat Ali Khan of College of Computer Science and Information System, Institute of Business Management, Korangi Creek, Karachi as representative in developing an ARIMA model to forecast gold prices.
Dr. Massarrat’s analysis uses daily London PM fix data from January 02, 2003 to March 1, 2012, concluding that an ARIMA(0,1,1) has the best forecasting performance. This research also applies unit root tests to verify that the daily gold price series is stationary, after first differencing. Significantly, an ARIMA(1,1,0) model produced roughly similar, but somewhat inferior forecasts.
I think some of the other attempts at ARIMA analysis of gold price time series illustrate various modeling problems.
For example there is the classic over-reach of research by Australian researchers in An overview of global gold market and gold price forecasting. These academics identify the nonstationarity of gold prices, but attempt a ten year forecast, based on a modeling approach that incorporates jumps as well as standard ARIMA structure.
A new model proposed a trend stationary process to solve the nonstationary problems in previous models. The advantage of this model is that it includes the jump and dip components into the model as parameters. The behaviour of historical commodities prices includes three differ- ent components: long-term reversion, diffusion and jump/dip diffusion. The proposed model was validated with historical gold prices. The model was then applied to forecast the gold price for the next 10 years. The results indicated that, assuming the current price jump initiated in 2007 behaves in the same manner as that experienced in 1978, the gold price would stay abnormally high up to the end of 2014. After that, the price would revert to the long-term trend until 2018.
As the introductory graph shows, this forecast issued in 2009 or 2010 was massively wrong, since gold prices slumped significantly after about 2012.
So much for long-term forecasts based on univariate time series.
Summing Up
I have not referenced many ARIMA forecasting papers relating to gold price I have seen, but focused on a couple – one which “gets it right” and another which makes a heroically wrong but interesting ten year forecast.
Gold prices appear to be random walks in many frequencies – daily, monthly average, and so forth.
Attempts at superimposing long term trends or even jump patterns seem destined to failure.
However, multivariate modeling approaches, when carefully implemented, may offer some hope of disentangling longer term trends and changes in volatility. I’m working on that post now.


