Automatic forecasting programs are seductive. They streamline analysis, especially with ARIMA (autoregressive integrated moving average) models. You have to know some basics – such as what the notation ARIMA(2,1,1) or ARIMA(p,d,q) means. But you can more or less sidestep the elaborate algebra – the higher reaches of equations written in backward shift operators – in favor of looking at results. Does the automatic ARIMA model selection predict out-of-sample, for example?
I have been exploring the Hyndman R Forecast package – and other contributors, such as George Athanasopoulos, Slava Razbash, Drew Schmidt, Zhenyu Zhou, Yousaf Khan, Christoph Bergmeir, and Earo Wang, should be mentioned.
A 76 page document lists the routines in Forecast, which you can download as a PDF file.
This post is about the routine auto.arima(.) in the Forecast package. This makes volatility modeling – a place where Box Jenkins or ARIMA modeling is relatively unchallenged – easier. The auto.arima(.) routine also encourages experimentation, and highlights the sharp limitations of volatility modeling in a way that, to my way of thinking, is not at all apparent from the extensive and highly mathematical literature on this topic.
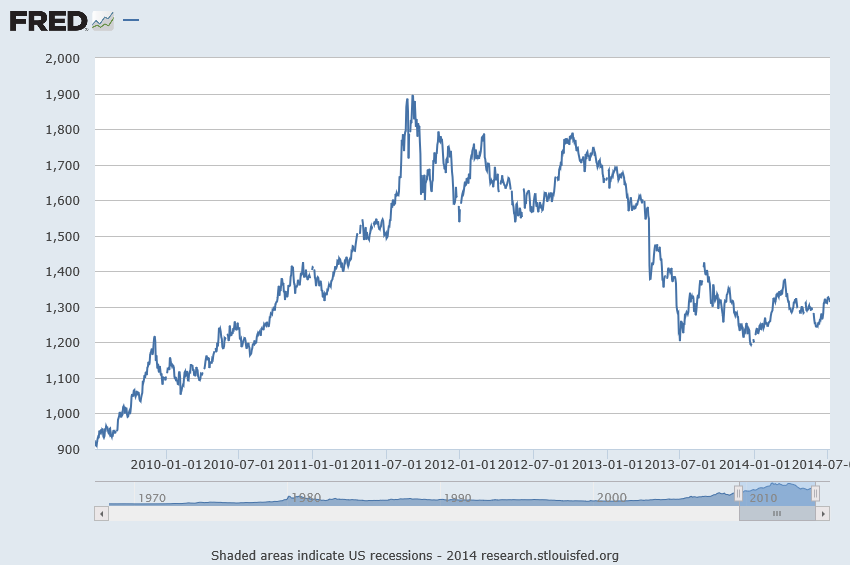
Daily Gold Prices
I grabbed some data from FRED – the Gold Fixing Price set at 10:30 A.M (London time) in London Bullion Market, based in U.S. Dollars.
Now the price series shown in the graph above is a random walk, according to auto.arima(.).
In other words, the routine indicates that the optimal model is ARIMA(0,1,0), which is to say that after differencing the price series once, the program suggests the series reduces to a series of independent random values. The automatic exponential smoothing routine in Forecast is ets(.). Running this confirms that simple exponential smoothing, with a smoothing parameter close to 1, is the optimal model – again, consistent with a random walk.
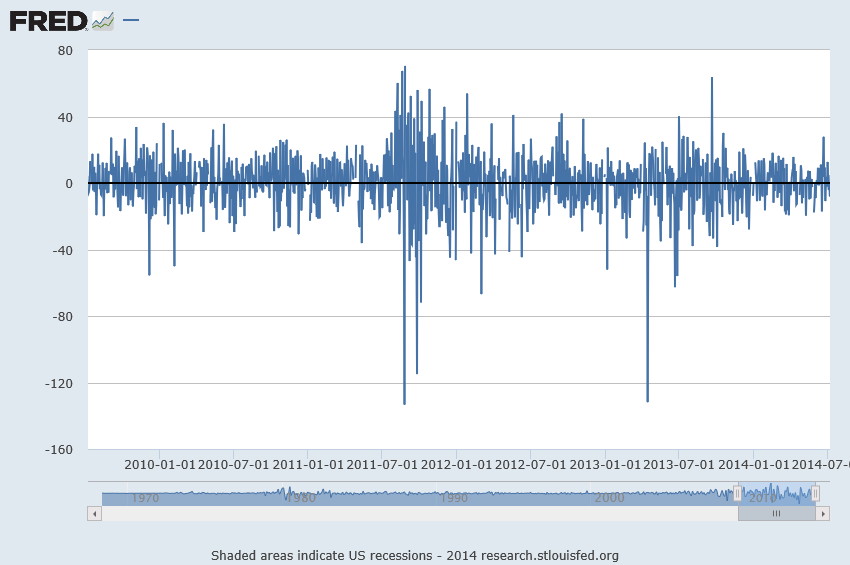
Here’s a graph of these first differences.
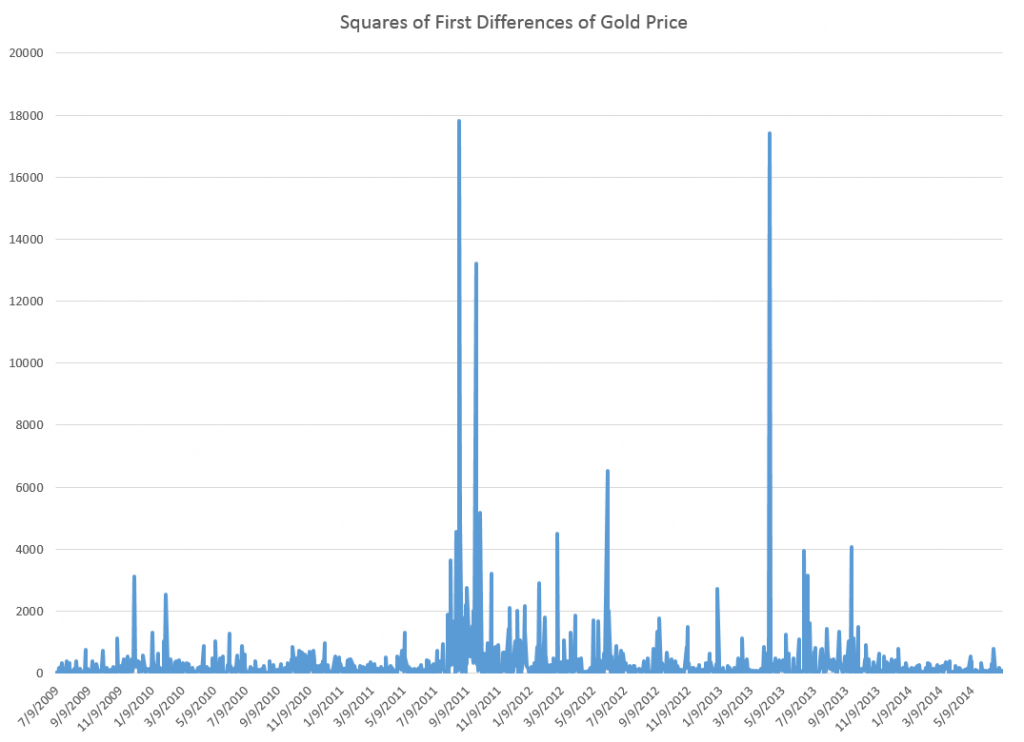
But wait, there is a clustering of volatility of these first differences, which can be accentuated if we square these values, producing the following graph.
Now in a more or less textbook example, auto.arima(.) develops the following ARIMA model for this series
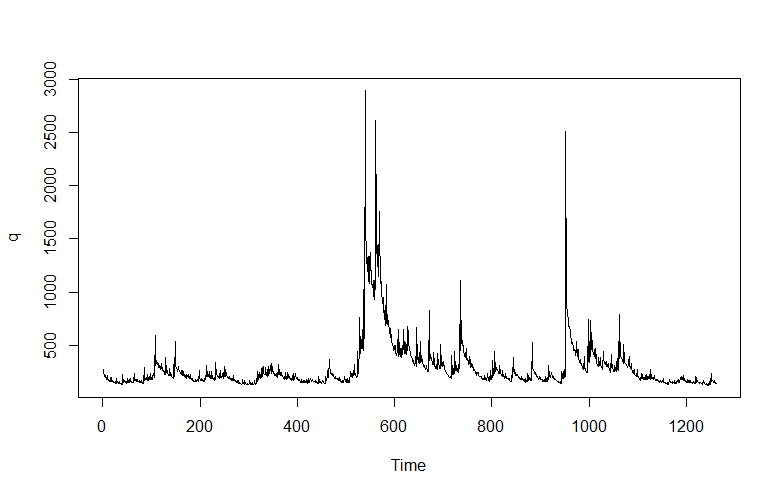
Thus, this estimate of the volatility of the first differences of gold price is modeled as a first order autoregressive process with two moving average terms.
Here is the plot of the fitted values.
Nice.
But of course, we are interested in forecasting, and the results here are somewhat more disappointing.
Basically, this type of model makes a horizontal line prediction at a certain level, which is higher when the past values have been higher.
This is what people in quantitative finance call “persistence” but of course sometimes new things happen, and then these types of models do not do well.
From my research on the volatility literature, it seems that short period forecasts are better than longer period forecasts. Ideally, you update your volatility model daily or at even higher frequencies, and it’s likely your one or two period ahead (minutes, hours, a day) will be more accurate.
Incidentally, exponential smoothing in this context appears to be a total fail, again suggesting this series is a simple random walk.
Recapitulation
There is more here than meets the eye.
First, the auto.arima(.) routines in the Hyndman R Forecast package do a competent job of modeling the clustering of higher first differences of the gold price series here. But, at the same time, they highlight a methodological point. The gold price series really has nonlinear aspects that are not adequately commanded by a purely linear model. So, as in many approximations, the assumption of linearity gets us some part of the way, but deeper analysis indicates the existence of nonlinearities. Kind of interesting.
Of course, I have not told you about the notation ARIMA(p,d,q). Well, p stands for the order of the autoregressive terms in the equation, q stands for the moving average terms, and d indicates the times the series is differenced to reduce it to a stationary time series. Take a look at Forecasting: principles and practice – the free forecasting text of Hyndman and Athanasopoulos – in the chapter on ARIMA modeling for more details.
Incidentally, I think it is great that Hyndman and some of his collaborators are providing an open source, indeed free, forecasting package with automatic forecasting capabilities, along with a high quality and, again, free textbook on forecasting to back it up. Eventually, some of these techniques might get dispersed into the general social environment, potentially raising the level of some discussions and thinking about our common future.
And I guess also I have to say that, ultimately, you need to learn the underlying theory and struggle with the algebra some. It can improve one’s ability to model these series.


