
Out-of-sample (OOS) R2 is a good metric to apply to test whether your predictive relationship has out-of-sample predictability. Checking this for the version of the proximity variable model which is publically documented, I find OOS R2 of 0.63 for forecasts of daily high prices.
In other words, 63 percent of the variation of the daily growth in high prices for the S&P 500 is explained by four variables, documented in Predictability of the Daily High and Low of the S&P 500 Index.
This is a really high figure for any kind of predictive relationship involving security prices, so I thought I would put the data out there for anyone interested to check.
OOS R2
This metric is often found in connection with efforts to predict daily or other rates of return on securities, and is commonly defined as
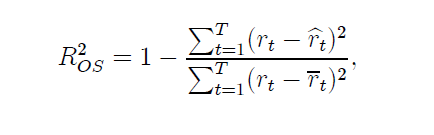
See, for example, Campbell and Thompson.
The white paper linked above and downloadable from University of Munich archives shows –
Ratios involving the current period opening price and the high or low price of the previous period are significant predictors of the current period high or low price for many stocks and stock indexes. This is illustrated with daily trading data from the S&P 500 index. Regressions specifying these “proximity variables” have higher explanatory and predictive power than benchmark autoregressive and “no change” models. This is shown with out-of-sample comparisons of MAPE, MSE, and the proportion of time models predict the correct direction or sign of change of daily high and low stock prices. In addition, predictive models incorporating these proximity variables show time varying effects over the study period, 2000 to February 2015. This time variation looks to be more than random and probably relates to investor risk preferences and changes in the general climate of investment risk.
I wanted to provide interested readers with a spreadsheet containing the basic data and computations of this model, which I call the “proximity variable” model. The idea is that the key variables are ratios of nearby values.
And this is sort of an experiment, since I have not previously put up a spreadsheet for downloading on this blog. And please note the spreadsheet data linked below is somewhat different than the original data for the white paper, chiefly by having more recent observations. This does change the parameter estimates for the whole sample, since the paper shows we are in the realm of time-varying coefficients.
So here goes. Check out this link. PVARresponse
Of course, no spreadsheet is totally self-explanatory, so a few words.
First, the price data (open, high, low, etc) for the S&P 500 come from Yahoo Finance, although the original paper used other sources, too.
Secondly, the data matrix for the regressions is highlighted in light blue. The first few rows of this data matrix include the formulas with later rows being converted to numbers, to reduce the size of the file.
If you look in column K below about row 1720, you will find out-of-sample regression forecasts, created by using data from the immediately preceding trading day and before and current day opening price ratios.
There are 35 cases, I believe, in which the high of the day and the opening price are the same. These can easily be eliminated in calculating any metrics, and, doing so, in fact increases the OOS R2.
I’m sympathetic with readers who develop a passion to “show this guy to be all wrong.” I’ve been there, and it may help to focus on computational matters.
However, there is just no question but this approach is novel, and beats both No Change forecasts and a first order autoregressive forecasts (see the white paper) by a considerable amount.
I personally think these ratios are closely watched by some in the community of traders, and that other price signals motivating trades are variously linked with these variables.
My current research goes further than outlined in the white paper – a lot further. At this point, I am tempted to suggest we are looking at a new paradigm in predictability of stock prices. I project “waves of predictability” will be discovered in the movement of ensembles of security prices. These might be visualized like the wave at a football game, if you will. But the basic point is that I reckon we can show how early predictions of these prices changes are self-confirming to a degree, so emerging signs of the changes being forecast in fact intensify the phenomena being predicted.
Think big.
Keep the comments coming.