When I began this blog three years ago, I wanted to deepen my understanding of technique – especially stuff growing up alongside Big Data and machine learning.
I also was encouraged by Malcolm Gladwell’s 10,000 hour idea – finding it credible from past study of mathematical topics. So maybe my performance as a forecaster would improve by studying everything about the subject.
Little did I suspect I would myself stumble on a major forecasting discovery.
But, as I am wont to quote these days, even a blind pig uncovers a truffle from time to time.
Forecasting Stock Prices
My discovery pertains to forecasting stock prices.
Basically, I have stumbled on a method of developing much more accurate forecasts of high and low stock prices, given the opening price in a period. These periods can be days, groups of days, weeks, months, and, based on what I present here – quarters.
Additionally, I have discovered a way to translate these results into much more accurate forecasts of closing prices over long forecast horizons.
I would share the full details, except I need some official acknowledgement for my work (in process) and, of course, my procedures lead to profits, so I hope to recover some of what I have invested in this research.
Having struggled through a maze of ways of doing this, however, I feel comfortable sharing a key feature of my approach – which is that it is based on the spreads between opening prices and the high and low of previous periods. Hence, I call these “Pvar models” for proximity variable models.
There is really nothing in the literature like this, so far as I am able to determine – although the discussion of 52 week high investing captures some of the spirit.
S&P 500 Quarterly Forecasts
Let’s look an example – forecasting quarterly closing prices for the S&P 500, shown in this chart.
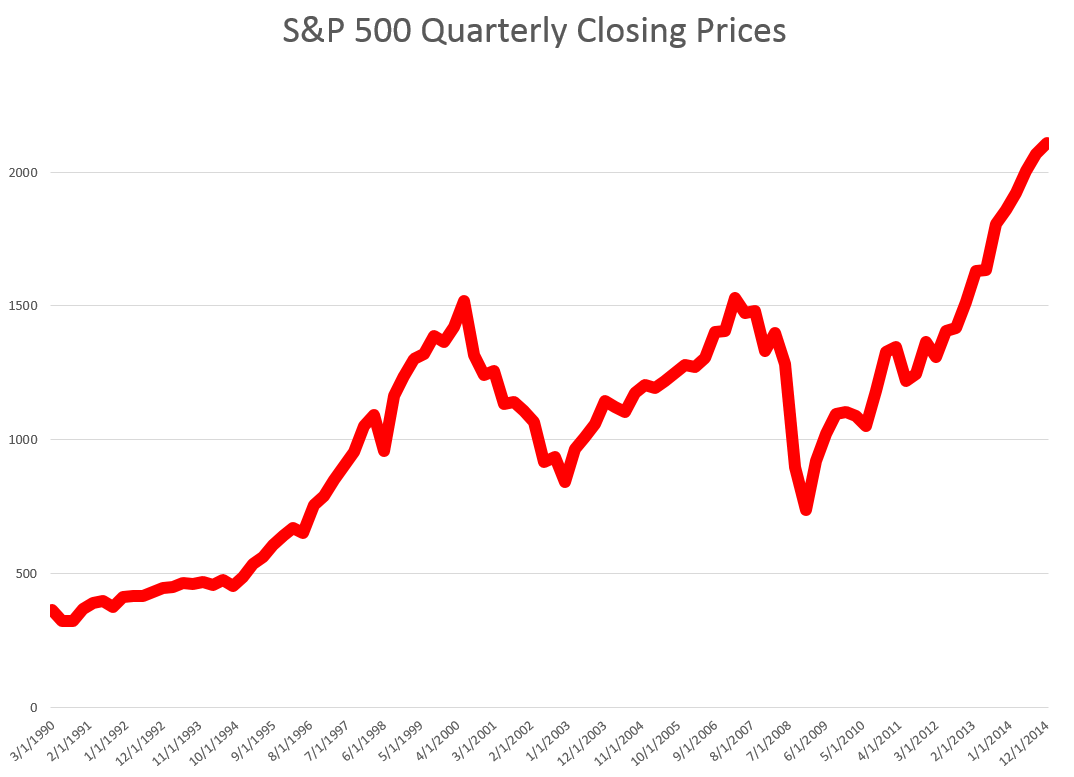
We are all familiar with this series. And I think most of us are worried that after the current runup, there may be another major correction.
In any case, this graph compares out-of-sample forecasts of ARIMA(1,1,0) and Pvar models. The ARIMA forecasts are estimated by the off-the-shelf automatic forecast program Forecast Pro. The Pvar models are estimated by ordinary least squares (OLS) regression, using Matlab and Excel spreadsheets.

The solid red line shows the movement of the S&P 500 from 2005 to just recently. Of course, the big dip in 2008 stands out.
The blue line charts out-of-sample forecasts of the Pvar model, which are from visual inspection, clearly superior to the ARIMA forecasts, in orange.
And note the meaning of “out-of-sample” here. Parameters of the Pvar and ARIMA models are estimated over historic data which do not include the prices in the period being forecast. So the results are strictly comparable with applying these models today and checking their performance over the next three months.
The following bar chart shows the forecast errors of the Pvar and ARIMA forecasts.
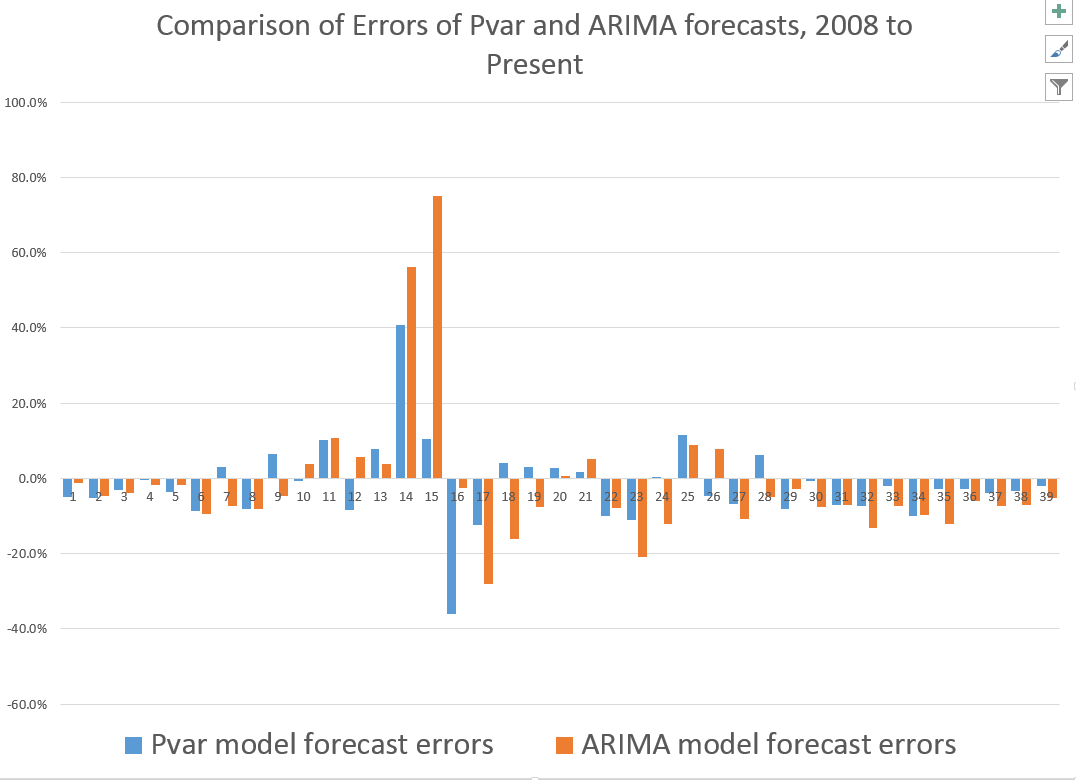
Thus, the Pvar model forecasts are not always more accurate than ARIMA forecasts, but clearly do significantly better at major turning points, like the 2008 recession.
The mean absolute percent errors (MAPE) for the two approaches are 7.6 and 10.2 percent, respectively.
This comparison is intriguing, since Forecast Pro automatically selected an ARIMA(1,1,0) model in each instance of its application to this series. This involves autoregressions on differences of a time series, to some extent challenging the received wisdom that stock prices are random walks right there. But Pvar poses an even more significant challenge to versions of the efficient market hypothesis, since Pvar models pull variables from the time series to predict the time series – something you are really not supposed to be able to do, if markets are, as it were, “efficient.” Furthermore, this price predictability is persistent, and not just a fluke of some special period of market history.
I will have further comments on the scalability of this approach soon. Stay tuned.