I want to pay homage to Paul Erdős, the eccentric Hungarian-British-American-Israeli mathematician, whom I saw lecture a few years before his death. Erdős kept producing work in mathematics into his 70’s and 80’s – showing this is quite possible. Of course, he took amphetamines and slept on people’s couches while he was doing this work in combinatorics, number theory, and probability.

In any case, having invoked Erdős, let me offer comments on forecasting high and low stock prices – a topic which seems to be terra incognita, for the most part, to financial research.
First, let’s take a quick look at a chart showing the maximum prices reached by the exchange traded fund QQQ over a critical period during the last major financial crisis in 2008-2009.
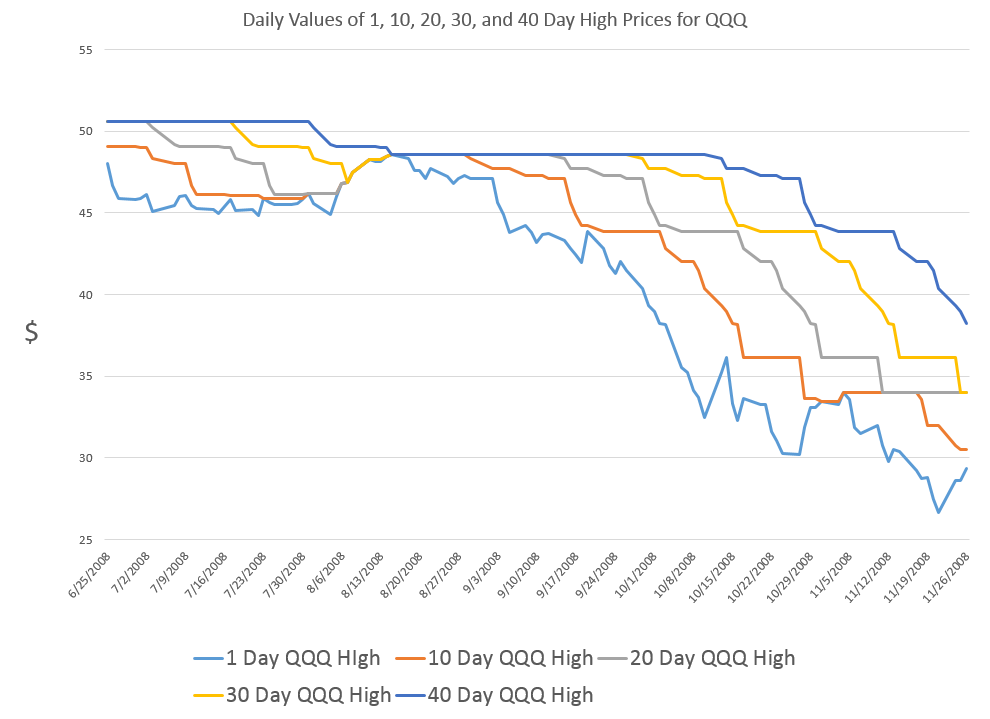
The graph charts five series representing QQQ high prices over periods extending from 1 day to 40 days.
The first thing to notice is that the variability of these time series decreases as the period for the high increases.
This suggests that forecasting the 40 day high could be easier than forecasting the high price for, say, tomorrow.
While this may be true in some sense, I want to point out that my research is really concerned with a slightly different problem.
This is forecasting ahead by the interval for the maximum prices. So, rather than a one-day-ahead forecast of the 40 day high price (which would include 39 known possible high prices), I forecast the high price which will be reached over the next 40 days.
This problem is better represented by the following chart.
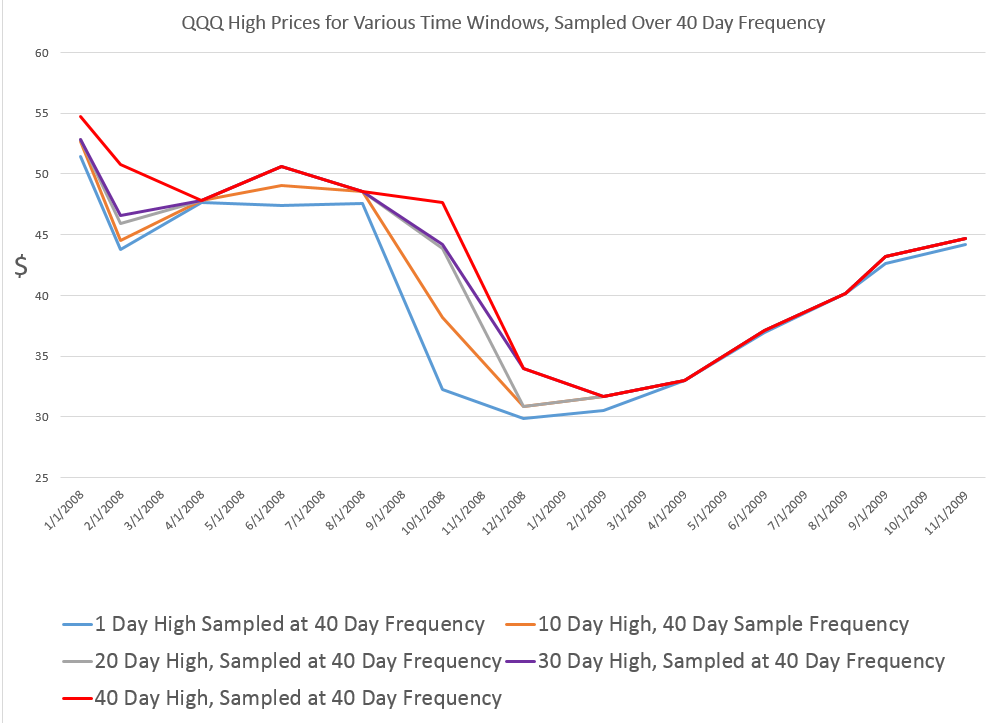
This chart shows the high prices for QQQ over periods ranging from 1 to 40 days, sampled at what you might call “40 day frequencies.”
Now I am not quite going to 40 trading day ahead forecasts yet, but here are results for backtests of the algorithm which produces 20-trading-day-ahead predictions of the high for QQQ.
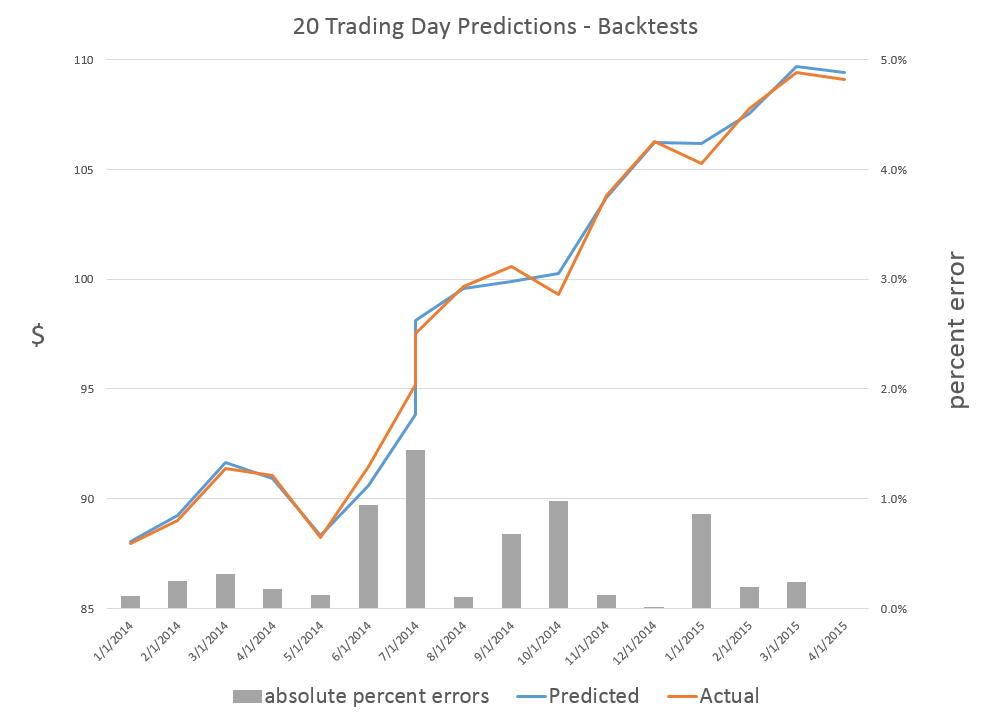
The blue lines shows the predictions for the QQQ high, and the orange line indicates the actual QQQ highs for these (non-overlapping) 20 trading day intervals. As you can see, the absolute percent errors – the grey bars – are almost all less than 1 percent error.
Random Walk
Now, these results are pretty good, and the question arises – what about the random walk hypothesis for stock prices?
Recall that a simple random walk can be expressed by the equation xt=xt-1 + εt where εt is conventionally assumed to be distributed according to N(0,σ) or, in other words, as a normal distribution with zero mean and constant variance σ.
An interesting question is whether the maximum prices for a stock whose prices follow a random walk also can be described, mathematically, as a random walk.
This is elementary, when we consider that any two observations in a time series of random walks can be connected together as xt+k = xt + ω where ω is distributed according to a Gaussian distribution but does not necessarily have a constant variance for different values of the spacing parameter k.
From this it follows that the methods producing these predictions or forecasts of the high of QQQ over periods of several trading days also are strong evidence against the underlying QQQ series being a random walk, even one with heteroskedastic errors.
That is, I believe the predictability demonstrated for these series are more than cointegration relationships.
Where This is Going
While demonstrating the above point could really rock the foundations of finance theory, I’m more interested, for the moment, in exploring the extent of what you can do with these methods.
Very soon I’m going to post on how these methods may provide signals as to turning points in stock market prices.
Stay tuned, and thanks for your comments and questions.
Erdős picture from Encyclopaedia Britannica
Clive, really enjoyed your series of posts on forecasting the markets. Can you shoot me an email? Would like to continue the conversation offline.