I’ve been doing a deep dive into Bayesian materials, the past few days. I’ve tried this before, but I seem to be making more headway this time.
One question is whether Bayesian methods and statistics informed by the more familiar frequency interpretation of probability can give different answers.
I found this question on CrossValidated, too – Examples of Bayesian and frequentist approach giving different answers.
Among other things, responders cite YouTube videos of John Kruschke – the author of Doing Bayesian Data Analysis A Tutorial With R and BUGS
Here is Kruschke’s “Bayesian Estimation Supercedes the t Test,” which, frankly, I recommend you click on after reading the subsequent comments here.
I guess my concern is not just whether Bayesian and the more familiar frequentist methods give different answers, but, really, whether they give different predictions that can be checked.
I get the sense that Kruschke focuses on the logic and coherence of Bayesian methods in a context where standard statistics may fall short.
But I have found a context where there are clear differences in predictive outcomes between frequentist and Bayesian methods.
This concerns Bayesian versus what you might call classical regression.
In lecture notes for a course on Machine Learning given at Ohio State in 2012, Brian Kulis demonstrates something I had heard mention of two or three years ago, and another result which surprises me big-time.
Let me just state this result directly, then go into some of the mathematical details briefly.
Suppose you have a standard ordinary least squares (OLS) linear regression, which might look like,
where we can assume the data for y and x are mean centered. Then, as is well, known, assuming the error process ε is N(0,σ) and a few other things, the BLUE (best linear unbiased estimate) of the regression parameters w is –
 Now Bayesian methods take advantage of Bayes Theorem, which has a likelihood function and a prior probability on the right hand side of the equation, and the resulting posterior distribution on the left hand side of the equation.
What priors do we use for linear regression in a Bayesian approach?
Well, apparently, there are two options.
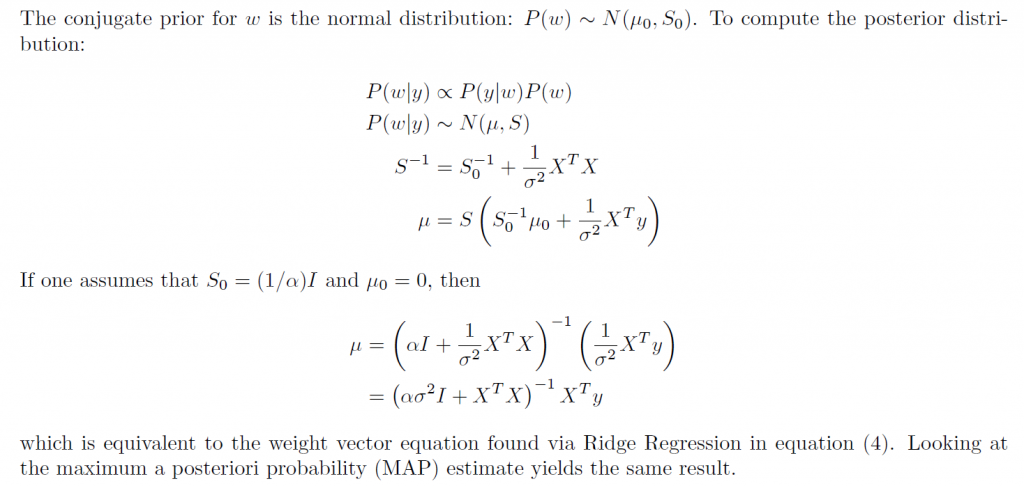
First, suppose we adopt priors for the predictors x, and suppose the prior is a normal distribution – that is the predictors are assumed to be normally distributed variables with various means and standard deviations.
In this case, amazingly, the posterior distribution for a Bayesian setup basically gives the equation for ridge regression.
On the other hand, assuming a prior which is a Laplace distribution gives a posterior distribution which is equivalent to the lasso.
This is quite stunning, really.
Obviously, then, predictions from an OLS regression, in general, will be different from predictions from a ridge regression estimated on the same data, depending on the value of the tuning parameter λ (See the post here on this).
Similarly with a lasso regression – different forecasts are highly likely.
Now it’s interesting to question which might be more accurate – the standard OLS or the Bayesian formulations. The answer, of course, is that there is a tradeoff between bias and variability effected here. In some situations, ridge regression or the lasso will produce superior forecasts, measured, for example, by root mean square error (RMSE).
This is all pretty wonkish, I realize. But it conclusively shows that there can be significant differences in regression forecasts between the Bayesian and frequentist approaches.
What interests me more, though, is Bayesian methods for forecast combination. I am still working on examples of these procedures. But this is an important area, and there are a number of studies which show gains in forecast accuracy, measured by conventional metrics, for Bayesian model combinations.


