Tag Archives: energy forecasting

Do Oil and Gas Futures Forecast Oil and Gas Spot Prices?

I’m looking at evidence that oil and gas futures are useful in forecasting future prices. This is an important for reasons ranging from investment guidance to policy analysis (assessing the role of speculators in influencing current market prices).

So – what are futures contracts, where are they traded, and where do you find out about them?

A futures contract (long position) is an agreement to buy an amount of a commodity (oil or gas) at a specified price at the expiration of the contract. The seller (the party with a short position) agrees to sell the underlying commodity to the buyer at expiration at the fixed sales price. Futures contracts can be traded many times prior to the expiration date.

At the expiration of the contract, if the price of the contract is below the market or spot price at that time, the buyer makes money. Futures contracts also can be used to lock in prices, and hedge risk.

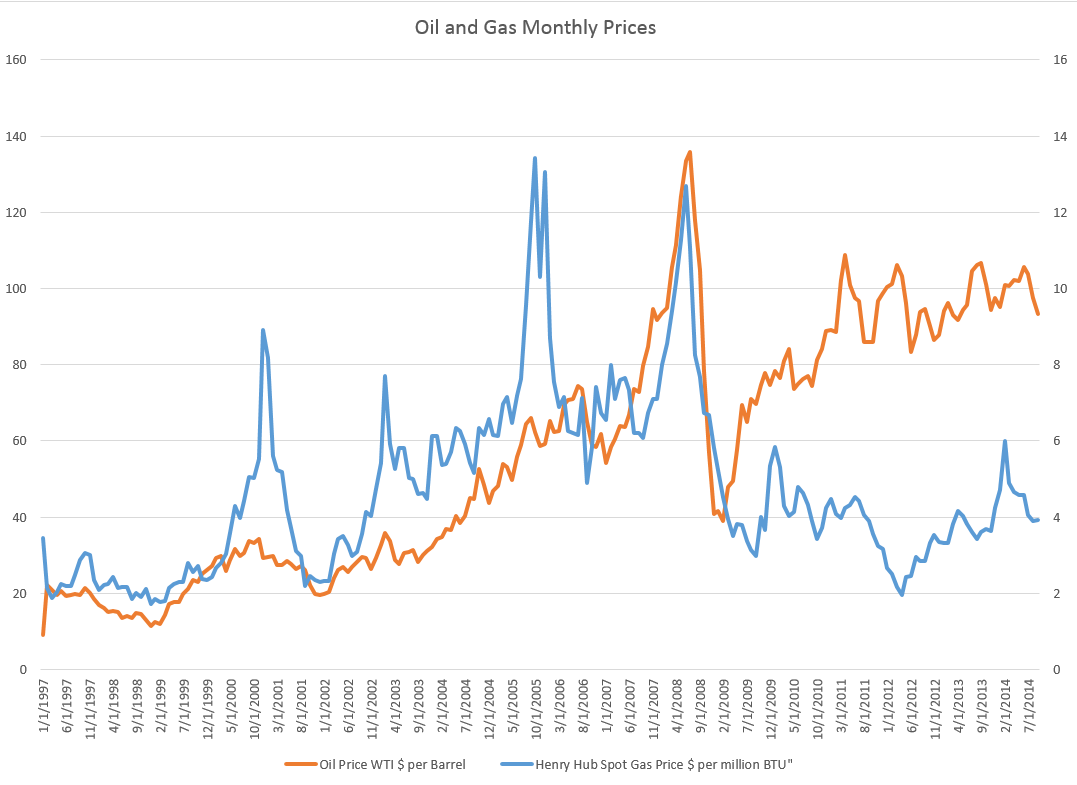
The New York Mercantile Exchange (NYMEX) maintains futures markets for oil and gas. Natural gas futures are based on delivery at the Henry Hub, Louisiana, a major crossroads for natural gas pipelines.

So there are futures contracts for 1 month, 2 month, and so forth, delivery dates.

Evidence Futures Predict Spot Prices

As noted by Menzie Chinn, a popular idea is that the futures price is the optimal forecast of the spot price is an implication of the efficient market hypothesis.

Nevertheless, the evidence for futures prices being unbiased estimators of future spot prices is mixed, despite widespread acceptance of the idea in central banks and the International Monetary Fund (IMF).

A recent benchmark study, Forecasting the Price of Oil, finds –

some evidence that the price of oil futures has additional predictive content compared with the current spot price at the 12-month horizon; the magnitude of the reduction in mean-squared prediction error (MSPE) is modest even at the 12-month horizon, however, and there are indications that this result is sensitive to fairly small changes in the sample period and in the forecast horizon. There is no evidence of significant forecast accuracy gains at shorter horizons, and at the long horizons of interest to policymakers, oil futures prices are clearly inferior to the no-change forecast.

Here, the “no-change forecast” can be understood and is sometimes also referred to as a “random walk forecast.”

Both Chinn and the Forecasting the Price of Oil chapter in the Handbook of Forecasting are good places for readers to check the extensive literature on this topic.

Hands-On Calculation

Forecasting is about computation and calculation, working with real data.

So I downloaded the Contract1 daily futures prices from the US EIA, a source which also provides the Henry Hub spot prices.

Natural gas contracts, for example, expire three business days prior to the first calendar day of the delivery month. Thus, the delivery month for Contract 1 in the US EIA tables is the calendar month following the trade date.

Here is a chart from the spreadsheet I developed.

FuturesDirectionCallChart1

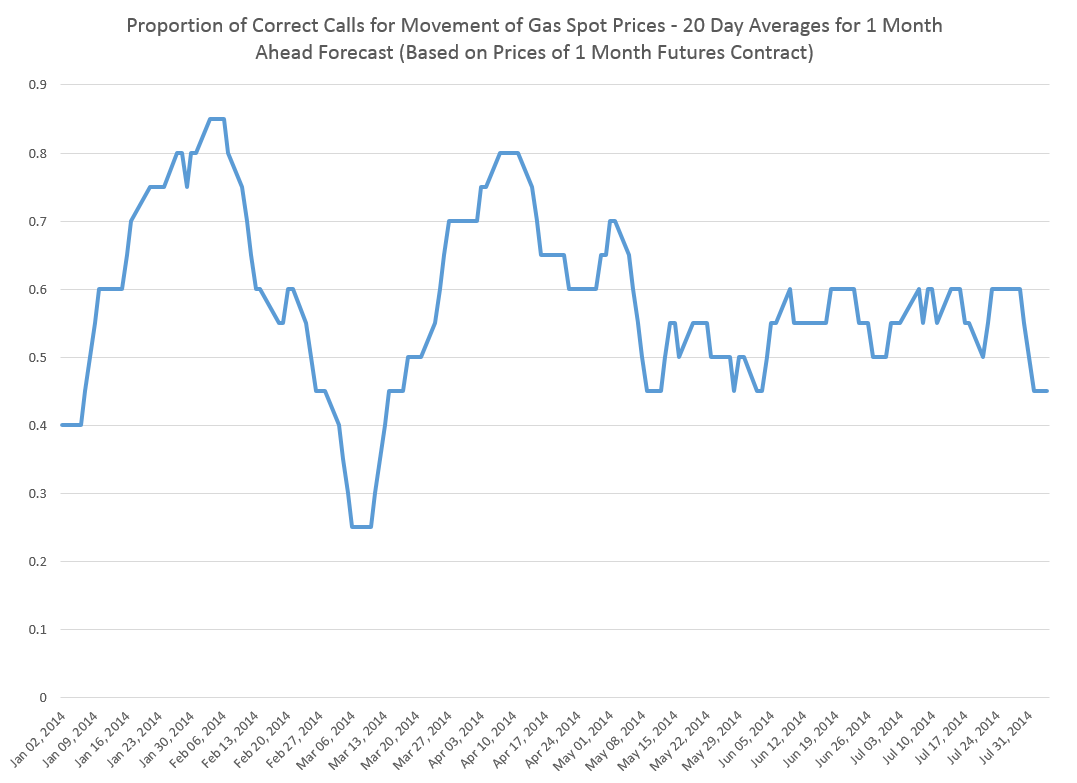
I compared the daily spot prices and 1 month futures contract prices by date to see how often the futures prices correctly indicate the direction of change of the spot price at the settlement or delivery date, three days prior to the first calendar day of the delivery month. So, the April 14, 2014 spot price was $4.64 and the Contract1 futures closing price for that day was $4.56, indicating that the spot price in late May would be lower than the current spot price. In fact, the May 27th spot price was $4.56. So, in this case, not only was the predicted direction of change correct, but also the point estimate of the future spot price.

The chart above averages the performance of these daily forecasts of the future direction of spot prices over rolling 20 trading day windows.

From January through the end of September 2014, these averages score better than 50:50 about 71 percent of the time.

I have not calculated how accurate these one month natural gas futures are per se, but my guess is that the accuracies would be close.

However, clearly, a “no-change forecast” is incapable of indicating the future direction of changes in the gas spot price.

So the above chart and the associated information structure are potentially useful regardless of the point forecast accuracy. My explorations suggest additional information about direction and, possibly, even turning points in price, can be extracted from longer range gas futures contracts.

Speculators and Oil Prices

One of the more important questions in the petroleum business is the degree to which speculators influence oil prices.

CrudeOilSpotPrice

If speculators can significantly move oil spot prices, there might be “overshooting” on the downside, in the current oil price environment. That is, the spot price of oil might drop more than fundamentals warrant, given that spot prices have dropped significantly in recent weeks and the Saudi’s may not reduce production, as they have in the past.

This issue can be rephrased more colorfully in terms of whether the 2008 oil price spike, shown below, was a “bubble,” driven in part by speculators, or whether, as some economists argue, things can be explained in terms of surging Chinese demand and supply constraints.

James Hamilton’s Causes and Consequences of the Oil Shock of 2007–08, Spring 2009, documents a failure of oil production to increase between 2005-2007, and the exponential growth in Chinese petroleum demand through 2007.

Hamilton, nevertheless, admits “the speed and magnitude of the price collapse leads one to give serious consideration to the alternative hypothesis that this episode represents a speculative price bubble that popped.”

Enter hedge fund manager Michael Masters stage left.

In testimony before the US Senate, Masters blames the 2007-08 oil price spike on speculators, and specifically on commodity index trading funds which held a quarter trillion dollars worth of futures contracts in 2008.

Hamilton characterizes Masters’ position as follows,

A typical strategy is to take a long position in a near-term futures contract, sell it a few weeks before expiry, and use the proceeds to take a long position in a subsequent near-term futures contract. When commodity prices are rising, the sell price should be higher than the buy, and the investor can profit without ever physically taking delivery. As more investment funds sought to take positions in commodity futures contracts for this purpose, so that the number of buys of next contracts always exceeded the number of sells of expiring ones, the effect, Masters argues, was to drive up the futures price, and with it the spot price. This “financialization” of commodities, according to Masters, introduced a speculative bubble in the price of oil.

Where’s the Beef?

If speculators were instrumental in driving up oil prices in 2008, however, where is the inventory build one would expect to accompany such activity? As noted above, oil production 2005-2007 was relatively static.

There are several possible answers.

One is simply that activity in the futures markets involve “paper barrels of oil” and that pricing of real supplies follows signals being generated by the futures markets. This is essentially Masters’ position.

A second, more sophisticated response is that the term structure of the oil futures markets changed, running up to 2008. The sweet spot changed from short term to long term futures, encouraging “ground storage,” rather than immediate extraction and stockpiling of inventories in storage tanks. Short term pricing followed the lead being indicated by longer term oil futures. The MIT researcher Parsons makes this case in a fascinating paper Black Gold & Fool’s Gold: Speculation in the Oil Futures Market.

..successful innovations in the financial industry made it possible for paper oil to be a financial asset in a very complete way. Once that was accomplished, a speculative bubble became possible. Oil is no different from equities or housing in this regard.

A third, more conventional answer is that, in fact, it is possible to show a direct causal link from activity in the oil futures markets to oil inventories, despite the appearances of flat production leading up to 2008.

Where This Leads

The uproar on this issue is related to efforts to increase regulation on the nasty speculators, who are distorting oil and other commodity prices away from values determined by fundamental forces.

While that might be a fine objective, I am more interested in the predictive standpoint.

Well, there is enough here to justify collecting a wide scope of data on production, prices, storage, reserves, and futures markets, and developing predictive models. It’s not clear the result would be most successful short term, or for the longer term. But I suspect forward-looking perspective is possible through predictive analytics in this area.

Top graphic from Evil Speculator.

Oil and Gas Prices II

One of the more interesting questions in applied forecasting is the relationship between oil and natural gas prices in the US market, shown below.

OIlGasPrices

Up to the early 1990’s, the interplay between oil and gas prices followed “rules of thumb” – for example, gas prices per million Btu were approximately one tenth oil prices.

There is still some suggestion of this – for example, peak oil prices recently hit nearly $140 a barrel, at the same time gas prices were nearly $14 per million Btu’s.

However, generally, ratio relationships appear to break down around 2009, if not earlier, during the first decade of the century.

A Longer Term Relationship?

Perhaps oil and gas prices are in a longer term relationship, but one disturbed in many cases in short run time periods.

One way economists and ecommetricians think of this is in terms of “co-integrating relationships.” That’s a fancy way of saying that regressions of the form,

Gas price in time t = constant + α(oil price in time t) + (residual in time t)

are predictive. Here, α is a coefficient to be estimated.

Now this looks like a straight-forward regression, so you might say – “what’s the problem?”

Well, the catch is that gas prices and oil prices might be nonstationary – that is, one or another form of a random walk.

If this is so – and positive results on standard tests such as the augmented Dickey Fuller (ADR) and Phillips-Peron are widely reported – there is a big potential problem. It’s easy to regress one completely unrelated nonstationary time series onto another, getting an apparently significant result, only to find this relationship disappears in the forecast. In other words two random series can, by chance, match up to each other over closely, but that’s no guarantee they will continue to do so.

Here’s where the concept of a co-integrating relationship comes into play.

If you can show, by various statistical tests, that variables are cointegrated, regressions such as the one above are more likely to be predictive.

Well, several econometric studies show gas and oil prices are in a cointegrated relationship, using data from the 1990’s through sometime in the first decade of the 2000’s. The more sophisticated specify auxiliary variables to account for weather or changes in gas storage. You might download and read, for example, a study published in 2007 under the auspices of the Dallas Federal Reserve Bank – What Drives Natural Gas Prices?

But it does not appear that this cointegrated relationship is fixed. Instead, it changes over time, perhaps exemplifying various regimes, i.e. periods of time in which the underlying parameters switch to new values, even though a determinate relationship can still be demonstrated.

Changing parameters are shown in the excellent 2012 study by Ramberg and Parsons in the Energy Journal – The Weak Tie Between Natural Gas and Oil Prices.

The Underlying Basis

Anyway, there are facts relating to production and use of oil and natural gas which encourage us to postulate a relationship in their prices, although the relationship may shift over time.

This makes sense since oil and gas are limited or completely substitutes in various industrial processes. This used to be more compelling in electric power generation, than it is today. According to the US Department of Energy, there are only limited amounts of electric power still produced by generators running on oil, although natural gas turbines have grown in importance.

Still, natural gas is often produced alongside of and is usually dissolved in oil, so oil and natural gas are usually joint products.

Recently, technology has changed the picture with respect to gas and oil.

On the demand side, the introduction of the combined-cycle combustion turbine made natural gas electricity generation more cost effective, thereby making natural gas in electric power generation even more dominant.

On the demand side, the new technologies of extracting shale oil and natural gas – often summarized under the rubric of “fracking” or hydraulic fracturing – have totally changed the equation, resulting in dramatic increases in natural gas supplies in the US.

This leaves the interesting question of what sort of forecasting model for natural gas might be appropriate.

Oil and Gas Prices – a “Golden Swan”?

Crude oil prices plummeted last week, moving toward $80/Bbl for West Texas Intermediate (WTI) – the spot pricing standard commodity.

CrudeOilSpotPrice

OPEC – the Organization of Petroleum Exporting Counties – is a key to trajectory of oil prices, accounting for about 40 percent of global oil output.

Media reports that the Saudi Arabian Kingdom, which is the largest producer in OPEC, is advising that it will not cut oil production at the current time. The US Energy Information Agency (EIA) has a graph on its website underlining the importance of Saudi production to global oil prices.

Saudiproductionoilprice

Officially, there is very little in the media to pin down the current Saudi policy, although, off-the-record, Saudi representatives apparently have indicated they could allow crude prices to drift between $80 and $90 a barrel for a couple of years. This could impact higher cost producers, such as Iran and burgeoning North American shale oil production.

At the same time, several OPEC members, such as Venezuela and Libya, have called for cuts in output to manage crude prices going forward. And a field jointly maintained by Saudi Arabia and Kuwait just has been shut down, ostensibly for environmental upgrades.

OPEC’s upcoming November 27 meeting in Vienna, Austria should be momentous.

US Oil Production

Currently, US oil production is running at 8.7 million barrels a day, a million barrels a day higher than in a comparable period of 2013, and the highest level since 1986.

The question of the hour is whether US production can continue to increase with significantly lower oil prices.

Many analysts echo the New York Times, which recently compared throttling back US petroleum activity to slowing a freight train.

Most companies make their investment decisions well in advance and need months to slow exploration because of contracts with service companies. And if they do decide to cut back some drilling, they will pick the least prospective fields first as they continue developing the richest prospects.

At the same time, the most recent data suggest US rig activity is starting to slip.

Economic Drivers

It’s all too easy to engage in arm-waving, when discussing energy supplies and prices and their relationship to the global economy.

Of course, we have supply and demand, as one basis. Supplies have been increasing, in part because of new technologies in US production and Libyan production coming back on line.

Demands have not been increasing, on the other hand, as rapidly as in the past. This reflects slowing growth in China and continuing energy conservation.

One imponderable is the influence of speculators on oil prices. Was there a “bubble” before 2009, for example, and could speculators drive oil prices significantly lower in coming months?

Another factor that is hard to assess is whether 2015 will see a recession in major parts of the global economy.

The US Federal Reserve has been planning on eliminating Quantitative Easing (QE) – its program of long-term bond purchases – and increasing the federal funds rate from its present level of virtually zero. Many believe that these actions will materially slow US and global economic growth. Coupled with the current deflationary environment in Europe, there have been increasing signs that factors could converge to trigger a recession sometime in 2015.

However, low energy prices usually are not part of the prelude for a recession, although they can develop after the recession takes hold.

Instead, prices at the pump in the US could fall below $3.00 a gallon, providing several hundred dollars extra in discretionary income over the course of a year. This, just prior to the Christmas shopping season.

So – if US oil production continues to increase and prices at the pump fall below $3.00, there will be jobs and cheap gas, a combination likely to forstall a downturn, at least in the US for the time being.

Top image courtesy of GameDocs

Energy Forecasts – Parting Shots

There is obviously a big difference between macro and micro, when it comes to energy forecasting.

At the micro-level – for example, electric utility load forecasting – considerable precision often can be attained in the short run, or very short run, when seasonal, daily, and holiday usage patterns are taken into account.

At the macro level, on the other hand – for global energy supply, demand, and prices – big risks are associated with projections beyond a year or so. Many things can intervene, such as supply disruptions which in 2013, occurred in Nigeria, Iraq, and Lybia. And long range energy forecasts – forget it. Even well-funded studies with star researchers from the best universities and biggest companies show huge errors ten or twenty years out (See A Half Century of Long-Range Energy Forecasts: Errors Made, Lessons Learned, and Implications for Forecasting).

Peak Oil

This makes big picture concepts such as peak oil challenging to evaluate. Will there be a time in the future when global oil production levels peak and then decline, triggering a frenzied search for substitutes and exerting pressure on the whole structure of civilization in what some have called the petrochemical age?

Since the OPEC Oil Embargo of 1974, there have been researchers, thinkers, and writers who point to this as an eventuality. Commentators and researchers associated with the post carbon institute carry on the tradition.

Oil prices have not always cooperated, as the following CPI-adjusted price of crude oil suggests.

oilprice

The basic axiom is simply that natural resource reserves and availability are always conditional on price. With high enough prices, more oil can be extracted from somewhere – from deeper wells, from offshore platforms that are expensive and dangerous to erect, from secondary recovery, and now, from nonconventional sources, such as shale oil and gas.

Note this axiom of resource economics does not really say that there will never be a time when total oil production begins to decline. It just implies that oil will never be totally exhausted, if we loosen the price constraint.

Net Energy Analysis

Net energy analysis provides a counterpoint to the peak oil conversation. In principle, we can calculate the net energy contributions of various energy sources today. No forecasting is really necessary. Just a deep understanding of industrial process and input-output relationships.

Along these lines, several researchers and again David Hughes with the post carbon institute project that the Canadian tar sands have a significantly lower net energy contribution that, say, oil from conventional wells.

Net energy analysis resembles life cycle cost analysis, which has seen widespread application in environmental assessment. Still neither technique is foolproof, or perhaps I should say that both techniques would require huge research investments, including on-site observation and modeling, to properly implement.

Energy Conservation

Higher energy prices since the 1970’s also have encouraged increasing energy efficiency. This is probably one of the main reasons why long range energy projections from, say, the 1980’s usually look like wild overestimates by 2000.

The potential is still there, as a 2009 McKinsey study documents –

The research shows that the US economy has the potential to reduce annual non-transportation energy consumption by roughly 23 percent by 2020, eliminating more than $1.2 trillion in waste—well beyond the $520 billion upfront investment (not including program costs) that would be required. The reduction in energy use would also result in the abatement of 1.1 gigatons of greenhouse-gas emissions annually—the equivalent of taking the entire US fleet of passenger vehicles and light trucks off the roads.

The McKinsey folks are pretty hard-nosed, tough-minded, not usually given to gross exaggerations.

A Sense In Which We May Already Have Reached Peak Oil

Check this YouTube out. Steven Kopits’ view of supply-constrained markets in oil is novel, but his observations about dollar investment to conventional oil output seem to hit the mark. The new oil production is from the US in large part, and comes from nonconventional sources, i.e. shale oil. This requires more effort, as witnessed by the poor financials of a lot of these players, who are speculating on expansion of export markets, but who would go bust at current domestic prices.

For Kopits slides go here. Check out these graphs from the recent BP report, too.

Global Energy Forecasting Competitions

The 2012 Global Energy Forecasting Competition was organized by an IEEE Working Group to connect academic research and industry practice, promote analytics in engineering education, and prepare for forecasting challenges in the smart grid world. Participation was enhanced by alliance with Kaggle for the load forecasting track. There also was a second track for wind power forecasting.

Hundreds of people and many teams participated.

This year’s April/June issue of the International Journal of Forecasting (IJF) features research from the winners.

Before discussing the 2012 results, note that there’s going to be another competition – the Global Energy Forecasting Competition 2014 – scheduled for launch August 15 of this year. Professor Tao Hong, a key organizer, describes the expansion of scope,

GEFCom2014 (www.gefcom.org) will feature three major upgrades: 1) probabilistic forecasts in the form of predicted quantiles; 2) four tracks on demand, price, wind and solar; 3) rolling forecasts with incremental data update on weekly basis.

Results of the 2012 Competition

The IJF has an open source article on the competition. This features a couple of interesting tables about the methods in the load and wind power tracks (click to enlarge).

hload

The error metric is WRMSE, standing for weighted root mean square error. One week ahead system (as opposed to zone) forecasts received the greatest weight. The top teams with respect to WRMSE were Quadrivio, CountingLab, James Lloyd, and Tololo (Électricité de France).

wind

The top wind power forecasting teams were Leustagos, DuckTile, and MZ based on overall performance.

Innovations in Electric Power Load Forecasting

The IJF overview article pitches the hierarchical load forecasting problem as follows:

participants were required to backcast and forecast hourly loads (in kW) for a US utility with 20 zones at both the zonal (20 series) and system (sum of the 20 zonal level series) levels, with a total of 21 series. We provided the participants with 4.5 years of hourly load and temperature history data, with eight non-consecutive weeks of load data removed. The backcasting task is to predict the loads of these eight weeks in the history, given actual temperatures, where the participants are permitted to use the entire history to backcast the loads. The forecasting task is to predict the loads for the week immediately after the 4.5 years of history without the actual temperatures or temperature forecasts being given. This is designed to mimic a short term load forecasting job, where the forecaster first builds a model using historical data, then develops the forecasts for the next few days.

One of the top entries is by a team from Électricité de France (EDF) and is written up under the title GEFCom2012: Electric load forecasting and backcasting with semi-parametric models.

This is behind the International Journal of Forecasting paywall at present, but some of the primary techniques can be studied in a slide set by Yannig Goulde.

This is an interesting deck because it maps key steps in using semi-parametric models and illustrates real world system power load or demand data, as in this exhibit of annual variation showing the trend over several years.

trend

Or this exhibit showing annual variation.

annual

What intrigues me about the EDF approach in the competition and, apparently, more generally in their actual load forecasting, is the use of splines and knots. I’ve seen this basic approach applied in other time series contexts, for example, to facilitate bagging estimates.

So these competitions seem to provide solid results which can be applied in a real-world setting.

Top image from Triple-Curve

Geopolitical Risk

USA Today has a headline today What Wall Street is watching in Ukraine crisis and a big red strip across the top of the page with Breaking News Russia issues surrender ultimatum to Ukrainian forces in Crimea.

But the article itself projects calming thoughts, such as,

History also shows that market shocks caused by war, terrorism and other fear-rattling events tend to be short-lived.

In 14 shocks dating back to the attack on Pearl Harbor in December 1941, the median one-day decline has been 2.4%. And the shocks, which also include the Sept. 11 terror attacks and the 1962 Cuban missile crisis, lasted just eight days, with total losses of 7.4%, data from S&P Capital IQ show. The market recouped its losses 14 days later.

Similarly, the Economist February 26 ran an article The return of geopolitical risk noting that,

If there is a consensus, it is probably that geopolitical risks have a tendency to go away. Think back over the last 24 years, going all the way back to the Kuwait crisis, and you will recall that markets sold off initially but recovered as the conflicts turned out either to be shorter, or less economically damaging, than they feared. Hence, while the markets have sold off today, the declines have hardly been substantial (between 0.8% and for the FTSE and 1.4% for the Dax at the time of writing).

Professional organizations in the geopolitical risk space offer to provide information to companies operating in risk-prone areas or with vital interests in, say, natural gas markets globally.

One of these is Stratfor, founded by George Friedman in 1996, with subscription services and reports for purchase by business and other organizations. For the interested, here is a friendly but critical review of Friedman’s supposedly best-selling The Next 100 Years: A Forecast for the 21st Century (2009). Friedman actually predicts the disintegration of Russia in the 2020’s, following a re-assertion of Russian power westward, toward Europe. Hmmm.

Currently, Stratfor is highlighting the potential for the emergence of extreme right-wing groups in the Ukraine. This is a similar focus to one developed in an excellent article in Le Monde Diplomatique Ukraine beyond politics.

I don’t want to comment too extensively on the US role in the Ukraine, or the inevitable saber-rattling and accusations that not enough is being done.

Rather, I think it’s important to look at one particular graphic, presented initially by Business Insider and extensively tweeted thereafter.

Ukrainegas

So from a purely predictive standpoint, it seems unlikely the United States can originate and see implemented significant economic sanctions against Russia – since then, clearly, Russia has the power to retaliate through its control of significant natural gas supplies for western Europe.

The risk – plunging western Europe back into recession, again threatening the US economic recovery.

Economic rationality may provide some constraints to wild responses and actions, but the low performance of many economies since 2009 creates a fertile environment for the emergence of hot-heads, demagogues, and madmen.

So, what I guess I worry about is that the general geopolitical dynamics seem to be moving into greater and greater vulnerability to some idiotic minor event which functions as a tipping point.

But then again, the markets may go forth to a new stabilization very shortly, and it will be business as usual, with more than a modicum of background noise from politics.