I’ve been looking at forecasting interest rates, the accuracy of interest rate forecasts, and teasing out predictive information from the yield curve.
This literature can be intensely theoretical and statistically demanding. But it might be quickly summarized by saying that, for horizons of more than a few months, most forecasts (such as from the Wall Street Journal’s Panel of Economists) do not beat a random walk forecast.
At the same time, there are hints that improvements on a random walk forecast might be possible under special circumstances, or for periods of time.
For example, suppose we attempt to forecast the 30 year fixed mortgage rate monthly averages, picking a six month forecast horizon.
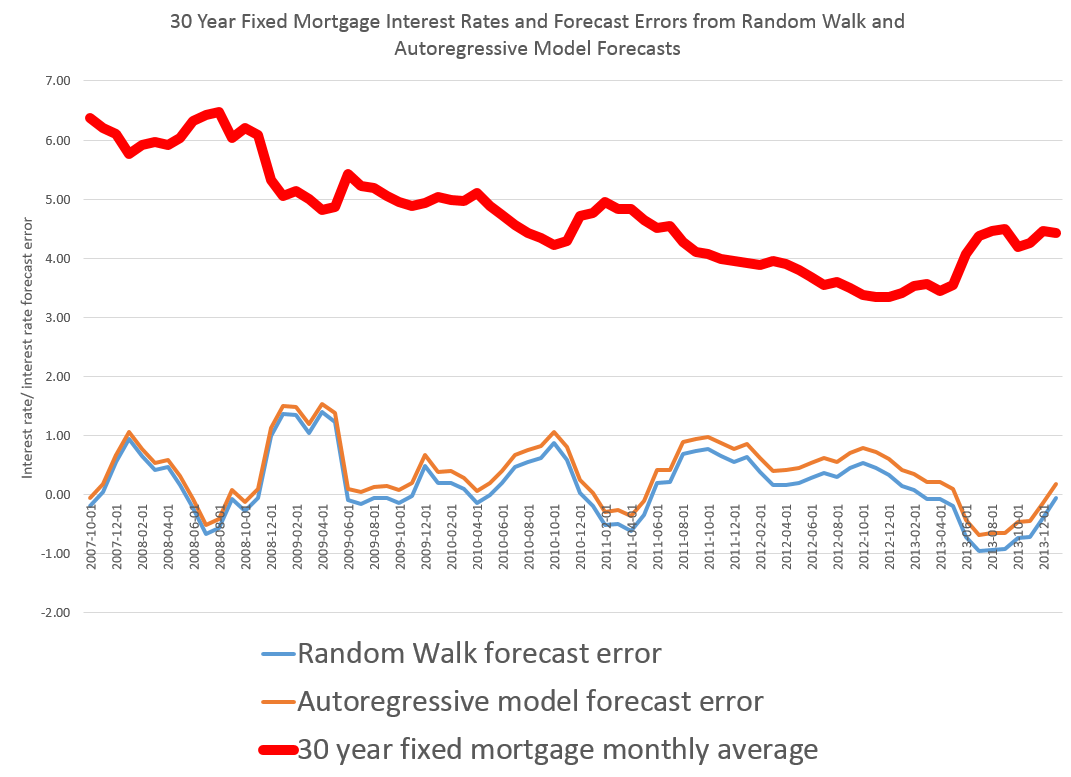
The following chart compares a random walk forecast with an autoregressive (AR) model.
Let’s dwell for a moment on some of the underlying details of the data and forecast models.
The thick red line is the 30 year fixed mortgage rate for the prediction period which extends from 2007 to the most recent monthly average in 2014 in January 2014. These mortgage rates are downloaded from the St. Louis Fed data site FRED.
This is, incidentally, an out-of-sample period, as the autoregressive model is estimated over data beginning in April 1971 and ending September 2007. The autoregressive model is simple, employing a single explanatory variable, which is the 30 year fixed rate at a lag of six months. It has the following form,
rt = k + βrt-6
where the constant term k and the coefficient β of the lagged rate rt-6 are estimated by ordinary least squares (OLS).
The random walk model forecast, as always, is the most current value projected ahead however many periods there are in the forecast horizon. This works out to using the value of the 30 year fixed mortgage in any month as the best forecast of the rate that will obtain six months in the future.
Finally, the errors for the random walk and autoregressive models are calculated as the forecast minus the actual value.
When an Autoregressive Model Beats a Random Walk Forecast
The random walk errors are smaller in absolute value than the autoregressive model errors over most of this out-of-sample period, but there are times when this is not true, as shown in the graph below.

This chart itself suggests that further work could be done on optimizing the autoregressive model, perhaps by adding further corrections from the residuals, which themselves are autocorrelated.
However, just taking this at face value, it’s clear the AR model beats the random walk forecast when the direction of interest rates changes from a downward movement.
Does this mean that going forward, an AR model, probably considerably more sophisticated than developed for this exercise, could beat a random walk forecast over six month forecast horizons?
That’s an interesting and bankable question. It of course depends on the rate at which the Fed “withdraws the punch bowl” but it’s also clear the Fed is no longer in complete control in this situation. The markets themselves will develop a dynamic based on expectations and so forth.
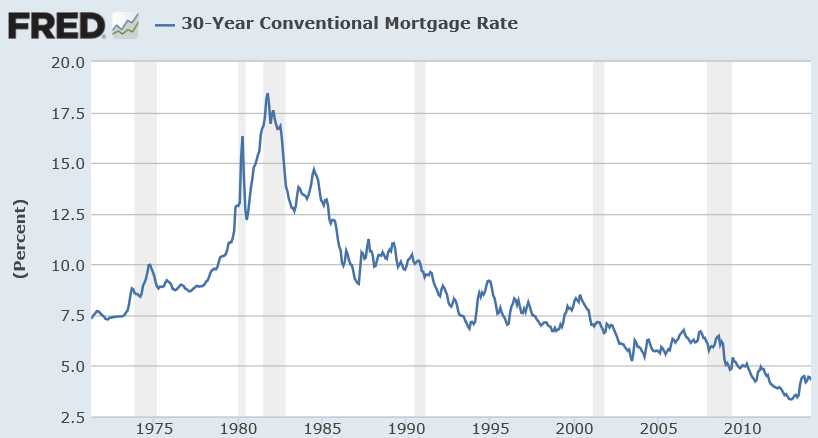
In closing, for reference, I include a longer picture of the 30 year fixed mortgage rates, which as can be seen, resemble the whole spectrum of rates in having a peak in the early 1980’s and showing what amounts to trends before and after that.