Tag Archives: Global Business Forecasts

Future Scenarios

An item from ETF Daily News caught my eye. It’s a post from Tyler Durden Lord Rothschild Warns Investors: Geopolitical Situation Most Dangerous Since WWII.

Lord Rothschild is concerned about the growing military conflict in eastern Europe and the mid-east, deflation and economic challenge in Europe, stock market prices moving above valuations, zero interest rates, and other risk prospects.

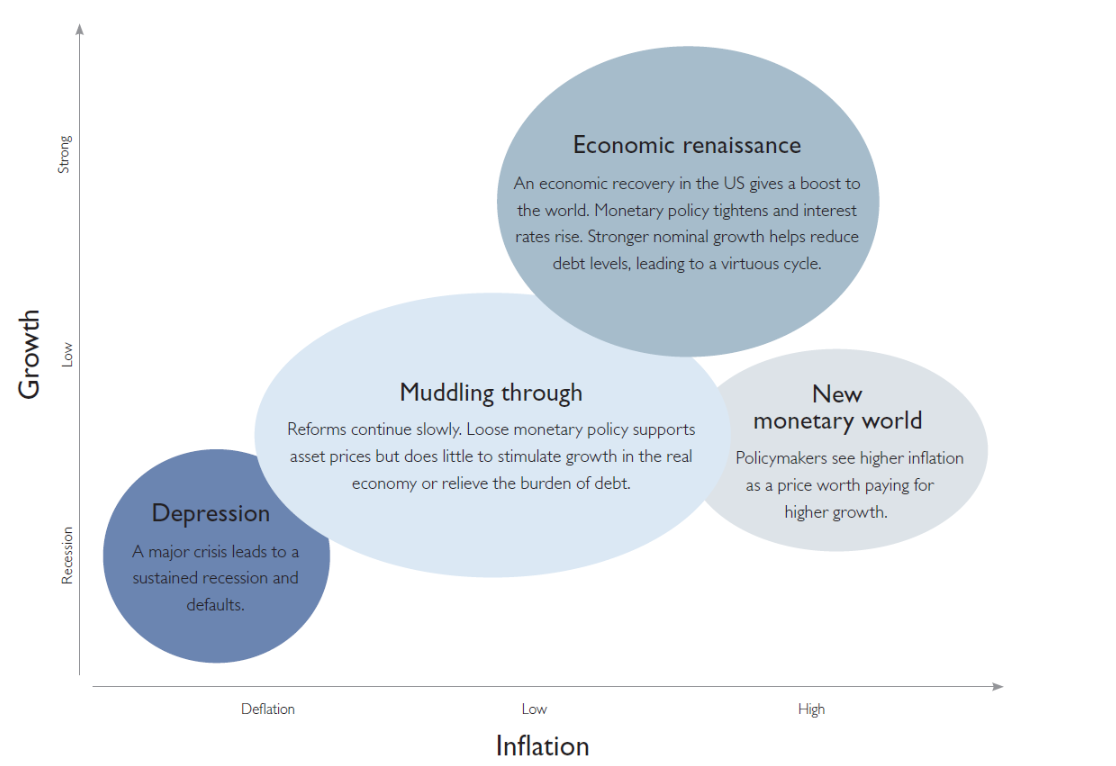
Durden has access to some advisory document associated with Rothschild which features two interesting exhibits.

There is this interesting graphic highlighting four scenarios for the future.

R2

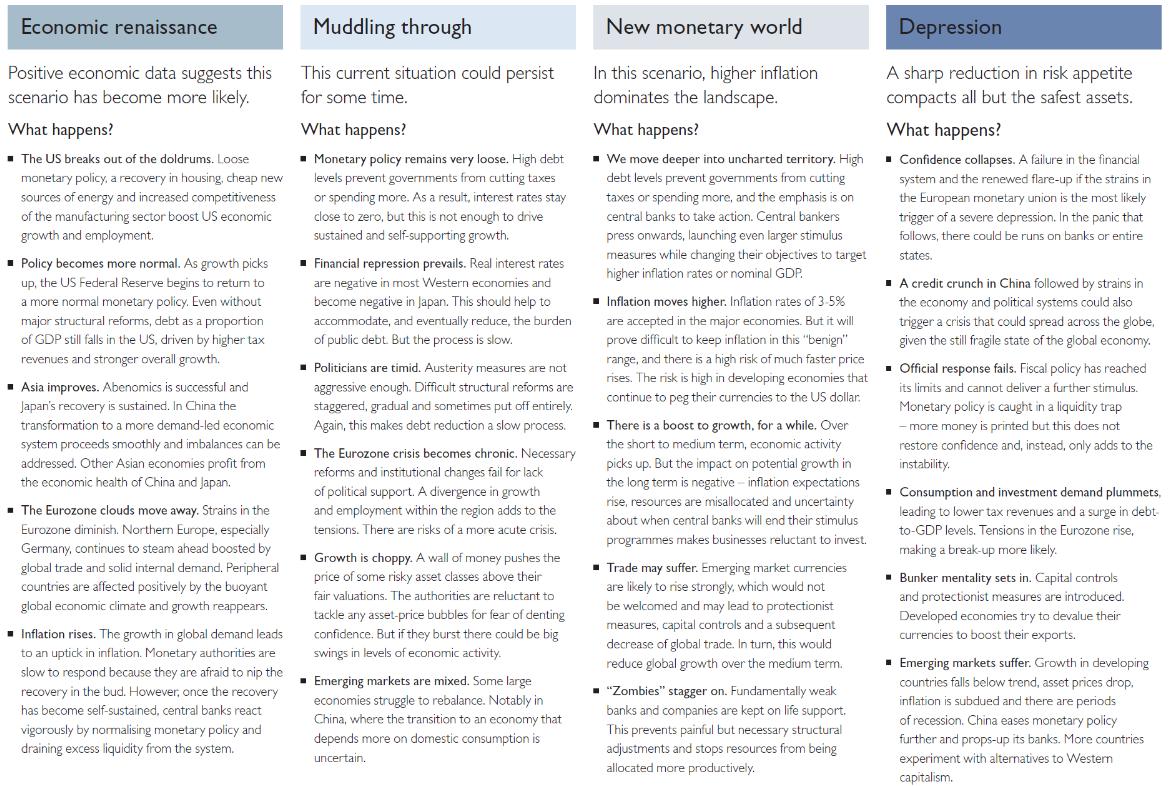
And there are details, as follows, for each scenario (click to enlarge).

RSheet

If I am not mistaken, these exhibits originate from last year at this time.

Think of them then as forecasts, and what has actually happened since they were released, as the actual trajectory of events.

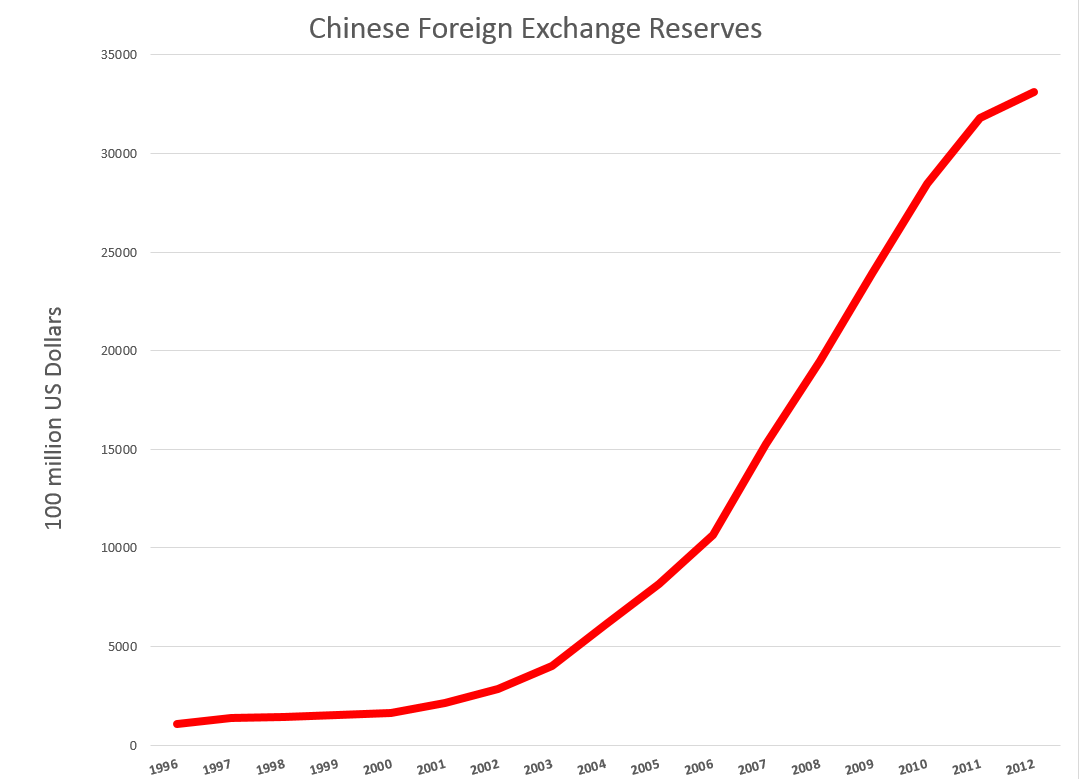
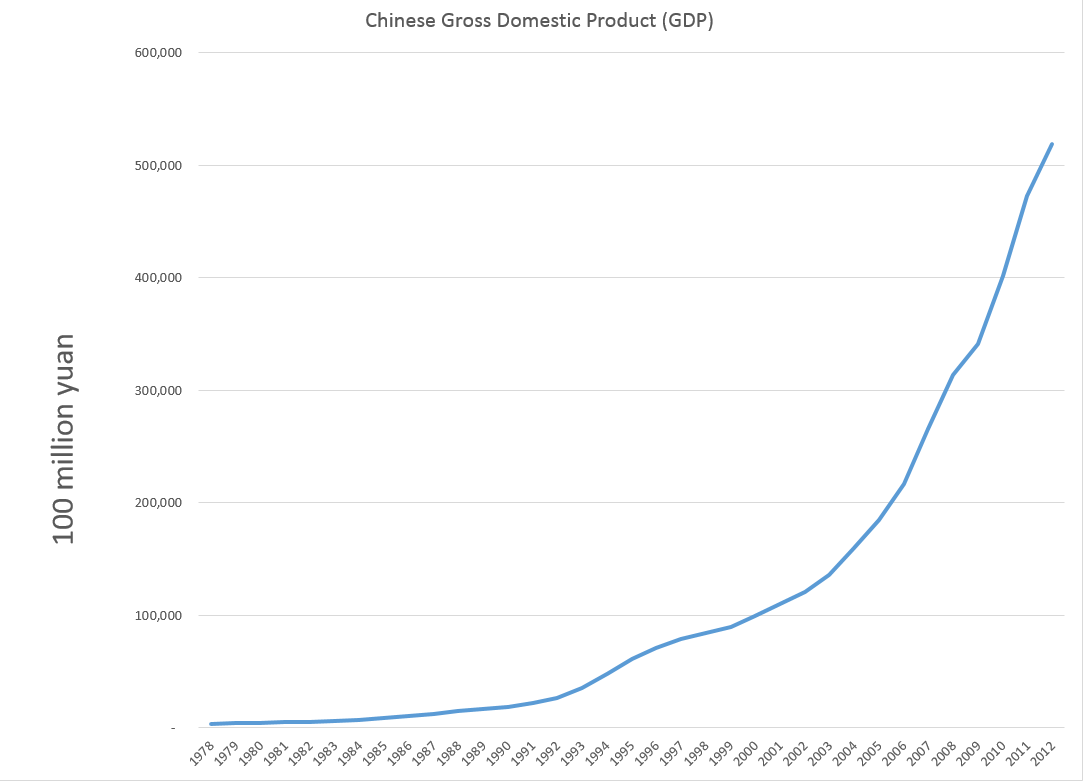
For example, we have been in the “Muddling through” scenario. Monetary policy has remained “very loose,” and real interest rates have remained negative. We have even seen negative nominal interest rates being explored by, for example, the European Central Bank (ECB) – charging banks for maintaining excess reserves, rather than putting them into circulation. Emerging markets certainly are mixed, with confusing signals coming out of China. Growth has been choppy – witness quarterly GDP growth in the US recently – weak and then strong. And one could argue that stagnation has become more or less endemic in Europe with signs of real deflation.

It is useful to decode “structural reform” in the above exhibit. I believe this refers to eliminating protections and rules governing labor, I suppose, to follow a policy of general wage reduction in the idea that European production then could again become competitive with China.

One thing is clear to me pertaining to these scenarios. Infrastructure investment at virtually zero interest rates is no brainer in this economic context, especially for Europe. Also, there is quite a bit of infrastructure investment which can be justified as a response to, say, rising sea levels or other climate change prospects.

This looks to be on track to becoming a very challenging time. The uproar over Iranian nuclear ambitions is probably a sideshow compared to the emerging conflict between nuclear powers shaping up in the Ukraine. A fragile government in Pakistan, also, it must be remembered, has nuclear capability. For more on the growing nuclear threat, see the recent Economist article cited in Business Insider.

In terms of forecasting, the type of scenario formulation we see Rothschild doing is going to become a mainstay of our outlook for 2015-16. There are many balls in the air.

The Greek Conundrum

I’ve been focused on stock price forecast models, recently, and before that, on dynamics of oil prices.

However, it’s clear that almost any global market these days can be affected by developments in Europe.

There’s an excellent backgrounder to the crisis over restructuring Greek debt. See Greece, Its International Competitors and the Euro by the Turkish financial analyst T. Sabri Öncü – a PDF from the Economic and Political Weekly, an Indian Journal.

According to Öncü, the Greeks got in trouble with loans to finance consumption and nonproductive spending, when and after they joined the Eurozone in 2001. The extent of the problem was masked by accounting smoke and mirrors, only being revealed in 2009. Since then “bailouts” from European banking authorities have been designed to insure steady repayment of this debt to German and French banks, among others, although some Greek financial parties have benefited also.

Still, as Öncü writes,

Fast forward to today, despite two bailouts and adjustment programmes Greece has been in depression since the beginning of 2009. The Greece’s GDP is down about 25% from its peak in 2008, unemployment is at about 25%, youth unemployment is above 50%, Greece’s public debt to GDP ratio is at about a mind-boggling 175% and many Greeks are lining up for soup in front of soup kitchens reminiscent of the soup kitchens of the Great Depression of 1929.

As this post is written, negotiations between the new Syrizia government and European authorities have broken down, but here is an interesting video outlining the opposing positions, to an extent, prior to Monday.

Bruegel’s Interview: Debt Restructuring & Greece

Austerity is on the line here, since it seems clear Greece can never repay its debts as currently scheduled, even with imposing further privations on the Greek population.

Senator Rand Paul and the State of the Union Address

This is an exciting time for forecasters!

That might evoke the Chinese, “May you live in interesting times” – actually a curse.

But the fact is that things are on a knife edge in the US, Europe, China and Japan, not to mention other countries around the world.

And the political season is coming up again. The Christmas season now starts just after Halloween, and the Presidential campaign season begins two years or more before the General Election in the US.

Well, I think Senator Rand Paul of Kentucky is one of the most interesting prospective Presidential candidates, and I found his response to President Obama’s State of the Union speech yesterday super interesting (and I don’t necessarily agree with everything he says).

Senator Paul manages to at the one and the same time (1) call for repeal of the Affordable Care Act, aka Obamacare, (2) call for an audit of the Pentagon, (3) suggest the US is too interventionist in the Middle East, where conflicts go back “1000 years,” (4) suggest that we may be in for a repeat of 2008, so better get our fiscal house in order, (5) mention Ferguson and other police problems, and (6) call for tax cuts and cuts in government spending.

Maybe it’s spending many years working in high tech and software on the West Coast – but I’ve got to say the Libertarian perspective is refreshing.

So reader responses to Senator Paul’s speech are welcome. Again, I am not advocating each and every point, Dr. Paul makes – I put it out there as food for thought, however.

Meanwhile, I am working on some deep analysis which I think you will enjoy. Can’t just be a talking head. Got to do the numbers. 


More on the Price of Oil

James Hamilton firms up the role for demand factors behind the free fall in oil prices in Supply, demand and the price of oil. This Econbrowser post also features a great chart for the global supply curve for crude oil – highlighting the geographic spread of oil production costs.

LongRunOilSupplyCurve

Hamilton notes (a) the International Energy Agency current estimate of world oil demand growth for 2014:Q3 is 800,000 barrels/day below what the IEA projected as of last June, (b) continuing improvements in the fuel economy of new cars sold in the US, (c) aging populations in the US drive less, and (d) US labor force participation is on a longer trend downward, and, again, unemployed persons drive less.

At the same time, US shale oil production materially contributes to the global oil glut at present.

IEA demand and supply projections are contained in the Oil Market Report – which features this interesting graphic.

OMR

Note the large gap between demand (yellow line) and supply (green line) in early 2015 of about 2 million barrels per day (mb/d).

In a piece for OilPrice.com Euan Means does up a lot of supply-demand charts, such as the one below, in Oil Price Scenarios For 2015 And 2016.

SDOil

One point seems to jump out from these discussions.

This is that the supply curve for oil rises steeply at a certain point – as is validated from the geographic production cost curve presented initially in this post.

This means demand does not have to change very much to result in big changes in price, and that peak oil is probably still a relevant concept, despite the current glut of supply on the market.

Wither the Price of Oil?

Crude oil futures continue their descent, as the chart below from January 2, 2015 shows.

oilfuturesJan215

What is going to happen here?

Discussions organize around several issues, pretty well nailed recently by IMF bloggers (including Chief Economist Oliver Blanchard) in Seven Questions About The Recent Oil Price Slump.

  1. What are the respective roles of demand and supply factors?
  2. How persistent is this supply shift likely to be?
  3. What are the effects likely to be on the global economy?
  4. What are likely to be the effects on oil importers?
  5. What are likely to be the effects on oil exporters?
  6. What are the financial implications?
  7. What should be the policy response of oil importers and exporters?

The first point to note is the drop in oil prices involves both supply and demand – and is not just the result of increased pumping by Saudi Arabia.

The IMF discussion includes this interesting comparison between oil and other commodity price indices.

commoditypriceindeices

So over 2014, there have been drops in other commodity prices – probably due to weakened global demand – but not nearly much as oil.

Overall, the IMF counts lower oil prices as a net positive to the global economy, resulting in a gain for world GDP between 0.3 and 0.7 percent in 2015, compared to a scenario without the drop in oil prices.

There are big losers, of course. These include oil exporters with higher production costs, such as Russia, Iran, and Venezuela.

To take some examples, energy accounts for 25 percent of Russia’s GDP, 70 percent of its exports, and 50 percent of federal revenues. In the Middle East, the share of oil in federal government revenue is 22.5 percent of GDP and 63.6 percent of exports for the Gulf Cooperation Council countries. In Africa, oil exports accounts for 40-50 percent of GDP for Gabon, Angola and the Republic of Congo, and 80 percent of GDP for Equatorial Guinea. Oil also accounts for 75 percent of government revenues in Angola, Republic of Congo and Equatorial Guinea. In Latin America, oil contributes respectively about 30 percent and 46.6 percent to public sector revenues, and about 55 percent and 94 percent of exports for Ecuador and Venezuela.[8] This shows the dimension of the challenge facing these countries.

How long the Saudi’s can hold the line, maintaining higher production? Is it true, for example, that Saudi Arabia has a $750bn war chest of foreign currency reserves that will be burned through quickly by propping up the shortfall in export revenues? There are speculations that the health of King Abdullah, a strong supporter of the current Saudi Oil Minister, could come into play in coming months.

Interestingly, low oil prices maintained long enough could be self-correcting. This is probably the bet the Saudi’s are making – that their policy can eventually trigger faster growth and enable them to maintain or increase their market share.

As I’ve said before, I think it’s a game changer. The trick is to figure out the linkages and connections, backwards and forwards along the supply chains.

Image of King Abdullah from Telegraph.

The Gift of Low Oil Prices

Oil May Drop top $20 a Barrel

At the end of last week, Anatole Kaletsky wrote an insightful piece for Reuters – The reason oil could drop as low as $20 per barrel.

Kaletsky writes,

There are several reasons to expect a new trading range as low as $20 to $50, as in the period from 1986 to 2004. Technological and environmental pressures are reducing long-term oil demand and threatening to turn much of the high-cost oil outside the Middle East into a “stranded asset” similar to the earth’s vast unwanted coal reserves. Additional pressures for low oil prices in the long term include the possible lifting of sanctions on Iran and Russia and the ending of civil wars in Iraq and Libya, which between them would release additional oil reserves bigger than Saudi Arabia’s on to the world markets.

The U.S. shale revolution is perhaps the strongest argument for a return to competitive pricing instead of the OPEC-dominated monopoly regimes of 1974-85 and 2005-14. Although shale oil is relatively costly, production can be turned on and off much more easily – and cheaply – than from conventional oilfields. This means that shale prospectors should now be the “swing producers” in global oil markets instead of the Saudis. In a truly competitive market, the Saudis and other low-cost producers would always be pumping at maximum output, while shale shuts off when demand is weak and ramps up when demand is strong. This competitive logic suggests that marginal costs of U.S. shale oil, generally estimated at $40 to $50, should in the future be a ceiling for global oil prices, not a floor.

As if in validation of this perspective, Sheik Ali al-Naimi, the Saudi Oil Minister, is quoted in an interview at the beginning of this week

“It is not in the interest of Opec producers to cut their production, whatever the price is … Whether it goes down to $20, $40, $50, $60, it is irrelevant.”

Also, Mr Naimi said that if Saudi Arabia reduced its production, “the price will go up and the Russians, the Brazilians, US shale oil producers will take my share”.

Higher Cost Oil Producers Impacted

Estimates of the cost to the Saudi’s for extracting their oil out of the ground seem to be plummeting, along with the spot price of a barrel of crude. The above interview cited by the Financial Times also asserts that Saudi and other Gulf States can extract at $4-$5 a barrel.

That is an order of magnitude less than the production costs of oil from many US shale plays, much of the North Sea oil supplying revenues to Norway and the UK, as well as Russian and Iranian oil.

Here is a chart from the Wall Street Journal from late October of this year, estimating production costs in US shale oil plays (click to enlarge).

USSalePC

The rig count has been dropping, but many expect US shale oil production to continue increasing, as companies optimize existing wells and drill as long as already secured futures contracts cover output.

Given the low growth to deflationary profile in the global economy, this probably means a glut of petroleum on world markets for 2015 and, possibly, 2016.

Implications of a Period of Significantly Lower Oil Prices

The price of gasoline at the pump in the US is plummeting.

regulargasprice

First-order effects for the American consumer probably more than balance the short-run negative impacts of cutbacks in the oil or shale patch. The typical household gets on the order of $100 extra in their pocket monthly, as long as the low prices continue. This is discretionary money that would have in all likelihood be spent anyway. So other products will benefit, plus people will drive more. It’s as simple as that.

China may be a major beneficiary, since its production is relatively energy-intensive and it is a net importer of petroleum products.

Japan should also benefit significantly.

In Japan, which imports energy (all at prices based on crude oil) worth roughly 6% of GDP, the recent sharp price drop could lift real GDP growth by 1.5%–2%! This would largely offset the 3% hike in VAT imposed last year – or justify the second round 2% hike that was just cancelled. The drop in oil prices may save Abe short term, but it will also put at risk both the 3% inflation goal and the need to turn nuclear facilities back on.

Going Out on a Limb – Business Forecast Blog Prediction

OK, so I’m going out on a limb here and make the following prediction.

As long as there is no banking collapse, as a result of oil companies turning the junk bonds that financed their land purchases into true junk, or the Russian economy collapsing, dragging down the European banking system – all bets are off for a recession in 2015 and probably 2016.

These low oil prices are like a gift to many of the world’s economies, as well as many families reliant on the internal combustion engine to get them to and from work. Low oil prices also should help keep the cost of agricultural products down, again benefitting consumers.

My intuition is that this is a real game changer.

Top graphic from Wall Street Daily

Economic Outlook 2015 – I

Well, it’s that time – end of one calendar year and, soon, the beginning of another, and that means major banks and financial institutions are releasing their big picture “economic outlooks” for 2015.

Here are two well worth watching.

Jan Hatzius of Goldman Sachs provides an interesting, short discussion of the US economic outlook for 2015.

Huw Pills, also of Goldman Sachs, gives a nuanced discussion of Europe’s more vulnerable economic position for 2015.

For other regions, see Outlook 2015.

Barron’s Outlook 2015: Stick With the Bull focuses on stocks and is based on a survey of investment advisors; its outlook is decidedly upbeat.

Born in March 2009, today’s bull market is the fourth longest in history—and it isn’t about to end, despite last week’s shellacking. That’s the word from Wall Street’s top strategists, who expect the Standard & Poor’s 500 stock index to rise 10% in 2015. A gain of that magnitude surely would merit applause, coming atop an 8% rally year to date, not to mention 2013’s 30% advance. Almost six years in, the old bull still seems sprightly….

U.S. stocks are neither cheap nor expensive, based on the market’s current price/earnings ratio of 15.8 times future four-quarter earnings. Few strategists expect the multiple to expand much in the coming year.

“In isolation, U.S. stocks are on the expensive side,” says Jeffrey Knight, head of global asset allocation at Columbia Management. But measured against other financial assets—whether emerging-market equities or developed-market bonds—U.S. shares look strong, he adds.

And, in researching this article, I found Janet Yellen’s Dashboard available from the Brookings Institution website.

A lot of what happens in 2015 has to do with whether, when, and then how much the Fed raises interest rates.

I’m aiming to be as inclusive as I can in putting up these videos of the various celebrity forecasters and their outlook for 2015, so stay tuned.

China – Trade Colossus or Assembly Site?

There is a fascinating paper – How the iPhone Widens the United States Trade Deficit with the People’s Republic of China. In this Asian Bank Development Institute (ADBI) white paper, Yuqing Ying and his coauthor document the value chain for an Apple iPhone:

IPhone

The source for this breakout, incidentally, is a “teardown” performed by the IT market research company iSupply, still accessible at –https://technology.ihs.com/389273/iphone-3g-s-carries-17896-bom-and-manufacturing-cost-isuppli-teardown-reveals. In other words, iSupply physically took apart an iPhone to identify the manufacturers of the components.

The Paradox

After estimating that, in

2009 iPhones contributed US$1.9 billion to the trade deficit, equivalent to about 0.8% of the total US trade deficit with the PRC,

the authors go on to point out that

..most of the export value and the deficit due to the iPhone are attributed to imported parts and components from third countries and have nothing to do with the PRC. Chinese workers simply put all these parts and components together and contribute only US$6.5 to each iPhone, about 3.6% of the total manufacturing cost (e.g., the shipping price). The traditional way of measuring trade credits all of the US$178.96 to the PRC when an iPhone is shipped to the US, thus exaggerating the export volume as well as the imbalance. Decomposing the value added along the value chain of iPhone manufacturing suggests that, of the US$2.0 billion worth of iPhones exported from the PRC, 96.4% in fact amounts to transfers from Germany (US$326 million), Japan (US$670 million), Korea (US$259 million), the US (US$108 million), and other countries (US$ 542 million). All of these countries are involved in the iPhone production chain.

Yuqing Xing builds on the paradox in his more recent China’s High-Tech Exports: The Myth and Reality published in 2014 in MIT’s Asian Economic Papers.

Prevailing trade statistics are inconsistent with trade based on global supply chains and mistakenly credit entire values of assembled high-tech products to China. China’s real contribution to the reported 82 percent high-tech exports is labor not technology. High-tech products, mainly made of imported parts and components, should be called “Assembled High-tech.” To accurately measure high-tech exports, the value-added approach should be utilized with detailed analysis on the value chains distributions across countries. Furthermore, if assembly is the only source of value-added by Chinese workers, in terms of technological contribution these assembled high-tech exports are indifferent to labor-intensive products, and so they should be excluded from the high-tech classification.

MNEs, in particular Taiwanese IT firms in China, have performed an important role in the rapid expansion of high-tech exports. The trend of production fragmentation and outsourcing activities of MNEs in information and communication technology has benefitted China significantly, because of its huge labor endowment. The small share of indigenous firms in high-tech exports implies that China has yet to become a real competitor of the United States, EU, and Japan. That China is the number one high-tech exporter is thus a myth rather than a reality.

Ying and Yang

This perspective – that it is really “value-added” that we should focus on, rather than the total dollar volume of trade coming in or going out of a country – is interesting, but I can’t help but think there is a disconnect when you consider actual Chinese foreign exchange reserves, shown below (source – http://www.stats.gov.cn/tjsj/ndsj/2013/indexeh.htm).

ChinaFER

So currently China holds nearly 3.5 trillion dollars in foreign exchange reserves – most of which, but not all, is comprised of US dollars.

This is a huge amount of money, on the order of five percent of total global GDP.

How could China have accumulated this merely by being an assembly site for high tech and other products (see Five Facts about Value-Added Exports and Implications for Macroeconomics and Trade Research)? How can this be attributable just to mistakes in counting the origin of the many components in goods coming from China? Don’t those products have to come in and be counted as imports?

There is a mystery here, which it would be good to resolve.

Assembly photo at top from Apple Insider

China Passes US in Terms of Purchasing Power Parity

The International Monetary Fund (IMF) announced recently that Chinese GDP passed that of the United States – in terms of purchasing power parity (PPP).

Business Insider charts the relative sizes of the Chinese and US economies in terms of total global output, where, again, production is measured in terms of purchasing power output.

ChinaUS

According to the World Bank,

Purchasing power parity conversion factor is the number of units of a country’s currency required to buy the same amount of goods and services in the domestic market as a U.S. dollar would buy in the United States.

In a less serious vein, the Economist magazine maintains the Big Mac Index. This is informative, however, inasmuch as MacDonalds outlets range across the globe.

In July of this year, the Economist lists the US price of a Big Mac hamburger as $4.80.

China is among the cheapest places to buy a Big Mac, as shown in this table from Economist data.

BIGMAClist

The China Big Mac Index, therefore, is 0.57, suggesting Chinese yuan purchase almost twice the actual goods and services in China, as their dollar exchange rate would suggest.

Or to do this calculation based on the current exchange rate, 1 US dollar buys 6.41 Chinese 1 yuan.

So, if the local price has not changed, 16.9 yuan buy a Big Mac, indicating that a Big Mac now has a dollar price of $2.63. Then, if today’s Big Mac still costs $4.80, the renmimbi buys 4.8/2.63 or 1.83 times as much as its market exchange rate indicates. Hence, according to a Big Mac type index evaluation, the renmimbi is undervalued.

This is a pretty good calculation, according to the World Bank, which lists the conversion factor as 0.7.

Of course, there are four to five times as many residents of the People’s Republic of China, as there are US residents. Per capita Chinese incomes, accordingly, are four to five times lower, even in terms of purchasing power parity.

And in terms of market exchange values, the IMF estimates 2014 Chinese GDP at 10,355 billion dollars, compared with $17,416 billion for the US.

The rise of Chinese production has been truly spectacular, as this chart of Chinese GDP shows, based on official Chinese statistics.

ChinaGDPgraph

There are a lot of other remarkable charts that can be pulled together about China, and I am planning several future posts along these lines.

See you this coming week!

Chinese official courtesy of Wikipedia

Followup on OPEC and the Price of Oil

Well, readers here may have noticed, Business Forecast Blog correctly predicted the OPEC decision about reducing oil production at their Thanksgiving Thursday (November 27) meeting in Vienna.

USA Today reports,

VIENNA — Crude prices plunged Thursday after the powerful Organization of Petroleum Exporting Countries said it wouldn’t cut production levels to stem the collapse in oil prices that have fallen 40% since June.

Saudi Arabia’s oil minister Ali Al-Naimi delivered the news as he left a nearly five-hour meeting of the cartel’s 12 oil ministers here.

Our post was called The Limits of OPEC and was studded with passages of deep foresight, such as

I’m kind of a contrarian here. I think the sound and fury about this Vienna meeting on Thanksgiving may signify very little in terms of oil prices – unless global (and especially Chinese) economic growth picks up. As the dominant OPEC producer, Saudi Arabia may have market power, but, otherwise, there is little evidence OPEC functions as a cartel. It’s hard to see, also, that the Saudi’s would unilaterally reduce their output only to see higher oil prices support US frackers continuing to increase their production levels at current rates.

The immediate response to the much-anticipated OPEC meeting was a plunge in the spot price of West Texas Intermediate (WTI) to below $70 a barrel.

WTINov28

Brent, the other pricing standard, fared a little better, but dropped significantly,

BrentNov28

Both charts are courtesy of the Financial Times of London.

The Reuters article on the OPEC decision – Saudis block OPEC output cut, sending oil price plunging – is full of talk that letting prices drift lower, perhaps down to $60-65 a barrel, is motivated by a desire to wing higher-cost US producers, and also, maybe, to squeeze Russia and Iran – other players who are out of favor with Saudi Arabia and other Gulf oil states.

Forecasting Issues and Techniques

Advice – get the data, get the facts. Survey Bloomberg and other media by relevant news story and topic, but whenever possible, go to the source.

For example, lower oil prices may mean Saudi Arabia and some other Gulf oil states have to rely more on accumulated foreign exchange to pay their bills, since their lavish life-styles probably adjusted to higher prices (even though raw production costs may be as low as $25 a barrel). Just how big are these currency reserves, and can we watch them being drawn down? There is another OPEC meeting apparently scheduled for June 2015

Lead picture of Saudi Oil Minister from Yahoo.