Let’s focus on forecasting interest rates.
The first question, of course, is “which interest rate”?
So, there is a range of interest rates from short term rates to rates on longer term loans and bonds. The St. Louis Fed data service FRED lists 719 series under “interest rates.”
Interest rates, however, tend to move together over time, as this chart on the bank prime rate of interest and the federal funds rate shows.
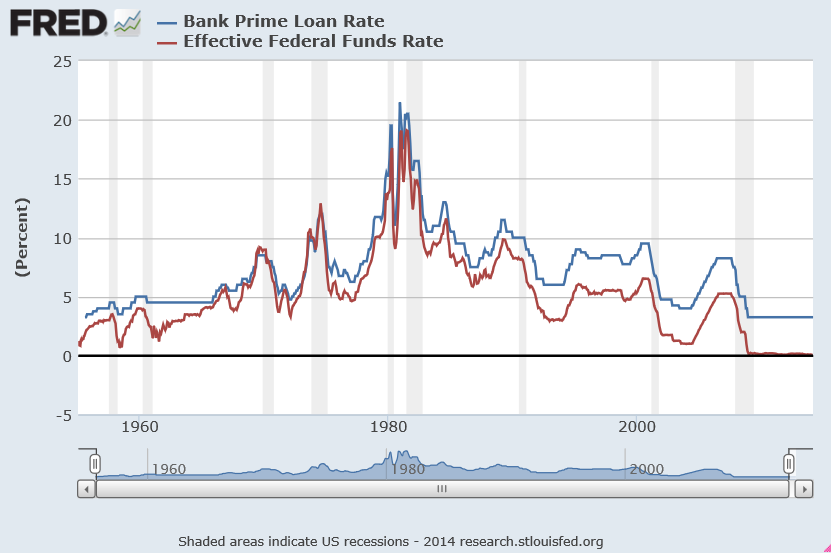
There’s a lot in this chart.
There is the surge in interest rates at the beginning of the 1980’s. The prime rate rocketed to more than 20 percent, or, in the words of the German Chancellor at the time higher “than any year since the time of Jesus Christ.” This ramp-up in interest rates followed actions of the US Federal Reserve Bank under Paul Volcker – extreme and successful tactics to break the back of inflation running at a faster and faster pace in the 1970’s.
Recessions are indicated on this graph with shaded areas.
Also, almost every recession in this more than fifty year period is preceded by a spike in the federal funds rate – the rate under the control of or targeted by the central bank.
Another feature of this chart is the federal funds rate is almost always less than the prime rate, often by several percentages.
This makes sense because the federal funds rate is a very short term interest rate – on overnight loans by depository institutions in surplus at the Federal Reserve to banks in deficit at the end of the business day – surplus and deficit with respect to the reserve requirement.
The interest rate the borrowing bank pays the lending bank is negotiated, and the weighted average across all such transactions is the federal funds effective rate. This “effective rate” is subject to targets set by the Federal Reserve Open Market Committee. Fed open market operations influence the supply of money to bring the federal funds effective rate in line with the federal funds target rate.
The prime rate, on the other hand, is the underlying index for most credit cards, home equity loans and lines of credit, auto loans, and personal loans. Many small business loans are also indexed to the prime rate. The term of these loans is typically longer than “overnight,” i.e. the prime rate applies to longer term loans.
The Yield Curve
The relationship between interest rates on shorter term and longer term loans and bonds is a kind of predictive relationship. It is summarized in the yield curve.
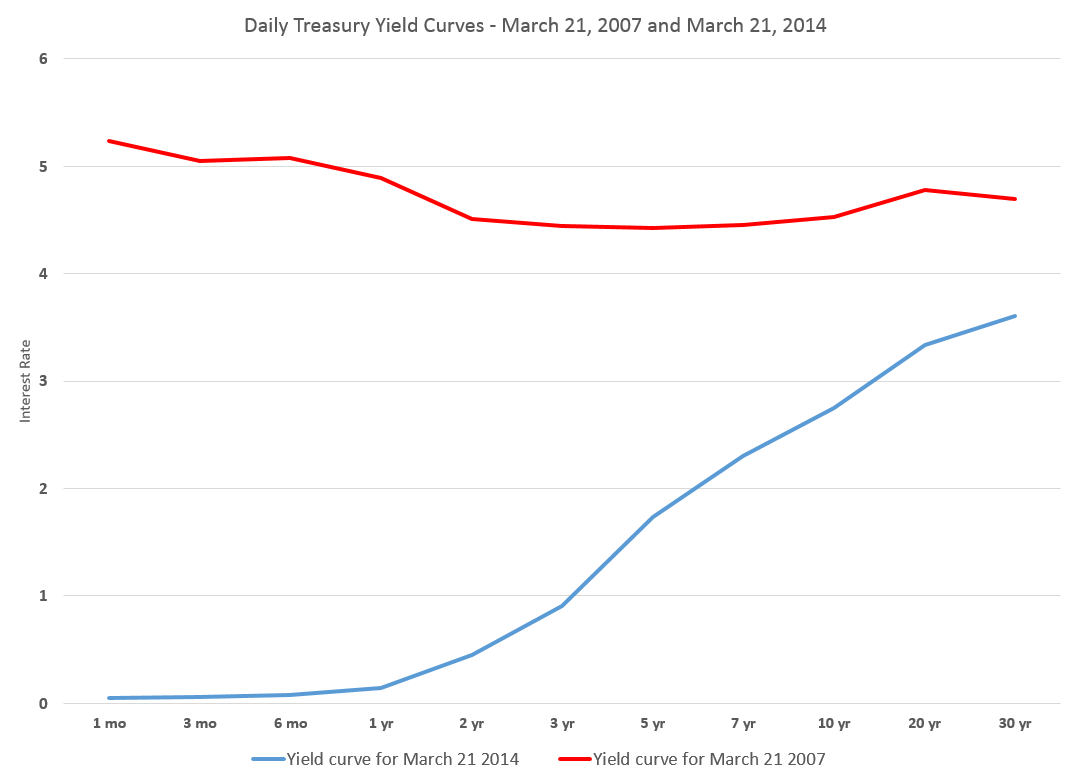
The US Treasury maintains a page Daily Treasury Yield Curve Rates which documents the yield on a security to its time to maturity .. based on the closing market bid yields on actively traded Treasury securities in the over-the-counter market.
The current yield curve is shown by the blue line in the chart below, and can be contrasted with a yield curve seven years previously, prior to the financial crisis of 2008-09 shown by the red line.
Treasury notes on this curve report that –
These market yields are calculated from composites of quotations obtained by the Federal Reserve Bank of New York. The yield values are read from the yield curve at fixed maturities, currently 1, 3 and 6 months and 1, 2, 3, 5, 7, 10, 20, and 30 years. This method provides a yield for a 10 year maturity, for example, even if no outstanding security has exactly 10 years remaining to maturity.
Short term yields are typically less than longer term yields because there is an opportunity cost in tying up money for longer periods.
However, on occasion, there is an inversion of the yield curve, as shown for March 21, 2007 in the chart.
Inversion of the yield curve is often a sign of oncoming recession – although even the Fed authorities, who had some hand in causing the increase in the short term rates at the time, appeared clueless about what was coming in Spring 2007.
Current Prospects for Interest Rates
Globally, we have experienced an extraordinary period of low interest rates with short term rates hovering just at the zero bound. Clearly, this cannot go on forever, so the longer term outlook is for interest rates of all sorts to rise.
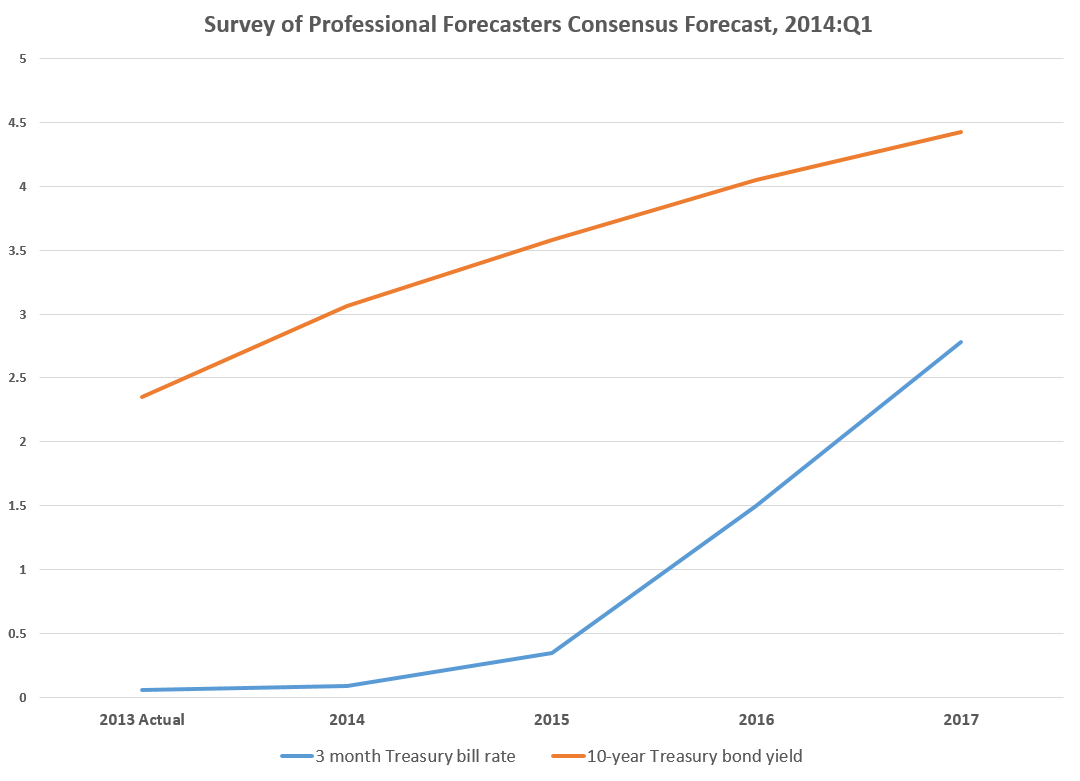
The Survey of Professional Forecasters develops consensus forecasts of key macroeconomic indicators, such as interest rates.
The latest survey, from the first quarter of 2014, includes the following consensus projections for the 3-month Treasury bill and the 10-year Treasury bond rates.
Bankrate.com has short articles predicting mortgage rates, car loans, credit card rates, and bonds over the next year or two. Mortgage rates might rise to 5 percent by the end of 2014, but that is predicated on a strong recovery in the economy, according to this site.
As anyone participating in modern civilization knows, a great deal depends on the actions of the US Federal Reserve bank. Currently, the Fed influences both short and longer term interest rates. Short term rates are keyed closely to the federal funds rate. Longer term rates are influenced by Fed Quantitative Easing (QE) programs of bond-buying. The Fed’s bond buying is scheduled to be cut back step-by-step (“tapering”) about $10 billion per month.
Actions of the Bank of Japan and the European central bank in Frankfurt also bear on global prospects and impacts of higher interest rates.
Interest rates, however, are not wholly controlled by central banks. Capital markets have a dynamic all their own, which makes forecasting interest rates an increasingly relevant topic.