
The United Nations population division produces widely-cited forecasts with country detail on a number of key metrics, such as age structure and median age.
The latest update (2012 revision) estimates 2010 base population at 6.9 billion persons, projecting global population at 7.7 billion and 8.4 billion in 2020 and 2030, respectively, in a medium fertility scenario.
The low fertility scenario projects 7.5 billion persons for 2020 and approximately 8.0 billion for 2030.
So, bottom line, global population is unlikely to peak during this forecast period to 2030, although it is likely to decline, under all fertility scenarios, for key players in the global economy – such as Japan and Germany.
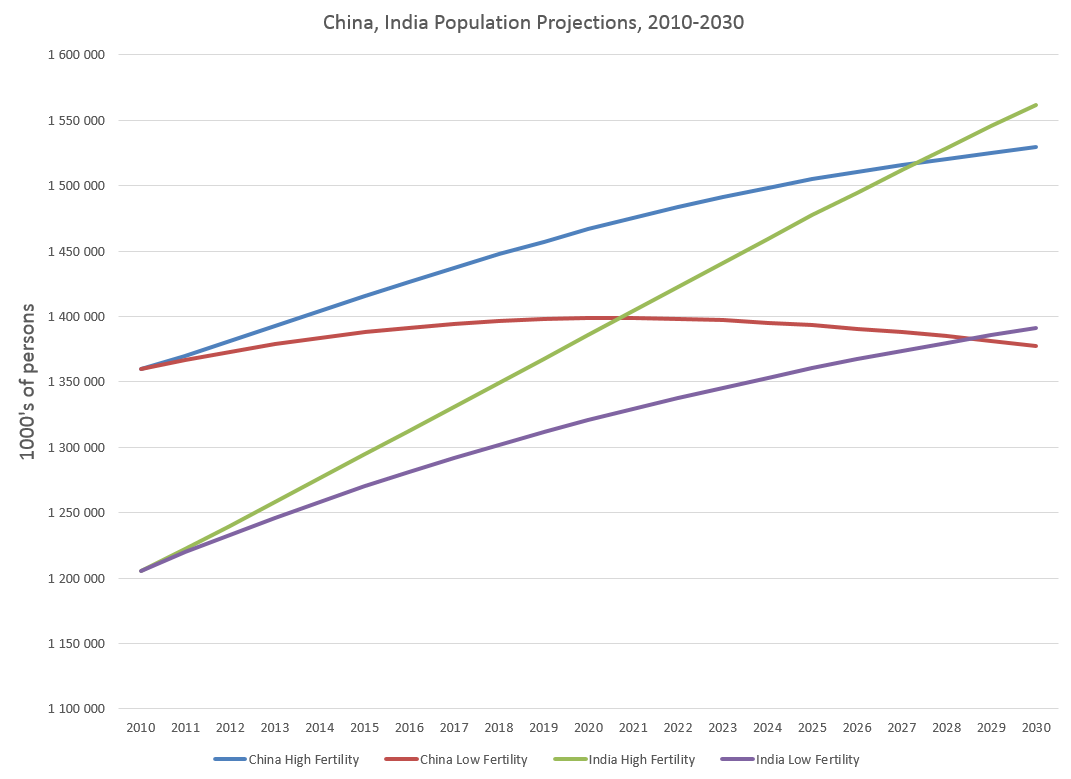
Population decline is even possible, according to the 2012 revision, in a low fertility scenario for China, although not with higher birth rates, as indicated in the following chart.
Some rudimentary data analytics shows the importance of the estimate of median age in a country for its projected population growth in the 2012 revision.
For example, here is a scatter diagram of the median age within a country (horizontal or x-axis) and the percentage increase or decrease 2010-2030 in the medium fertility scenario of the UN projections. Thus, just to clarify, a 60 percent “percentage growth” on the vertical axis means 2030 population is 60 percent larger than the estimated base year 2010 population.
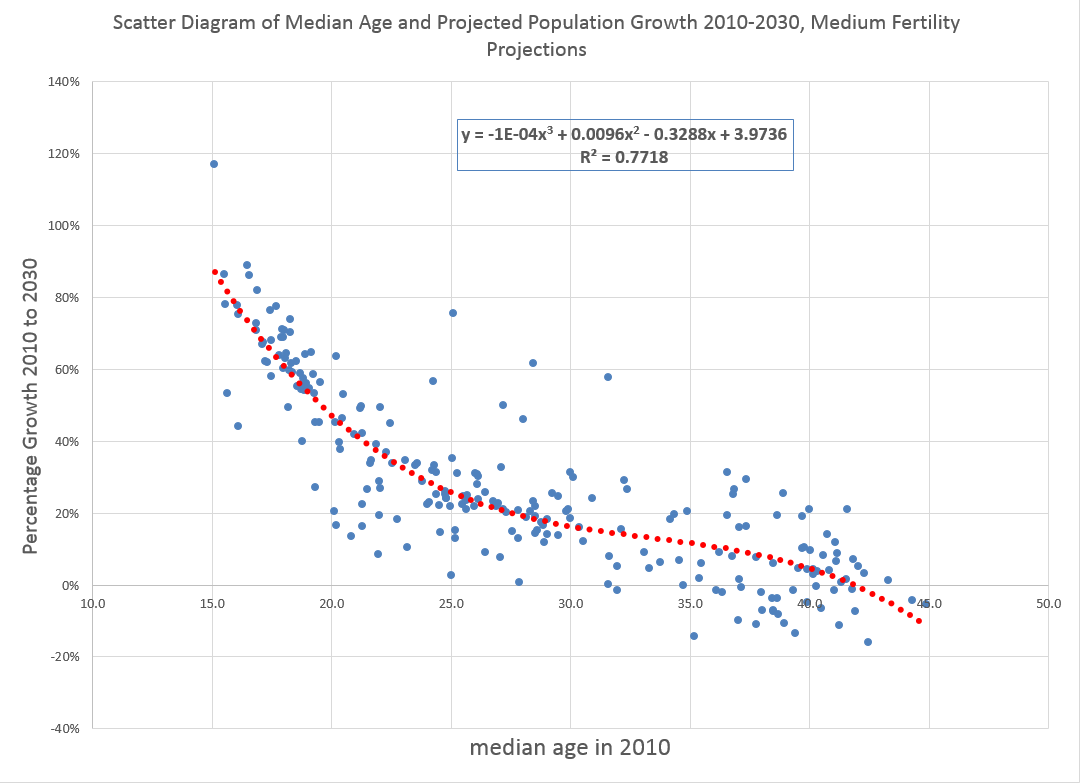
Note that a polynomial regression fits this scatter of points with a relatively high R2. This indicates that the median age is negatively related to the projected population change for a country in this period with drop-offs in the earliest and oldest median ages in the population of countries.
Thus, in the first chart, Chinese growth includes the possibility of a decline over this period, and India’s does not. This is related to the fact that the median age of China in 2010 is estimated at 34.6 years, while the median age in 2010 in India is estimated at 25.5 years of age.
China and India, of course, are the world’s two most populous countries.
Here are some other interesting charts from the UN projections.
Russia, Japan, and Germany
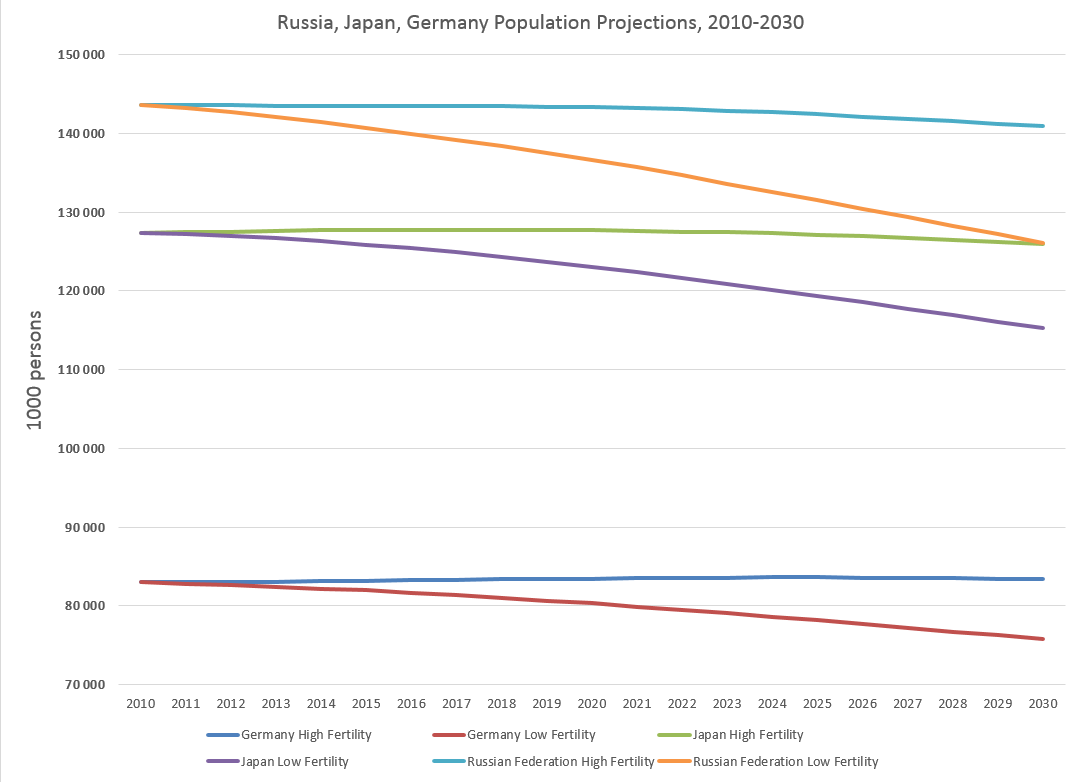
The comparison for these countries is between the high fertility and low fertility scenarios. The middle fertility scenario lies pretty squarely between these curves for each nation.
Indonesia, Brazil, and Nigeria
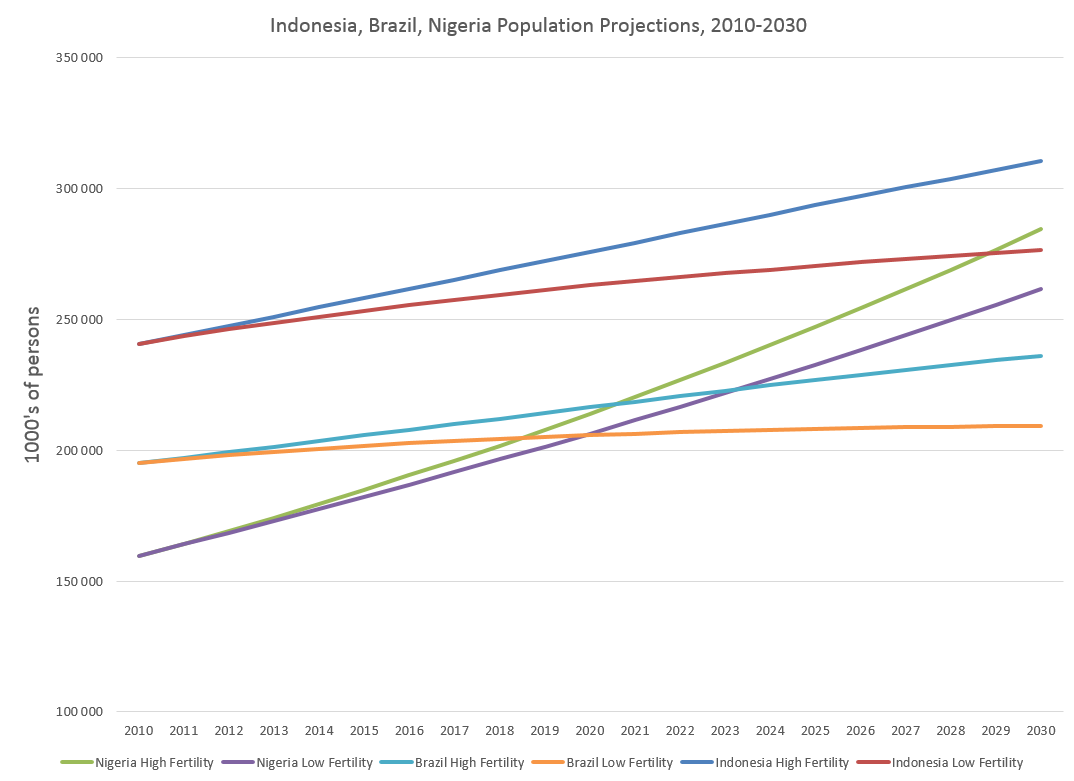
Nigeria has the highest population growth rates for any larger country for this period, again because its 2010 median age is listed as around 18 years of age.
Accuracy of UN Population Forecasts
The accuracy of UN population forecasts has improved over the past several decades, with improved estimates of base population (See for example. Data quality and accuracy of UN Population Projections, 1950-1995). Needless to say forecasts for industrially developed counties usually have been better than for nations in the developing world.
Changes in migration account for significant errors in national population forecasts, as when a large contingent, some legal, some side-stepping legal immigration channels, came from Mexico and other Spanish-speaking areas “South of the Border,” changing birth patterns in the US from the early 1990’s to the years after 2000. In fact, during the early 1990’s, Census was predicting peak population for the US might occur as early as 2025. This idea went by the wayside, however, as younger, more fertile Hispanic families took their place in the country.
Current UN forecasts indicate US population should increase in the medium fertility scenario from 312 million to 338 million and 363 million, respectively, by 2020 and 2030.