Tag Archives: technology forecasting

Mobile e-commerce

Mobile ecommerce is no longer just another means consumers use to buy products online. It’s now the predominant way buyers visit ecommerce sites.

And mobile applications are radically changing the nature of shopping. The Emeritus founder of comScore, for example, highlights the two aspects of mobile ecommerce,

comScoreslide1

Examples of m-Shopping, according to Internet Retailer, include –

Online consumers use their smartphones and tablets for many shopping-related activities. In Q2 2013, 57% of smartphone users while in a retailer’s store visited that retailer’s site or app compared with 43% who consulted another company’s site or app, comScore says. The top reason consumers consulted retailers’ sites or apps was to compare prices. Among those smartphone users who went to the same retailer’s site, 59% wanted to see if there was an online discount available, the report says. Similarly, among those who checked a different retailer’s site, 92% wanted to see if they could get a better deal on price.

Smartphone owners also used their devices while in stores to take a picture of a product (23%), text or call family or friends about a product (17%), and send a picture of a product to family and friends (17%).

According to Gian Fulgoni, “m-Buying” is the predominant way shoppers now engage with retail brands online in the US.

comScore2

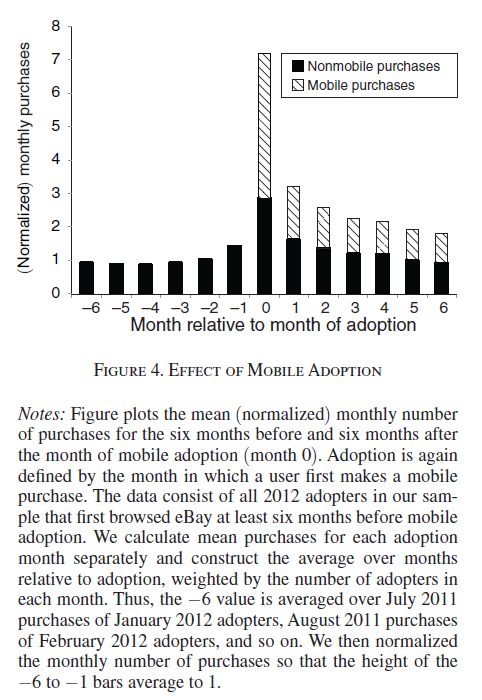
Growth, Adoption, and Use of Mobile E-Commerce explores patterns of mobile ecommerce with extensive data on eBay transactions.

One of the more interesting findings is that,

..adoption of the mobile shopping application is associated with both an immediate and sustained increase in total platform purchasing. The data also do not suggest that mobile application purchases are simply purchases that would have been made otherwise on the regular Internet platform.

The following chart illustrates this effect.

mobileplus

Finally. responsive web design seems to be a key to optimizing for mobile ecommerce.

Responsive web design is a process of making your website content adaptable to the size of the screen you are viewing it on. By doing so, you can optimise your site for mobile and tablet traffic, without the need to manage multiple templates, or separate content.

e-commerce and Forecasting

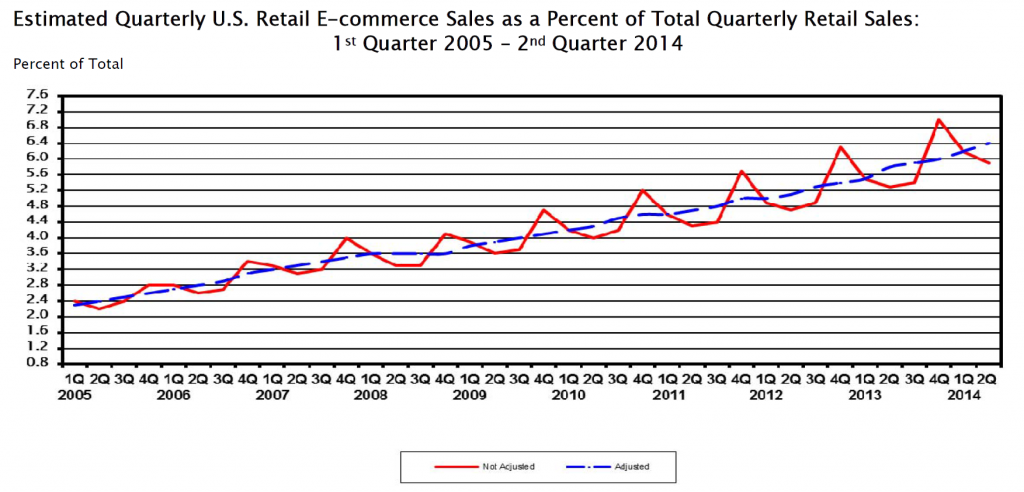
The Census Bureau announced numbers from its latest e-commerce survey August 15.

The basic pattern continues. US retail e-commerce sales increased about 16 percent on a year-over-year basis from the second quarter of 2013. By comparison, total retail sales for the second quarter 2014 increased just short of 5 percent on a year-over-year basis.

 ecommercepercent

As with other government statistics relating to IT (information technology), one can quarrel with the numbers (they may, for example, be low), but there is impressive growth no matter how you cut it.

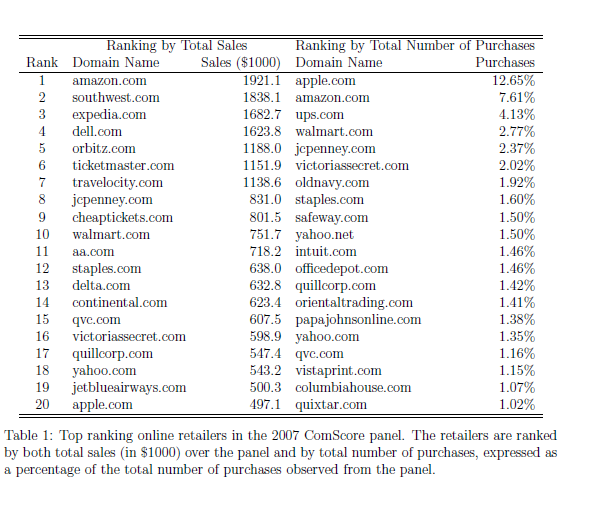
Some of the top e-retailers from the standpoint of clicks and sales numbers are listed in Panagiotelis et al. Note these are sample data, from comScore with the totals for each company or site representing a small fraction of their actual 2007 online sales.

eretailers

Forecasting Issues

Forecasting issues related to e-commerce run the gamut.

Website optimization and target marketing raise questions such as the profitability of “stickiness” to e-commerce retailers. There are advanced methods to tease out nonlinear, nonnormal multivariate relationships between, say, duration and page views and the decision to purchase – such as copulas previously applied in financial risk assessment and health studies.

Mobile e-commerce is a rapidly growing area with special platform and communications characteristics all its own.

Then, there are the pros and cons of expanding tax collection for online sales.

All in all, Darrell Rigby’s article in the Harvard Business Review – The Future of Shopping – is hard to beat. Traditional retailers generally have to move to a multi-channel model, supplementing brick-and-mortar stores with online services.

I plan several posts on these questions and issues, and am open for your questions.

Top graphic by DIGISECRETS

When the Going Gets Tough, the Tough Get Going

Great phrase, but what does it mean? Well, maybe it has something to do with the fact that a lot of economic and political news seem to be entering kind of “end game.” But, it’s now the “lazy days of summer,” and there is a temptation to sit back and just watch it whiz by.

What are the options?

One is to go more analytical. I’ve recently updated my knowledge base on some esoteric topics –mathematically and analytically interesting – such as kernel ridge regression and dynamic principal components. I’ve previously mentioned these, and there are more instances of analysis to consider. What about them? Are they worth the enormous complexity and computational detail?

Another is to embrace the humming, buzzing confusion and consider “geopolitical risk.” The theme might be the price of oil and impacts, perhaps, of continuing and higher oil prices.

Or the proliferation of open warfare.

Rarely in recent decades have we seen outright armed conflict in Europe, as appears to be on-going in the Ukraine.

And I cannot make much sense of developments in the Mid-East, with some shadowy group called Isis scooping up vast amounts of battlefield armaments abandoned by collapsing Iraqi units.

Or how to understand Israeli bombardment of UN schools in Gaza, and continuing attacks on Israel with drones by Hamas. What is the extent and impact of increasing geopolitical risk?

There also is the issue of plague – most immediately ebola in Africa. A few days ago, I spent the better part of a day in the Boston Airport, and, to pass the time, read the latest Dan Brown book about a diabolical scheme to release an aerosol epidemic of sorts. In any case, ebola is in a way a token of a range of threats that stand just outside the likely. For example, there is the problem of the evolution of immune strains of bacteria, with widespread prescription and use.

There also is the ever-bloating financial bubble that has emerged in the US and elsewhere, as a result of various tactics of central and other banks in reaction to the Great Recession, and behavior of investors.

Finally, there are longer range scientific and technological possibilities. From my standpoint, we are making a hash of things generally. But efforts at political reform, by themselves, usually fall short, unless paralleled by fundamental new possibilities in production or human organization. And the promise of radical innovation for the betterment of things has never seemed brighter.

I will be exploring some of these topics and options in coming posts this week and in coming weeks.

And I think by now I have discovered a personal truth through writing – one that resonates with other experiences of mine professionally and personally. And that is sometimes it is just when the way to going further seems hard to make out that concentration of thought and energies may lead to new insight.

Semiconductor Cycles

I’ve been exploring cycles in the semiconductor, computer and IT industries generally for quite some time.

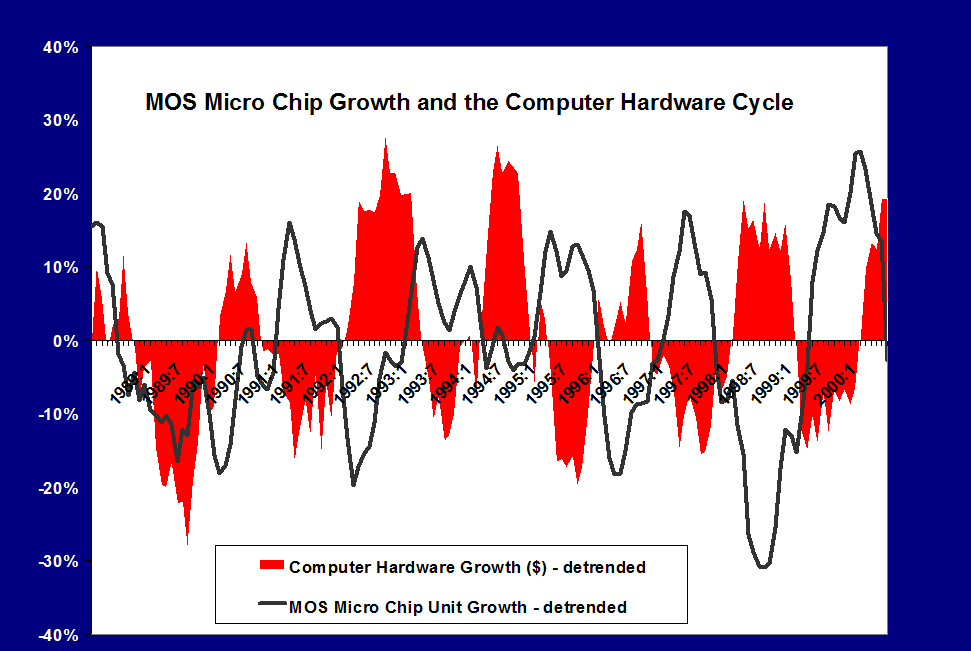
Here is an exhibit I prepared in 2000 for a magazine serving the printed circuit board industry.

semicycle

The data come from two sources – the Semiconductor Industry Association (SIA) World Semiconductor Trade Statistics database and the Census Bureau manufacturing series for computer equipment.

This sort of analytics spawned a spate of academic research, beginning more or less with the work of Tan and Mathews in Australia.

One of my favorites is a working paper released by DRUID – the Danish Research Unit for Industrial Dynamics called Cyclical Dynamics in Three Industries. Tan and Mathews consider cycles in semiconductors, computers, and what they call the flat panel display industry. They start with quoting “industry experts” and, specifically, some of my work with Economic Data Resources on the computer (PC) cycle. These researchers went on to publish in the Journal of Business Research and Technological Forecasting and Social Change in 2010. A year later in 2011, Tan published an interesting article on the sequencing of cyclical dynamics in semiconductors.

Essentially, the appearance of cycles and what I have called quasi-cycles or pseudo-cycles in the semiconductor industry and other IT categories, like computers, result from the interplay of innovation, investment, and pricing. In semiconductors, for example, Moore’s law – which everyone always predicts will fail at some imminent future point – indicates that continuing miniaturization will lead to periodic reductions in the cost of information processing. At some point in the 1980’s, this cadence was firmly established by introductions of new microprocessors by Intel roughly every 18 months. The enhanced speed and capacity of these microprocessors – the “central nervous system” of the computer – was complemented by continuing software upgrades, and, of course, by the movement to graphical interfaces with Windows and the succession of Windows releases.

Back along the supply chain, semiconductor fabs were retooling periodically to produce chips with more and more transitors per volume of silicon. These fabs were, simply put, fabulously expensive and the investment dynamics factors into pricing in semiconductors. There were famous gluts, for example, of memory chips in 1996, and overall the whole IT industry led the recession of 2001 with massive inventory overhang, resulting from double booking and the infamous Y2K scare.

Statistical Modeling of IT Cycles

A number of papers, summarized in Aubrey deploy VAR (vector autoregression) models to capture leading indicators of global semiconductor sales. A variant of these is the Bayesian VAR or BVAR model. Basically, VAR models sort of blindly specify all possible lags for all possible variables in a system of autoregressive models. Of course, some cutoff point has to be established, and the variables to be included in the VAR system have to be selected by one means or another. A BVAR simply reduces the number of possibilities by imposing, for example, sign constraints on the resulting coefficients, or, more ambitiously, employs some type of prior distribution for key variables.

Typical variables included in these models include:

  • WSTS monthly semiconductor shipments (now by subscription only from SIA)
  • Philadelphia semiconductor index (SOX) data
  • US data on various IT shipments, orders, inventories from M3
  • data from SEMI, the association of semiconductor equipment manufacturers

Another tactic is to filter out low and high frequency variability in a semiconductor sales series with something like the Hodrick-Prescott (HP) filter, and then conduct a spectral analysis.

Does the Semiconductor/Computer/IT Cycle Still Exist?

I wonder whether academic research into IT cycles is a case of “redoubling one’s efforts when you lose sight of the goal,” or more specifically, whether new configurations of forces are blurring the formerly fairly cleanly delineated pulses in sales growth for semiconductors, computers, and other IT hardware.

“Hardware” is probably a key here, since there have been big changes since the 1990’s and early years of this brave new century.

For one thing, complementarities between software and hardware upgrades seem to be breaking down. This began in earnest with the development of virtual servers – software which enabled many virtual machines on the same hardware frame, in part because the underlying circuitry was so massively powerful and high capacity now. Significant declines in the growth of sales of these machines followed on wide deployment of this software designed to achieve higher efficiencies of utilization of individual machines.

Another development is cloud computing. Running the data side of things is gradually being taken away from in-house IT departments in companies and moved over to cloud computing services. Of course, critical data for a company is always likely to be maintained in-house, but the need for expanding the number of big desktops with the number of employees is going away – or has indeed gone away.

At the same time, tablets, Apple products and Android machines, created a wave of destructive creation in people’s access to the Internet, and, more and more, for everyday functions like keeping calendars, taking notes, even writing and processing photos.

But note – I am not studding this discussion with numbers as of yet.

I suspect that underneath all this change it should be possible to identify some IT invariants, perhaps in usage categories, which continue to reflect a kind of pulse and cycle of activity.

Video Friday – Quantum Computing

I’m instituting Video Friday. It’s the end of the work week, and videos introduce novelty and pleasant change in communications.

And we can keep focusing on matters related to forecasting applications and data analytics, or more generally on algorithmic guides to action.

Today I’m focusing on D-Wave and quantum computing. This could well could take up several Friday’s, with cool videos on underlying principles and panel discussions with analysts from D-Wave, Google and NASA. We’ll see. Probably, I will treat it as a theme, returning to it from time to time.

A couple of introductory comments.

First of all, David Wineland won a Nobel Prize in physics in 2012 for his work with quantum computing. I’ve heard him speak, and know members of his family. Wineland did his work at the NIST Laboratories in Boulder, the location for Eric Cornell’s work which was awarded a Nobel Prize in 2001.

I mention this because understanding quantum computing is more or less like trying to understand quantum physics, and, there, I think engineering has a role to play.

The basic concept is to exploit quantum superimposition, or perhaps quantum entanglement, as a kind of parallel processor. The qubit, or quantum bit, is unlike the bit of classical computing. A qubit can be both 0 and 1 simultaneously, until it’s quantum wave equation is collapsed or dispersed by measurement. Accordingly, the argument goes, qubits scale as powers of 2, and a mere 500 qubits could more than encode all atoms in the universe. Thus, quantum computers may really shine at problems where you have to search through all different combinations of things.

But while I can write the quantum wave equation of Schrodinger, I don’t really understand it in any basic sense. It refers to a probability wave, whatever that is.

Feynman, whose lectures (and tapes or CD’s) on physics I proudly own, says it is pointless to try to “understand” quantum weirdness. You have to be content with being able to predict outcomes of quantum experiments with the apparatus of the theory. The theory is highly predictive and quite successful, in that regard.

So I think D-Wave is really onto something. They are approaching the problem of developing a quantum computer technologically.

Here is a piece of fluff Google and others put together about their purchase of a D-Wave computer and what’s involved with quantum computing.

OK, so now here is Eric Ladizinsky in a talk from April of this year on Evolving Scalable Quantum Computers. I can see why Eric gets support from DARPA and Bezos, a range indeed. You really get the “ah ha” effect listening to him. For example, I have never before heard a coherent explanation of how the quantum weirdness typical for small particles gets dispersed with macroscopic scale objects, like us. But this explanation, which is mathematically based on the wave equation, is essential to the D-Wave technology.

It takes more than an hour to listen to this video, but, maybe bookmark it if you pass on from a full viewing, since I assure you that this is probably the most substantive discussion I have yet found on this topic.

But is D-Wave’s machine a quantum computer?

Well, they keep raising money.

D-Wave Systems raises $30M to keep commercializing its quantum computer

But this infuriates some in the academic community, I suspect, who distrust the announcement of scientific discovery by the Press Release.

There is a brilliant article recently in Wired on D-Wave, which touches on a recent challenge to its computational prowess (See Is D-Wave’s quantum computer actually a quantum computer?)

The Wired article gives Geordie Rose, a D-Wave founder, space to rebut at which point these excellent comments can be found:

Rose’s response to the new tests: “It’s total bullshit.”

D-Wave, he says, is a scrappy startup pushing a radical new computer, crafted from nothing by a handful of folks in Canada. From this point of view, Troyer had the edge. Sure, he was using standard Intel machines and classical software, but those benefited from decades’ and trillions of dollars’ worth of investment. The D-Wave acquitted itself admirably just by keeping pace. Troyer “had the best algorithm ever developed by a team of the top scientists in the world, finely tuned to compete on what this processor does, running on the fastest processors that humans have ever been able to build,” Rose says. And the D-Wave “is now competitive with those things, which is a remarkable step.”

But what about the speed issues? “Calibration errors,” he says. Programming a problem into the D-Wave is a manual process, tuning each qubit to the right level on the problem-solving landscape. If you don’t set those dials precisely right, “you might be specifying the wrong problem on the chip,” Rose says. As for noise, he admits it’s still an issue, but the next chip—the 1,000-qubit version codenamed Washington, coming out this fall—will reduce noise yet more. His team plans to replace the niobium loops with aluminum to reduce oxide buildup….

Or here’s another way to look at it…. Maybe the real problem with people trying to assess D-Wave is that they’re asking the wrong questions. Maybe his machine needs harder problems.

On its face, this sounds crazy. If plain old Intels are beating the D-Wave, why would the D-Wave win if the problems got tougher? Because the tests Troyer threw at the machine were random. On a tiny subset of those problems, the D-Wave system did better. Rose thinks the key will be zooming in on those success stories and figuring out what sets them apart—what advantage D-Wave had in those cases over the classical machine…. Helmut Katzgraber, a quantum scientist at Texas A&M, cowrote a paper in April bolstering Rose’s point of view. Katzgraber argued that the optimization problems everyone was tossing at the D-Wave were, indeed, too simple. The Intel machines could easily keep pace..

In one sense, this sounds like a classic case of moving the goalposts…. But D-Wave’s customers believe this is, in fact, what they need to do. They’re testing and retesting the machine to figure out what it’s good at. At Lockheed Martin, Greg Tallant has found that some problems run faster on the D-Wave and some don’t. At Google, Neven has run over 500,000 problems on his D-Wave and finds the same....

..it may be that quantum computing arrives in a slower, sideways fashion: as a set of devices used rarely, in the odd places where the problems we have are spoken in their curious language. Quantum computing won’t run on your phone—but maybe some quantum process of Google’s will be key in training the phone to recognize your vocal quirks and make voice recognition better. Maybe it’ll finally teach computers to recognize faces or luggage. Or maybe, like the integrated circuit before it, no one will figure out the best-use cases until they have hardware that works reliably. It’s a more modest way to look at this long-heralded thunderbolt of a technology. But this may be how the quantum era begins: not with a bang, but a glimmer.

Highlights of National and Global Energy Projections

Christof Rühl – Group Chief Economist at British Petroleum (BP) just released an excellent, short summary of the global energy situation, focused on 2013.

Ruhl

Rühl’s video is currently only available on the BP site at –

http://www.bp.com/en/global/corporate/about-bp/energy-economics/statistical-review-of-world-energy.html

Note the BP Statistical Review of World Energy June 2014 was just released (June 16).

Highlights include –

  • Economic growth is one of the biggest determinants of energy growth. This means that energy growth prospects in Asia and other emerging markets are likely to dominate slower growth in Europe – where demand is actually less now than in 2005 – and the US.
  • Tradeoffs and balancing are a theme of 2013. While oil prices remained above $100/barrel for the third year in a row, seemingly stable, underneath two forces counterbalanced one another – expanding production from shale deposits in the US and an increasing number of supply disruptions in the Middle East and elsewhere.
  • 2013 saw a slowdown in natural gas demand growth with coal the fastest growing fuel. Growth in shale gas is slowing down, partly because of a big price differential between gas and oil.
  • While CO2 emissions continue to increase, the increased role of renewables or non-fossil fuels (including nuclear) have helped hold the line.
  • The success story of the year is that the US is generating new fuels, improving its trade position and trade balance with what Rühl calls the “shale revolution.”

The BP Statistical Reviews of World Energy are widely-cited, and, in my mind, rank alongside the Energy Information Agency (EIA) Annual Energy Outlook and the International Energy Agency’s World Energy Outlook. The EIA’s International Energy Outlook is another frequently-cited document, scheduled for update in July.

Price is the key, but is difficult to predict

The EIA, to its credit, publishes a retrospective on the accuracy of its forecasts of prices, demand and production volumes. The latest is on a page called Annual Energy Outlook Retrospective Review which has a revealing table showing the EIA projections of the price of natural gas at wellhead and actual figures (as developed from the Monthly Energy Review).

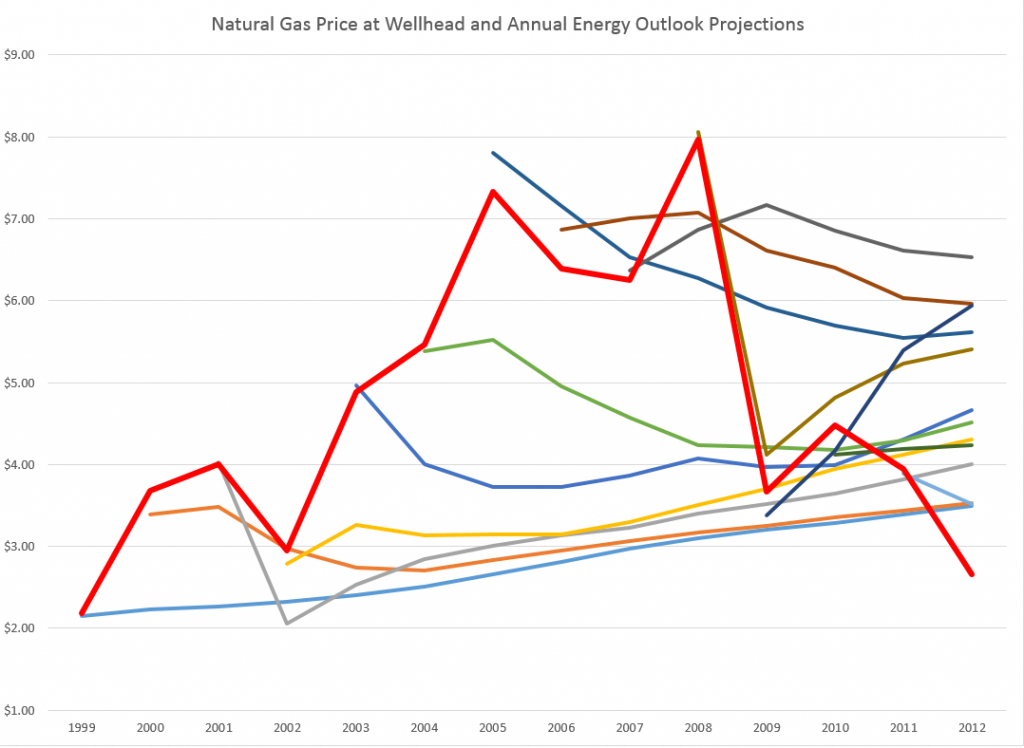
I pulled together a graph showing the actual nominal price at the wellhead and the EIA forecasts.

natgasforecasterrorgraph

The solid red line indicates actual prices. The horizontal axis shows the year for which forecasts are made. The initial value in any forecast series is nowcast, since wellhead prices are available at only a year lag. The most accurate forecasts were for 2008-2009 in the 2009 and 2010 AEO documents, when the impact of the severe recession was already apparent.

Otherwise, the accuracy of the forecasts is completely underwhelming.

Indeed, the EIA presents another revealing chart showing the absolute percentage errors for the past two decades of forecasts. Natural gas prices show up with more than 30 percent errors, as do imported oil prices to US refineries.

Predicting Reserves Without Reference to Prices

Possibly as a result of the difficulty of price projections, the EIA apparently has decoupled the concept of Technically Recoverable Resources (TRR) from price projections.

This helps explain how you can make huge writedowns of TRR in the Monterey Shale without affecting forecasts of future shale oil and gas production.

Thus in Assumptions to AEO2014 and the section called the Oil and Gas Supply Module, we read –

While technically recoverable resources (TRR) is a useful concept, changes in play-level TRR estimates do not necessarily have significant implications for projected oil and natural gas production, which are heavily influenced by economic considerations that do not enter into the estimation of TRR. Importantly, projected oil production from the Monterey play is not a material part of the U.S. oil production outlook in either AEO2013 or AEO2014, and was largely unaffected by the change in TRR estimates between the 2013 and 2014 editions of the AEO. EIA estimates U.S. total crude oil production averaged 8.3 million barrels/day in April 2014. In the AEO2014 Reference case, economically recoverable oil from the Monterey averaged 57,000 barrels/day between 2010 and 2040, and in the AEO2013 the same play’s estimated production averaged 14,000 barrels/day. The difference in production between the AEO2013 and AEO2014 is a result of data updates for currently producing wells which were not previously linked to the Monterey play and include both conventionally-reservoired and continuous-type shale areas of the play. Clearly, there is not a proportional relationship between TRR and production estimates – economics matters, and the Monterey play faces significant economic challenges regardless of the TRR estimate.

This year EIA’s estimate for total proved and unproved U.S. technically recoverable oil resources increased 5.4 billion barrels to 238 billion barrels, even with a reduction of the Monterey/Santos shale play estimate of unproved technically recoverable tight oil resources from 13.7 billion barrels to 0.6 billion barrels. Proved reserves in EIA’s U.S. Crude Oil and Natural Gas Proved Reserves report for the Monterey/Santos shale play are withheld to avoid disclosure of individual company data. However, estimates of proved reserves in NEMS are 0.4 billion barrels, which result in 1 billion barrels of total TRR.

Key factors driving the adjustment included new geology information from a U. S. Geological Survey review of the Monterey shale and a lack of production growth relative to other shale plays like the Bakken and Eagle Ford. Geologically, the thermally mature area is 90% smaller than previously thought and is in a tectonically active area which has created significant natural fractures that have allowed oil to leave the source rock and accumulate in the overlying conventional oil fields, such as Elk Hills, Cat Canyon and Elwood South (offshore). Data also indicate the Monterey play is not over pressured and thus lacks the gas drive found in highly productive tight oil plays like the Bakken and Eagle Ford. The number of wells per square mile was revised down from 16 to 6 to represent horizontal wells instead of vertical wells. TRR estimates will likely continue to evolve over time as technology advances, and as additional geologic information and results from drilling activity provide a basis for further updates.

So the shale oil in the Monterey formation may have “migrated” from that convoluted geologic structure to sand deposits or elsewhere, leaving the productive potential much less.

I still don’t understand how it is possible to estimate any geologic reserve without reference to price, but there you have it.

I plan to move on to more manageable energy aggregates, like utility power loads and time series forecasts of consumption in coming posts.

But the shale oil and gas scene in the US is fascinating and a little scary. Part of the gestalt is the involvement of smaller players – not just BP and Exxon, for example. According to Chad Moutray, Economist for the National Association of Manufacturers, the fracking boom is a major stimulus to manufacturing jobs up and down the supply chain. But the productive life of a fracked oil or gas well is typically shorter than a conventional oil or gas well. So some claim that the increases in US production cannot be sustained or will not lead to any real period of “energy independence.” For my money, I need to watch this more before making that kind of evaluation, but the issue is definitely there.

Links, middle of June

Optimizing the current business setup does not appear to be triggering significant new growth – more like a convergence to secular stagnation, as Larry Summers has suggested.

So it’s important to document where the trends in new business and venture capital, as well as patents, are going.

The good news is you are looking at this, and via the Internet we can – with enough fumbling around – probably find a way out of this low to negative growth puzzle.

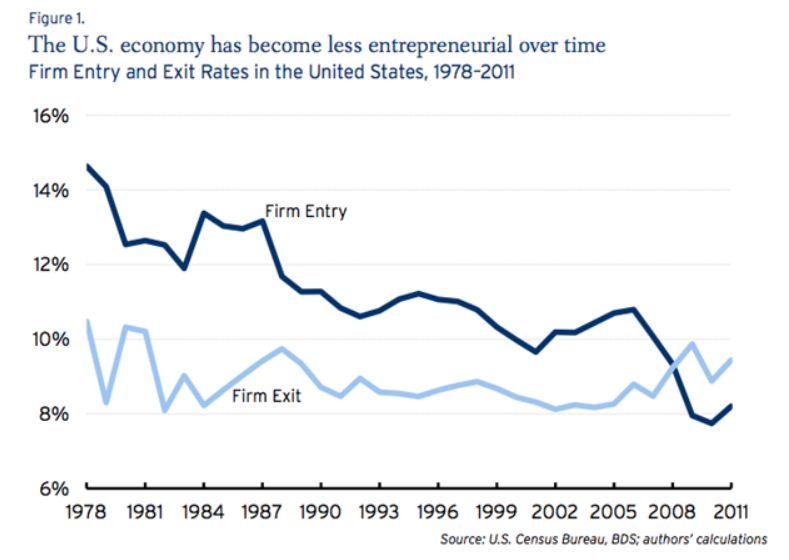
Declining Business Dynamism in the United States: A Look at States and Metros– Brookings Institution research shows more firms exited than entered business in all states and in virtually all metropolitan areas for more than a decade.

Businesentryexit

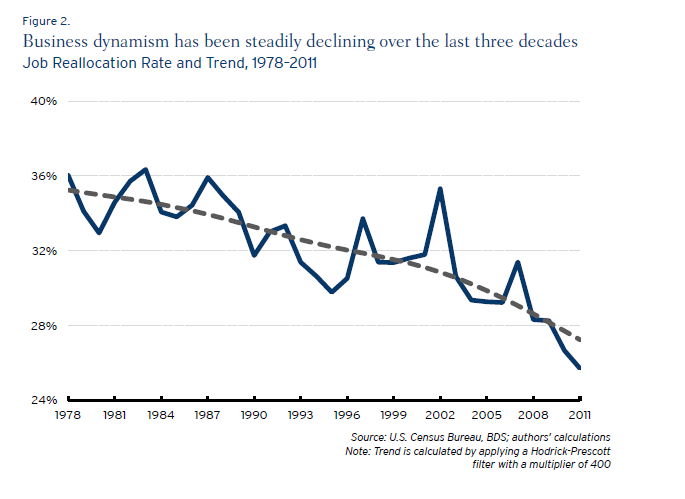
Job reallocation is another measure of new business formation, since startups mean new hires. It has fallen too.

jobreallocation

The Atlantic monthly blog on this topic is a nice read, if you don’t go through the Brookings report directly. It’s at The Rate of New Business Formation Has Fallen By Almost Half Since 1978.

The policy recommendation is reforming immigration. Apparently, about half Silicon Valley startups over some recent period were headed by entrepreneurs who were not born in the US. Currently, many positions in US graduate schools of engineering and science are occupied by foreign students. This seems like a promising proposal, but, of course, drat, Eric Cantor lost his bid in the Virginia Republican primary.

The Kauffman Foundation has an update for 2013 Entrepreneurial Activity Declines Again in 2013 as Labor Market Strengthens. There is an interesting report attached to this story exploring the concept that people starting new businesses is related to the level of unemployment.

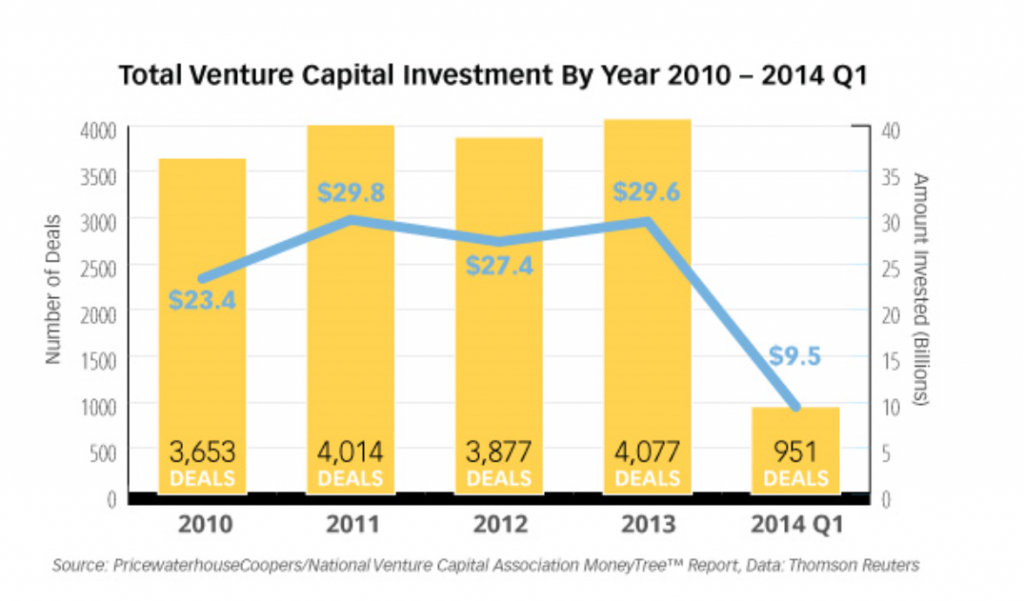
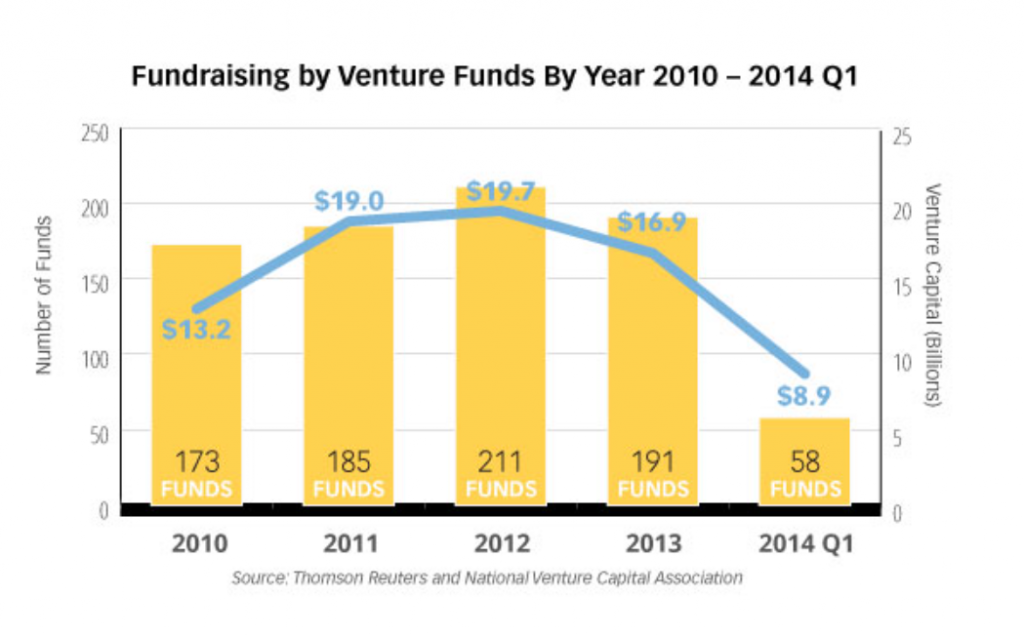
National Venture Capital Association statistics show that venture capital funding recovered from the Great Recession and has stabilized, but by no means has taken up the slack in new business formation.

VC1

There’s also this chart on venture capital funds –

VC2

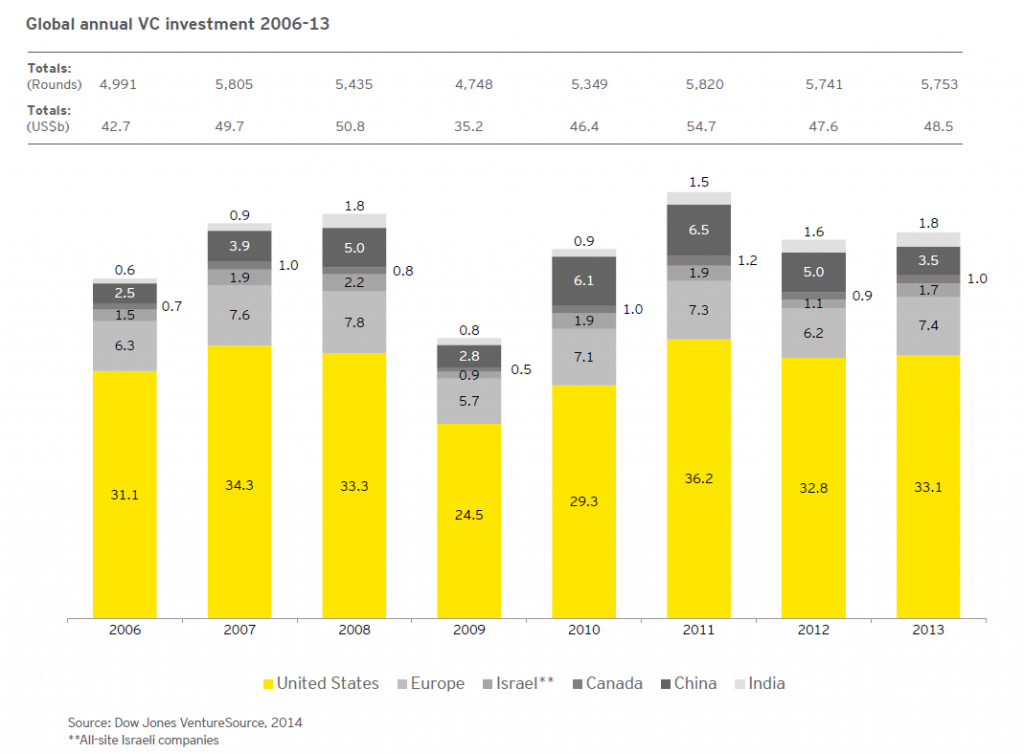
Of course, EY or what used to be called Ernst and Young produces a fairly authoritative annual report on venture capital activity globally. See Global Venture Capital Insights and Trends, 2014. This report shows global venture capital activity to have stabilized at about $50 billion in 2013.

EY

U.S. Firms Hold Record $1.64 Trillion in Cash With Apple in Lead – meanwhile, the largest US corporations amass huge cash reserves, much of it head abroad to take advantage of tax provisions.

Apple, whose cash pile surged to $158.8 billion from $5.46 billion in 2004, now holds 9.7 percent of total corporate cash outside the financial industry..

Firms in the technology industry kept $450 billion overseas — 47 percent of the total corporate cash pile held outside the U.S.

Federal Spending on Science, Already Down, Would Remain Tight

The Obama administration, constrained by spending caps imposed by Congress, suggested on Tuesday a federal budget for 2015 that would mean another year of cuts in the government’s spending on basic scientific research.

The budget of the National Institutes of Health, the largest provider of basic research money to universities, would be $30.4-billion, an increase of just $200-million from the current year. After accounting for inflation, that would be a cut of about 1 percent.

Three other leading sources of research money to universities—the National Science Foundation, the Department of Defense, and the National Aeronautics and Space Administration—also would see their science budgets shrink or grow slower than the expected 1.7-percent rate of inflation.

Over all, federal spending on research and development would increase only 1.2 percent, before inflation, in the 2015 fiscal year, which begins on October 1. The portion for basic research would fall 1 percent, a reduction that inflation would nearly triple.

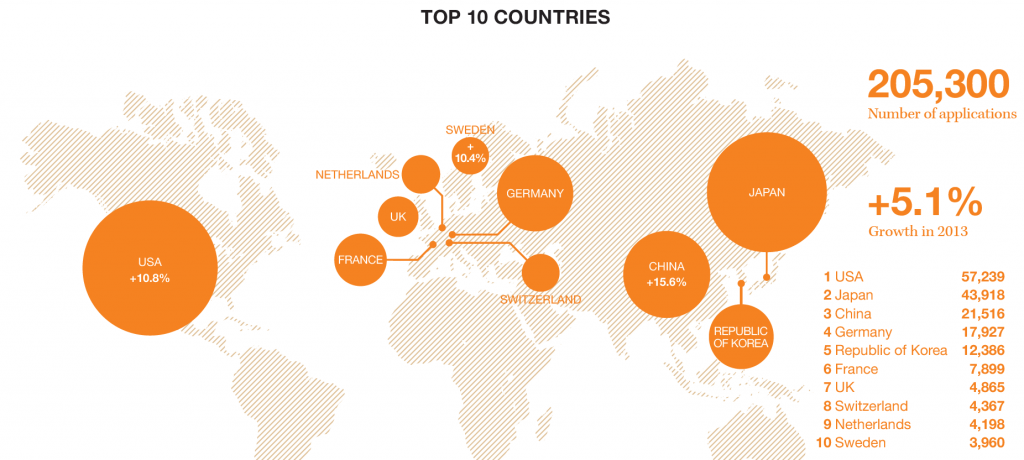
Latest Patent Filing Figures – World Intellectual Property Organization The infographic pertains to filings under the Patent Cooperation (PC) Treaty, under covers the largest number of patents. The World Intellectual Property Organization also provides information on Madrid and Hague System filings. Note the US and Japan are still at the top of the list, but that China has moved to number 3.

Patents

In general, a WIPO report for 2013 documents, IP [intellectual property] filings sharply rebounded in 2012, following a decrease in 2009, at the height of the financial crisis, and are now even exceeding pre-global economic crisis rates of growth.

Predicting the Singularity, the Advent of Superintelligence

From thinking about robotics, automation, and artificial intelligence (AI) this week, I’m evolving a picture of the future – the next few years. I think you have to define a super-technological core, so to speak, and understand how the systems of production, communication, and control mesh and interpenetrate across the globe. And how this sets in motion multiple dynamics.

But then there is the “singularity” –  whose main publicizer is Ray Kurzweil, current Director of Engineering at Google. Here’s a particularly clear exposition of his view.

There’s a sort of rebuttal by Paul Root Wolpe.

Part of the controversy, as in many arguments, is a problem of definition. Kurzweil emphasizes a “singularity” of superintelligence of machines. For him, the singularity is at first the point at which the processes of the human brain will be well understood and thinking machines will be available that surpass human capabilities in every respect. Wolpe, on the other hand, emphasizes the “event horizon” connotation of the singularity – that point beyond which out technological powers will have become so immense that it is impossible to see beyond.

And Wolpe’s point about the human brain is probably well-taken. Think, for instance, of how decoding the human genome was supposed to unlock the secrets of genetic engineering, only to find that there were even more complex systems of proteins and so forth.

And the brain may be much more complicated than the current mechanical models suggest – a view espoused by Roger Penrose, English mathematical genius. Penrose advocates a  quantum theory of consciousness. His point, made first in his book The Emperor’s New Mind, is that machines will never overtake human consciousness, because, in fact, human consciousness is, at the limit, nonalgorithmic. Basically, Penrose has been working on the idea that the brain is a quantum computer in some respect.

I think there is no question, however, that superintelligence in the sense of fast computation, fast assimilation of vast amounts of data, as well as implementation of structures resembling emotion and judgment – all these, combined with the already highly developed physical capabilities of machines, mean that we are going to meet some mojo smart machines in the next ten to twenty years, tops.

The dysutopian consequences are enormous. Bill Joy, co-founder of Sun Microsystems, wrote famously about why the future does not need us. I think Joy’s singularity is a sort of devilish mirror image of Kurzweil’s – for Joy the singularity could be a time when nanotechnology, biotechnology, and robotics link together to make human life more or less impossible, or significantly at risk.

There’s is much more to say and think on this topic, to which I hope to return from time to time.

Meanwhile, I am reminded of Voltaire’s Candide who, at the end of pursuing the theories of Dr. Pangloss, concludes “we must cultivate our garden.”

Robotics – the Present, the Future

A picture is worth one thousand words. Here are several videos, mostly from Youtube, discussing robotics and artificial intelligence (AI) and showing present and future capabilities. The videos fall in five areas – concepts with Andrew Ng, Industrial Robots and their primary uses, Military Robotics, including a presentation on predator drones, and some state-of-the-art innovations in robotics which mimic the human approach to a degree.

Andrew Ng  – The Future of Robotics and Artificial Intelligence

Car Factory – Kia Sportage factory production line

ABB Robotics – 10 most popular applications for robots


Predator Drones


Innovators: The Future of Robotic Warfare


Bionic kangaroo


The Duel: Timo Boll vs. KUKA Robot


The “Hollowing Out” of Middle Class America

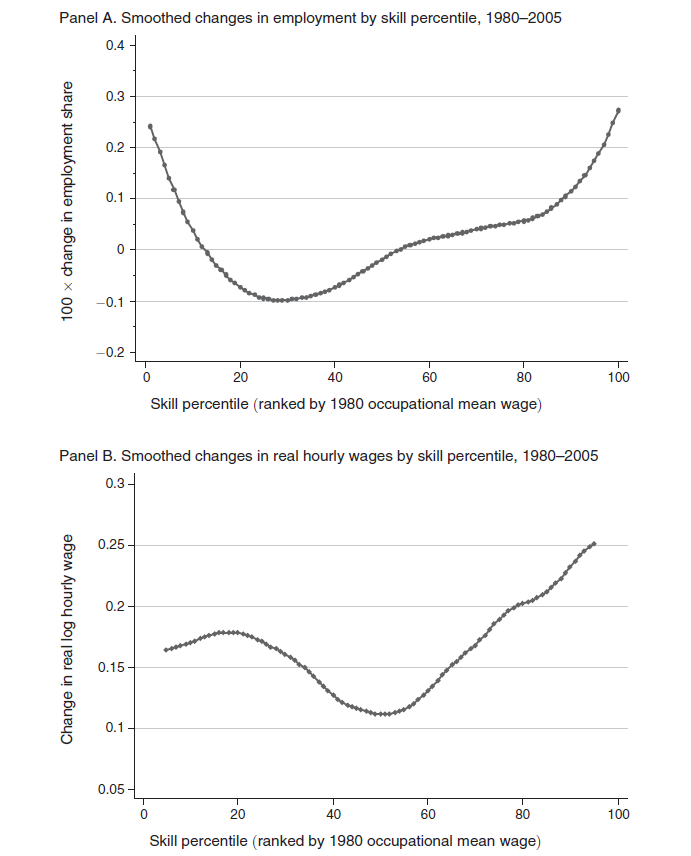
Two charts in a 2013 American Economic Review (AER) article put numbers to the “hollowing out” of middle class America – a topic celebrated with profuse anecdotes in the media.

Autor1

The top figure shows the change in employment 1980-2005 by skill level, based on Census IPUMS and American Community Survey (ACS) data. Occupations are ranked by skill level, approximated by wages in each occupation in 1980.

The lower figure documents the changes in wages of these skill levels 1980-2005.

These charts are from David Autor and David Dorn – The Growth of Low-Skill Service Jobs and the Polarization of the US Labor Market – who write that,

Consistent with the conventional view of skill-biased technological change, employment growth is differentially rapid in occupations in the upper two skill quartiles. More surprising in light of the canonical model are the employment shifts seen below the median skill level. While occupations in the second skill quartile fell as a share of employment, those in the lowest skill quartile expanded sharply. In net, employment changes in the United States during this period were strongly U-shaped in skill level, with relative employment declines in the middle of the distribution and relative gains at the tails. Notably, this pattern of employment polarization is not unique to the United States. Although not recognized until recently, a similar “polarization” of employment by skill level has been underway in numerous industrialized economies in the last 20 to 30 years.

So, employment and wage growth has been fastest in the past three or so decades (extrapolating to the present) in low skill and high skill occupations.

Among lower skill occupations, such as food service workers, security guards, janitors and gardeners, cleaners, home health aides, child care workers, hairdressers and beauticians, and recreational workers, employment grew 30 percent 1980-2005.

Among the highest paid occupations – classified as managers, professionals, technicians, and workers in finance, and public safety – the share of employment also grew by about 30 percent, but so did wages – which increased at about double the pace of the lower skill occupations over this period.

Professor Autor is in the MIT economics department, and seems to be the nexus of a lot of interesting research casting light on changes in US labor markets.

DavidAutor

In addition to “doing Big Data” as the above charts suggest, David Autor is closely associated with a new, common sense model of production activities, based on tasks and skills.

This model of the production process, enables Autor and his coresearchers to conclude that,

…recent technological developments have enabled information and communication technologies to either directly perform or permit the offshoring of a subset of the core job tasks previously performed by middle skill workers, thus causing a substantial change in the returns to certain types of skills and a measurable shift in the assignment of skills to tasks.

So it’s either a computer (robot) or a Chinaman who gets the middle-class bloke’s job these days.

And to drive that point home – (and, please, I consider the achievements of the PRC in lifting hundreds of millions out of extreme poverty to be of truly historic dimension) Autor with David Dorn and Gordon Hansen publihsed another 2013 article in the AER titled The China Syndrome: Local Labor Market Effects of Import Competition in the United States.

This study analyzes local labor markets and trade shocks to these markets, according to initial patterns of industry specialization.

The findings are truly staggering – or at least have been equivocated or obfuscated for years by special pleaders and lobbyists.

Dorn et al write,

The value of annual US goods imports from China increased by a staggering 1,156 percent from 1991 to 2007, whereas US exports to China grew by much less…. 

Our analysis finds that exposure to Chinese import competition affects local labor markets not just through manufacturing employment, which unsurprisingly is adversely affected, but also along numerous other margins. Import shocks trigger a decline in wages that is primarily observed outside of the manufacturing sector. Reductions in both employment and wage levels lead to a steep drop in the average earnings of households. These changes contribute to rising transfer payments through multiple federal and state programs, revealing an important margin of adjustment to trade that the literature has largely overlooked,

This research – conducted in terms of ordinary least squares (OLS), two stage least squares (2SLS) as well as “instrumental” regressions – is definitely not something a former trade unionist is going to ponder in the easy chair after work at the convenience store. So it’s kind of safe in terms of arousing the ire of the masses.

But I digress.

For my purposes here, Autor and his co-researchers put pieces of the puzzle in place so we can see the picture.

The US occupational environment has changed profoundly since the 1980’s. Middle class jobs have simply vanished over large parts of the landscape. More specifically, good-paying production jobs, along with a lot of other more highly paid, but routinized work, has been the target of outsourcing, often to China it seems it can be demonstrated. Higher paid work by professionals in business and finance benefits from complementarities with the advances in data processing and information technology (IT) generally. In addition, there are a small number of highly paid production workers whose job skills have been updated to run more automated assembly operations which seem to be the chief beneficiaries of new investment in production in the US these days.

There you have it.

Market away, and include these facts in any forecasts you develop for the US market.

Of course, there are issues of dynamics.