
More than 25,000 visited businessforecastblog, March 2012-December 2013, some spending hours on the site. Interest ran nearly 200 visitors a day in December, before my ability to post was blocked by a software glitch, and we did this re-boot.
Now I have hundreds of posts offline, pertaining to several themes, discussed below. How to put this material back up – as reposts, re-organized posts, or as longer topic summaries?
There’s a silver lining. This forces me to think through forecasting, predictive and data analytics.
One thing this blog does is compile information on which forecasting and data analytics techniques work, and, to some extent, how they work, how key results are calculated. I’m big on computation and performance metrics, and I want to utilize the SkyDrive more extensively to provide full access to spreadsheets with worked examples.
Often my perspective is that of a “line worker” developing sales forecasts. But there is another important focus – business process improvement. The strength of a forecast is measured, ultimately, by its accuracy. Efforts to improve business processes, on the other hand, are clocked by whether improvement occurs – whether costs of reaching customers are lower, participation rates higher, customer retention better or in stabilization mode (lower churn), and whether the executive suite and managers gain understanding of who the customers are. And there is a third focus – that of the underlying economics, particularly the dynamics of the institutions involved, such as the US Federal Reserve.
Right off, however, let me say there is a direct solution to forecasting sales next quarter or in the coming budget cycle. This is automatic forecasting software, with Forecast Pro being one of the leading products. Here’s a YouTube video with the basics about that product.
You can download demo versions and participate in Webinars, and attend the periodic conferences organized by Business Forecast Systems showcasing user applications in a wide variety of companies.
So that’s a good solution for starters, and there are similar products, such as the SAS/ETS time series software, and Autobox.
So what more would you want?
Well, there’s need for background information, and there’s a lot of terminology. It’s useful to know about exponential smoothing and random walks, as well as autoregressive and moving averages. Really, some reaches of this subject are arcane, but nothing is worse than a forecast setup which gains the confidence of stakeholders, and then falls flat on its face. So, yes, eventually, you need to know about “pathologies” of the classic linear regression (CLR) model – heteroscedasticity, autocorrelation, multicollinearity, and specification error!
And it’s good to gain this familiarity in small doses, in connection with real-world applications or even forecasting personalities or celebrities. After a college course or two, it’s easy to lose track of concepts. So you might look at this blog as a type of refresher sometimes.
Anticipating Turning Points in Time Series
But the real problem comes with anticipating turning points in business and economic time series. Except when modeling seasonal variation, exponential smoothing usually shoots over or under a turning point in any series it is modeling.
If this were easy to correct, macroeconomic forecasts would be much better. The following chart highlights the poor performance, however, of experts contributing to the quarterly Survey of Professional Forecasters, maintained by the Philadelphia Fed.
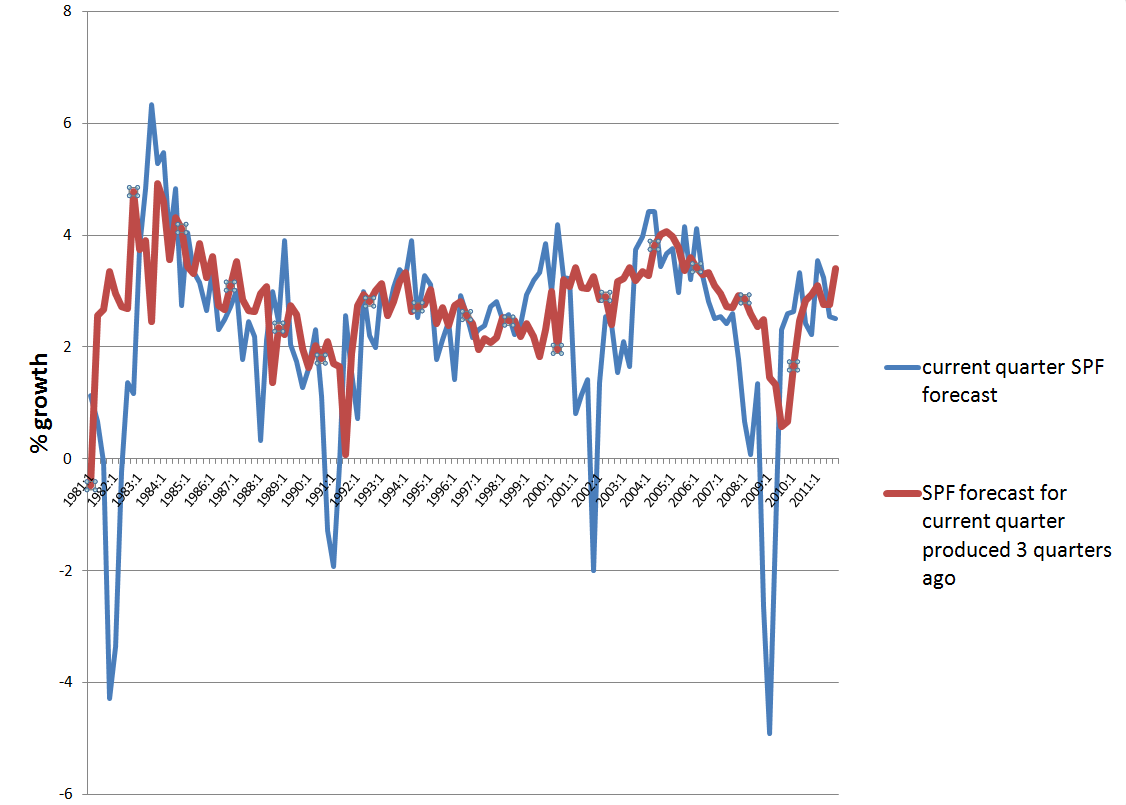
So, the red line is the SPF consensus forecast for GDP growth on a three quarter horizon, and the blue line is the forecast or nowcast for the current quarter (there is a delay in release of current numbers). Notice the huge dips in the current quarter estimate, associated with four recessions 1981, 1992, 2001-2, and 2008-9. A mere three months prior to these catastrophic drops in growth, leading forecasters at big banks, consulting companies, and universities totally missed the boat.
This is important in a practical sense, because recessions turn the world of many businesses upside down. All bets are off. The forecasting team is reassigned or let go as an economy measure, and so forth.
Some forward-looking information would help business intelligence focus on reallocating resources to sustain revenue as much as possible, using analytics to design cuts exerting the smallest impact on future ability to maintain and increase market share.
Hedgehogs and Foxes
Nate Silver has a great table in his best-selling The
Signal and the Noise on the qualities and forecasting performance of hedgehogs and foxes. The idea comes from a Greek poet, “The fox knows many little things, but the hedgehog knows one big thing.”
Following Tetlock, Silver finds foxes are multidisplinary, adaptable, self-critical, cautious, and empirical, tolerant of complexity. By contrast, the Hedgehog is specialized, sticks to the same approaches, stubbornly adheres to his model in spite of counter-evidence, is order-seeking, confident, and ideological. The evidence suggests foxes generally outperform hedgehogs, just as ensemble methods typically outperform a single technique in forecasting.
Message – be a fox.
So maybe this can explain some of the breadth of this blog. If we have trouble predicting GDP growth, what about forecasts in other areas – such as weather, climate change, or that old chestnut, sun spots? And maybe it is useful to take a look at how to forecast all the inputs and associated series – such as exchange rates, growth by global region, the housing market, interest rates, as well as profits.
And while we are looking around, how about brain waves? Can brain waves be forecast? Oh yes, it turns out there is a fascinating and currently applied new approach called neuromarketing, which uses headbands and electrodes, and even MRI machines, to detect deep responses of consumers to new products and advertising.
New Methods
I know I have not touched on cluster analysis and classification, areas making big contributions to improvement of business process. But maybe if we consider the range of “new” techniques for predictive analytics, we can see time series forecasting and analysis of customer behavior coming under one roof.
There is, for example, this many predictor thread emerging in forecasting in the late 1990’s and especially in the last decade with factor models for macroeconomic forecasting. Reading this literature, I’ve become aware of methods for mapping N explanatory variables onto a target variable, when there are M<N observations. These are sometimes called methods of data shrinkage, and include principal components regression, ridge regression, and the lasso. There are several others, and a good reference is The Elements of Statistical Learning, Data Mining, Learning and Prediction, 2nd edition, by Trevor Hastie, Robert Tibshirani, and Jerome Friedman. This excellent text is downloadable, accessible via the Tools, Apps, Texts, Free Stuff menu option located just to the left of the search utility on the heading for this blog.
There also is bagging, which is the topic of the previous post, as well as boosting, and a range of decision tree and regression tree modeling tactics, including random forests.
I’m actively exploring a number of these approaches, ginning up little examples to see how they work and how the computation goes. So far, it’s impressive. This stuff can really improve over the old approaches, which someone pointed out, have been around since the 1950’s at least.
It’s here I think that we can sight the on-coming wave, just out there on the horizon – perhaps hundreds of feet high. It’s going to swamp the old approaches, changing market research forever and opening new vistas, I think, for forecasting, as traditionally understood.
I hope to be able to ride that wave, and now I put it that way, I get a sense of urgency in keeping practicing my web surfing.
Hope you come back and participate in the comments section, or email me at [email protected]