Well, the first official forecast rolled out for QQQ last week.
It did relatively well. Applying methods I have been developing for the past several months, I predicted the weekly high for QQQ last week at 108.98.
In fact, the high price for QQQ for the week was 108.38, reached Monday, April 13.
This means the forecast error in percent terms was 0.55%.
It’s possible to look more comprehensively at the likely forecast errors with my approach with backtesting.
Here is a chart showing backtests for the “proximity variable method” for the QQQ high price for five day trading periods since the beginning of 2015.
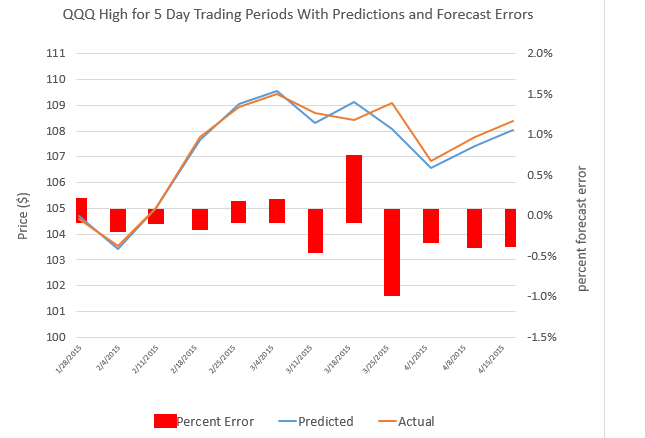
The red bars are errors, and, from their axis on the right, you can see most of these are below 0.5%.
This is encouraging, and there are several adjustments which may improve forecasting performance beyond this level of accuracy I want to explore.
So here is the forecast of the high prices that will be reached by QQQ and SPY for the week of April 20-24.
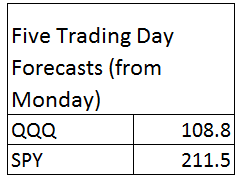
As you can see, I’ve added SPY, an ETF tracking the S&P500.
I put this up on Businessforecastblog because I seek to make a point – namely, that I believe methods I have developed can produce much more accurate forecasts of stock prices.
It’s often easier and more compelling to apply forecasting methods and show results, than it is to prove theoretically or otherwise argue that a forecasting method is worth its salt.
Disclaimer – These forecasts are for informational purposes only. If you make investments based on these numbers, it is strictly your responsibility. Businessforecastblog is not responsible or liable for any potential losses investors may experience in their use of any forecasts presented in this blog.
Well, I am working on several stock forecasts to add to projections for these ETF’s – so will expand this feature in forthcoming Mondays.