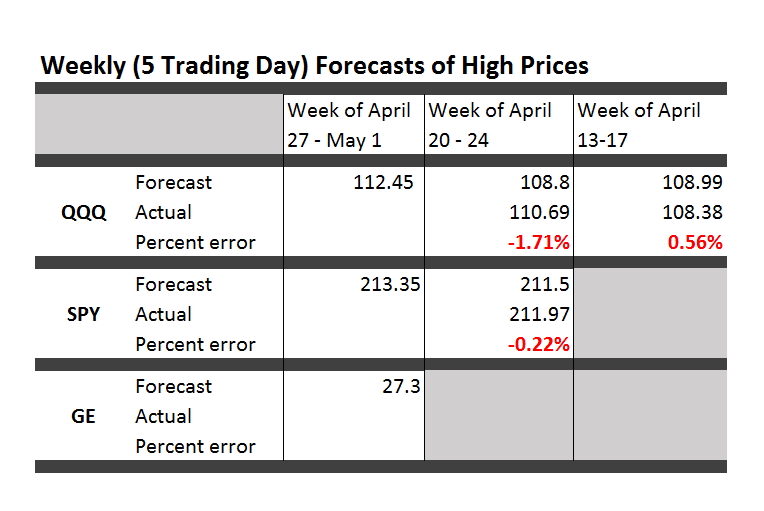
Here are forecasts of the weekly high price for three securities. These include intensely traded exchange traded funds (ETF’s) and a blue chip stock – QQQ, SPY, and GE.
The table also shows the track record so far.
All the numbers not explicitly indicated as percents are in US dollars.
These forecasts come with disclaimers. They are presented purely for scientific and informational purposes. This blog takes no responsibility for any investment gains or losses that might be linked with these forecasts. Invest at your own risk.
So having said that, some implications and background information.
First of all, it looks like it’s off to the races for the market as a whole this week, although possibly not for GE. The highs for the ETF’s all show solid gains.
Note, too, that these are forecasts of the high price which will be reached over the next five trading days, Monday through Friday of this week.
Key features of the method are now available in a white paper published under the auspices of the University of Munich – Predictability of the daily high and low of the S&P 500 index. This research shows that the so-called proximity variables achieve higher accuracies in predicting the daily high and low prices for the S&P 500 than do benchmark approaches, such as the no-change forecast and forecasts from an autoregressive model.
Again, caution is advised in making direct application of the methods in the white paper to the current problem –forecasting the high for a five day trading period. There have been many modifications.
That’s, of course, one reason for the public announcements of forecasts from the NPV (new proximity variable) model.
Go real-time, I’ve been advised. It makes the best case, or at least exposes the results to the light of day.
Based on backtesting, I expect forecasts for GE to be less accurate than those for QQQ and SPY. In terms of mean absolute percent error (MAPE), we are talking around 1% for QQQ and SPY and, maybe, 1.7% for GE.
The most reliable element of these forecasts are the indicated directions of change from the previous period highs.
Features and Implications
There are other several other features which are reliably predicted by the NPV models. For example, forecasts for the low price or even closing prices on Friday can be added – although closing prices are less reliable. Obviously, too, volatility metrics are implied by predictions of the high and low prices.
These five-trading day forecasts parallel the results for daily periods documented in the above-cited white paper. That is, the NPV forecast accuracy for these securities in each case beats “no-change” and autoregressive model forecasts.
Focusing on stock market forecasts has “kept me out of trouble” recently. I’m focused on quantitative modeling, and am not paying a lot of attention to global developments – such as the ever- impending Greek default or, possibly, exit from the euro. Other juicy topics include signs of slowing in the global economy, and the impact of armed conflict on the Arabian Peninsula on the global price of oil. These are great topics, but beyond hearsay or personal critique, it is hard to pin things down just now.
So, indeed, I may miss some huge external event which tips this frothy stock market into reverse – but, at the same time, I assure you, once a turning point from some external disaster takes place, the NPV models should do a good job of predicting the extent and duration of such a decline.
On a more optimistic note, my research shows the horizons for which the NPV approach applies and does a better job than the benchmark models. I have, for example, produced backtests for quarterly SPY data, demonstrating continuing superiority of the NPV method.
My guess – and I would be interested in validating this – is that the NPV approach connects with dominant trader practice. Maybe stock market prices are, in some sense, a random walk. But the reactions of traders to daily price movements create short term order out of randomness. And this order can emerge and persist for relatively long periods. And, not only that, but the NPV approach is linked with self-reinforcing tendencies, so that awareness may just make predicted effects more pronounced. That is, if I tell you the high price of a security is going up over the coming period, your natural reaction is to buy in – thus reinforcing the prediction. And the prediction is not just public relations stunt or fluff. The first prediction is algorithmic, rather than wishful and manipulative. Thus, the direction of change is more predictable than the precise extent of price change.
In any case, we will see over coming weeks how well these models do.

