Churn analysis is a staple of predictive analytics and big data. The idea is to identify attributes of customers who are likely leave a mobile phone plan or other subscription service, or, more generally, switch who they do business with. Knowing which customers are likely to “churn” can inform customer retention plans. Such customers, for example, may be contacted in targeted call or mailing campaigns with offers of special benefits or discounts.
Lift is a concept in churn analysis. The lift of a target group identified by churn analysis reflects the higher proportion of customers who actually drop the service or give someone else their business, when compared with the population of customers as a whole. If, typically, 2 percent of customers drop the service per month, and, within the group identified as “churners,” 8 percent drop the service, the “lift” is 4.
In interesting research, originally published in the Harvard Business Review, Gregory Piatetsky-Shapiro questions the efficacy of big data applied to churn analysis – based on an estimation of costs and benefits.
We looked at some 30 different churn-modeling efforts in banking and telecom, and surprisingly, although the efforts used different data and different modeling algorithms, they had very similar lift curves. The lists of top 1% likely defectors had a typical lift of around 9-11. Lists of top 10% defectors all had a lift of about 3-4. Very similar lift curves have been reported in other work. (See here and here.) All this suggests a limiting factor to prediction accuracy for consumer behavior such as churn.
Backtracking through earlier research by Piatetsky-Shapiro and his co-researchers, there is this nugget,
For targeted marketing campaigns, a good model lift at T, where T is the target rate in the overall population, is usually sqrt(1/T) +/- 20%.
So, if the likely “churners” are 5 percent of the customer group, a reasonable expectation of the lift that can be obtained from churn analysis is 4.47. This means probably no more than 25 percent of the target group identified by the churn analysis will, in fact, do business elsewhere in the defined period.
This is a very applied type of result, based on review of 30 or more studies.
But the point Piatetsky-Shapiro make is that big data probably can’t push these lift numbers much higher, because of the inherent randomness in the behavior of consumers. And small gains to existing methods simply do not meet a cost/benefit criterion.
Some Israeli researchers may in fact best these numbers with a completely different approach based on social network analysis. Their initial working hypothesis was that social influence on churn is highly dominant in relatively tight social groups. Their approach is clearly telecommunications-based, since they analyzed patterns of calling between customers, identifying networks of callers who had more frequent communications.
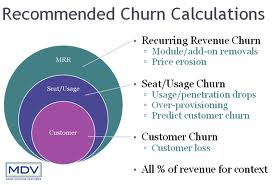
Still, there is a good argument for an evolution from standard churn analysis to predictive analytics that uncovers the value-at-risk in the customer base, or even the value that can be saved by customer retention programs. Customers who have trouble paying their bill, for example, might well be romanced less strongly by customer retention efforts, than premium customers.
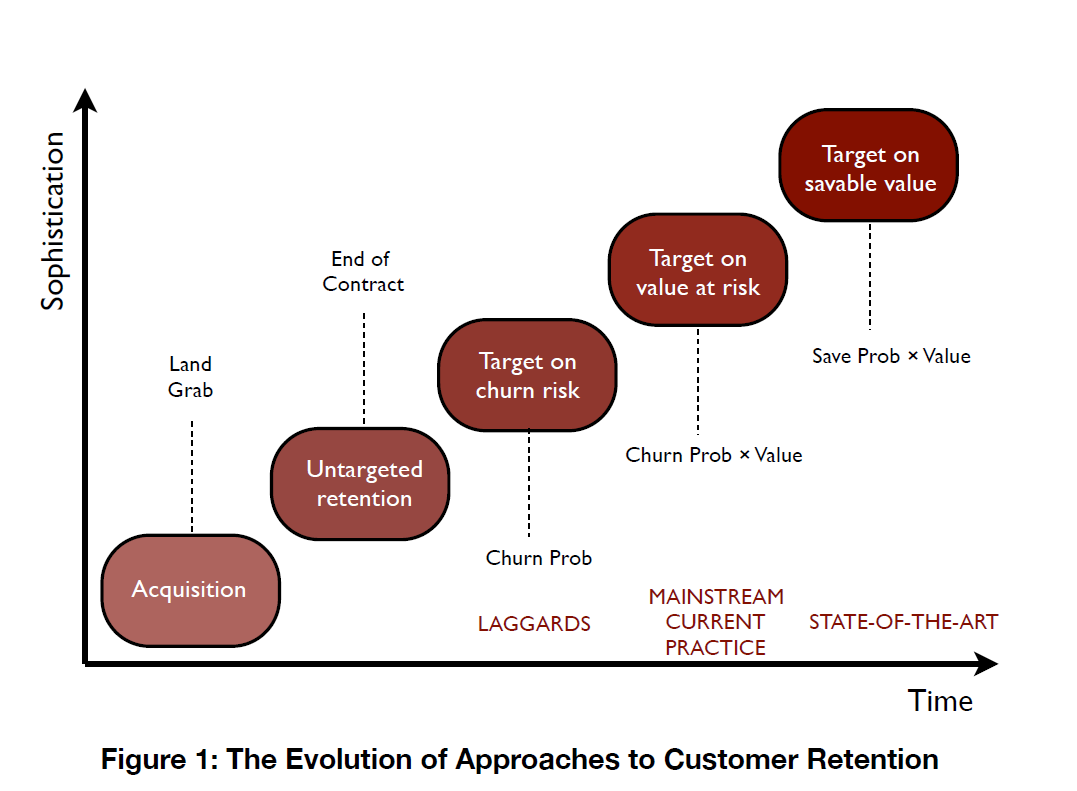
Along these lines, I enjoyed reading the Stochastic Solutions piece on who can be saved and who will be driven away by retention activity, which is responsible for the above graphic.
It has been repeatedly demonstrated that the very act of trying to ‘save’ some customers provokes them to leave. This is not hard to understand, for a key targeting criterion is usually estimated churn probability, and this is highly correlated with customer dissatisfaction. Often, it is mainly lethargy that is preventing a dissatisfied customer from actually leaving. Interventions designed with the express purpose of reducing customer loss can provide an opportunity for such dissatisfaction to crystallise, provoking or bringing forward customer departures that might otherwise have been avoided, or at least delayed. This is especially true when intrusive contact mechanisms, such as outbound calling, are employed. Retention programmes can be made more effective and more profitable by switching the emphasis from customers with a high probability of leaving to those likely to react positively to retention activity.
This is a terrific point. Furthermore,
..many customers are antagonised by what they feel to be intrusive contact mechanisms; indeed, we assert without fear of contradiction that only a small proportion of customers are thrilled, on hearing their phone ring, to discover that the caller is their operator. In some cases, particularly for customers who are already unhappy, such perceived intrusions may act not merely as a catalyst but as a constituent cause of churn.
Bottom-line, this is among the most interesting applications of predictive analytics.
Logistic regression is a favorite in analyzing churn data, although techniques range from neural networks to regression trees.