What we really want to know, in terms of real estate market projections, is the current or effective interest elasticity of home sales.
So, given that the US Federal Reserve has embarked on the “taper,” we know long term interest rates will rise (and have since the end of 2012).
What, then, is the likely impact of moving the 30 year fixed mortgage rate from around 4 percent back to its historic level of six percent or higher?
What is an Interest Elasticity?
Recall that the concept of a demand elasticity here is the percentage change in demand – this case housing sales, divided by the percentage change in the mortgage interest rate.
Typically, thus, the interest elasticity of housing demand is a negative number, indicating that higher interest rates result in lower housing demand, other things being equal.
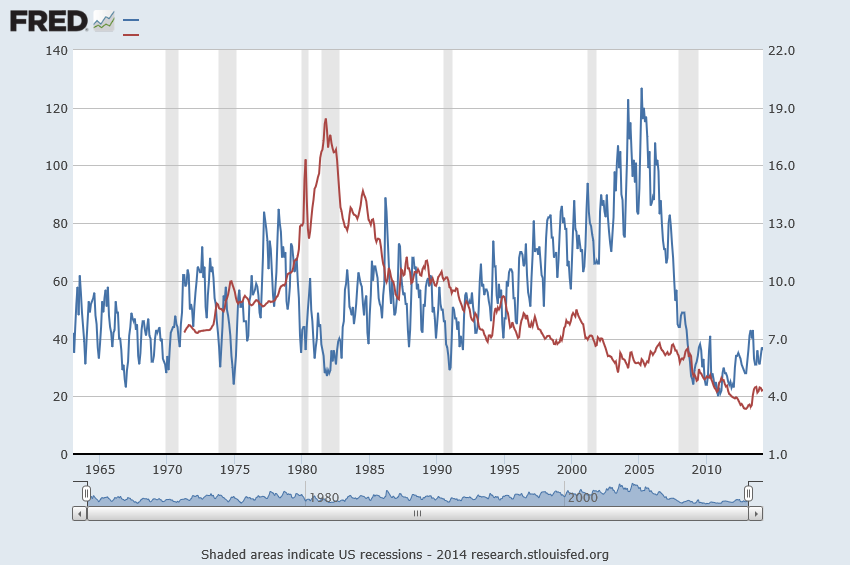
This “other things being equal” (ceteris paribus) is the hooker, of course, as is suggested by the following chart from FRED.
Here the red line is the 30 year fixed mortgage rate (right vertical axis) and the blue line is housing sales (left vertical axis).
A Rough and Ready Interest Rate Elasticity
Now the thing that jumps out at you when you glance over these two curves is the way housing sales (the blue line) drops when the 30 year fixed mortgage rate went through the roof in about 1982, reaching a peak of nearly 20 percent.
After the rates came down again in about 1985, an approximately 20 year period of declining mortgage interest rates ensued – certainly with bobbles and blips in this trend.
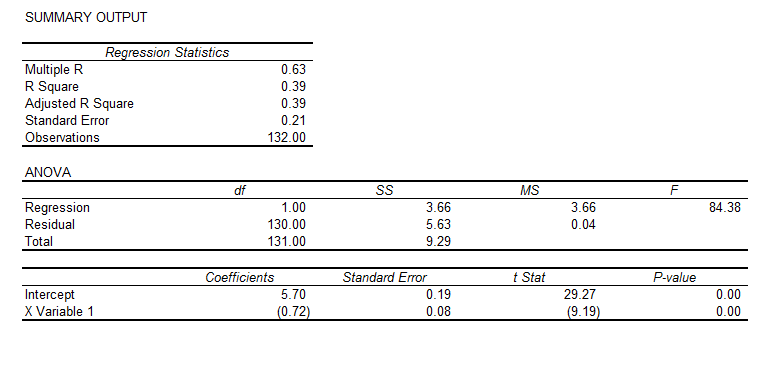
Now suppose we take just the period 1975-85, and calculate a simple interest rate elasticity. This involves getting the raw numbers behind these lines on the chart, and taking log transformations of them. We calculate the regression,
 This corresponds to the equation,
ln(sales)= 5.7 – 0.72*ln(r)
where the t-statistics of the constant term and coefficient of the log of the interest rate r are highly significant, statistically.
This equation implies that the interest elasticity of housing sales in this period is -0.72. So a 10 percent increase in the 30-year fixed mortgage rate is associated with an about 7 percent reduction in housing sales, other things being equal.
In the spirit of heroic generalization, let’s test this elasticity by looking at the reduction in the mortgage rate after 1985 to 2005, and compare this percent change with the change in the housing sales over this period.
So at the beginning of 1986, the mortgage rate was 10.8 and sales were running 55,000 per month. At the end of 2005, sales had risen to 87, 000 per month and the 30 year mortgage rate for December was 6.27.
So the mortgage interest rates fell by 53 percent and housing sales rose 45 percent – calculating these percentage changes over the average base of the interest rates and house sales. Applying a -0.72 price elasticity to the (negative) percent change in interest rates suggests an increase in housing sales of 38 percent.
That’s quite remarkable, considering other factors operative in this period, such as consistent population growth.
OK, so looking ahead, if the 30 year fixed mortgage rate rises 33 percent to around 6 percent, housing sales could be expected to drop around 20-25 percent.
Interestingly, recent research conducted at the Wharton School and the Board of Governors of the Federal Reserve suggests that,
The relationship between the mortgage interest rate and a household’s demand for mortgage debt has important implications for a host of public policy questions. In this paper, we use detailed data on over 2.7 million mortgages to provide novel estimates of the interest rate elasticity of mortgage demand. Our empirical strategy exploits a discrete jump in interest rates generated by the conforming loan limit|the maximum loan size eligible for securitization by Fannie Mae and Freddie Mac. This discontinuity creates a large notch” in the intertemporal budget constraint of prospective mortgage borrowers, allowing us to identify the causal link between interest rates and mortgage demand by measuring the extent to which loan amounts bunch at the conforming limit. Under our preferred specifications, we estimate that 1 percentage point increase in the rate on a 30-year fixed-rate mortgage reduces first mortgage demand by between 2 and 3 percent. We also present evidence that about one third of the response is driven by borrowers who take out second mortgages while leaving their total mortgage balance unchanged. Accounting for these borrowers suggests a reduction in total mortgage debt of between 1.5 and 2 percent per percentage point increase in the interest rate. Using these estimates, we predict the changes in mortgage demand implied by past and proposed future increases to the guarantee fees charged by Fannie and Freddie. We conclude that these increases would directly reduce the dollar volume of new mortgage originations by well under 1 percent.
So a 33 percent increase in the 30 year fixed mortgage rate, according to this analysis, would reduce mortgage demand by well under 33 percent. So how about 20-25 percent?
I offer this “take-off” as an example of an exploratory analysis. Thus, the elasticity estimate developed with data from the period of greatest change in rates provides a ballpark estimate of the change in sales over a longer period of downward trending interest rates. This supports a forward projection, which, at a first order approximation seem consistent with estimates from a completely different line of analysis.
All this suggests a more comprehensive analysis might be warranted, taking into account population growth, inflation, and, possibly, other factors.
The marvels of applied economics in a forecasting context.
Lead picture courtesy of the University of Maryland Department of Economics.

