I got a chance to work with the problem of forecasting during a business downturn at Microsoft 2007-2010.
Usually, a recession is not good for a forecasting team. There is a tendency to shoot the messenger bearing the bad news. Cost cutting often falls on marketing first, which often is where forecasting is housed.
But Microsoft in 2007 was a company which, based on past experience, looked on recessions with a certain aplomb. Company revenues continued to climb during the recession of 2001 and also during the previous recession in the early 1990’s, when company revenues were smaller.
But the plunge in markets in late 2008 was scary. Microsoft’s executive team wanted answers. Since there were few forthcoming from the usual market research vendors – vendors seemed sort of “paralyzed” in bringing out updates – management looked within the organization.
I was part of a team that got this assignment.
We developed a model to forecast global software sales across more than 80 national and regional markets. Forecasts, at one point, were utilized in deliberations of the finance directors, developing budgets for FY2010. Our Model, by several performance comparisons, did as well or better than what was available in the belated efforts of the market research vendors.
This was a formative experience for me, because a lot of what I did, as the primary statistical or econometric modeler, was seat-of-the-pants. But I tried a lot of things.
That’s one reason why this blog explores method and technique – an area of forecasting that, currently, is exploding.
Importance of the Problem
Forecasting the downswing in markets can be vitally important for an organization, or an investor, but the first requirement is to keep your wits. All too often there are across-the-board cuts.
A targeted approach can be better. All market corrections, inflections, and business downturns come to an end. Growth resumes somewhere, and then picks up generally. Companies that cut to the bone are poorly prepared for the future and can pay heavily in terms of loss of market share. Also, re-assembling the talent pool currently serving the organization can be very expensive.
But how do you set reasonable targets, in essence – make intelligent decisions about cutbacks?
I think there are many more answers than are easily available in the management literature at present.
But one thing you need to do is get a handle on the overall swing of markets. How long will the downturn continue, for example?
For someone concerned with stocks, how long and how far will the correction go? Obviously, perspective on this can inform shorting the market, which, my research suggests, is an important source of profits for successful investors.
A New Approach – Deploying high frequency data
Based on recent explorations, I’m optimistic it will be possible to get several weeks lead-time on releases of key US quarterly macroeconomic metrics in the next downturn.
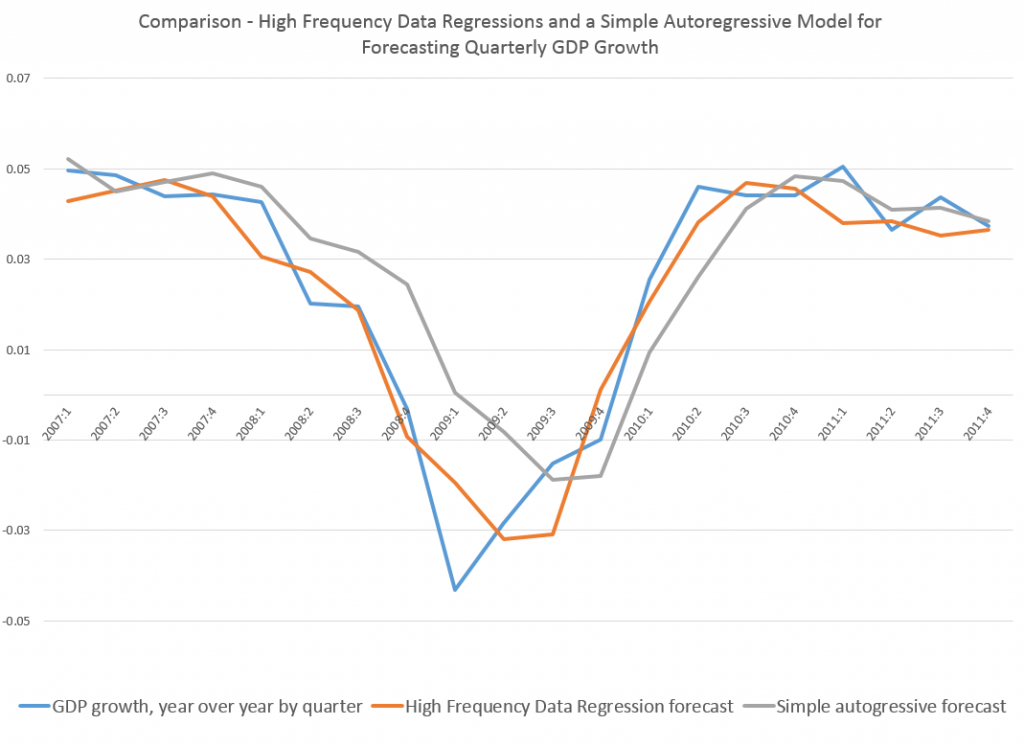
My last post, for example, has this graph.
Note how the orange line hugs the blue line during the descent 2008-2009.
This orange line is the out-of-sample forecast of quarterly nominal GDP growth based on the quarter previous GDP and suitable lagged values of the monthly Chicago Fed National Activity Index. The blue line, of course, is actual GDP growth.
The official name for this is Nowcasting and MIDAS or Mixed Data Sampling techniques are widely-discussed approaches to this problem.
But because I was only mapping monthly and not, say, daily values onto quarterly values, I was able to simply specify the last period quarterly value and fifteen lagged values of the CFNAI in a straight-forward regression.
And in reviewing literature on MIDAS and mixing data frequencies, it is clear to me that, often, it is not necessary to calibrate polynomial lag expressions to encapsulate all the higher frequency data, as in the classic MIDAS approach.
Instead, one can deploy all the “many predictors” techniques developed over the past decade or so, starting with the work of Stock and Watson and factor analysis. These methods also can bring “ragged edge” data into play, or data with different release dates, if not different fundamental frequencies.
So, for example, you could specify daily data against quarterly data, involving perhaps several financial variables with deep lags – maybe totaling more explanatory variables than observations on the quarterly or lower frequency target variable – and wrap the whole estimation up in a bundle with ridge regression or the LASSO. You are really only interested in the result, the prediction of the next value for the quarterly metric, rather than unbiased estimates of the coefficients of explanatory variables.
Or you could run a principal component analysis of the data on explanatory variables, including a rag-tag collection of daily, weekly, and monthly metrics, as well as one or more lagged values of the higher frequency variable (quarterly GDP growth in the graph above).
Dynamic principal components also are a possibility, if anyone can figure out the estimation algorithms to move into a predictive mode.
Being able to put together predictor variables of all different frequencies and reporting periods is really exciting. Maybe in some way this is really what Big Data means in predictive analytics. But, of course, progress in this area is wholly empirical, it not being clear what higher frequency series can successfully map onto the big news indices, until the analysis is performed. And I think it is important to stress the importance of out-of-sample testing of the models, perhaps using cross-validation to estimate parameters if there is simply not enough data.
One thing I believe is for sure, however, and that is we will not be in the dark for so long during the next major downturn. It will be possible to deploy all sorts of higher frequency data to chart the trajectory of the downturn, probably allowing a call on the turning point sooner than if we waited for the “big number” to come out officially.
Top picture courtesy of the Bridgespan Group

