Greetings, Sports Fans. I’m back from visiting with some relatives in Kent in what is still called the United Kingdom (UK). I’ve had some time to think over the blog and possible directions in the next few weeks.
I’ve not made any big decisions – except to realize there is lots more to modern forecasting research, even on an applied level, than is encapsulated in any book I know of.
But I plan several posts on volatility.
What is Volatility in Finance?
Since this blog functions as a gateway, let’s talk briefly about volatility in finance generally.
In a word, financial volatility refers to the variability of prices of financial assets.
And how do you measure this variability?
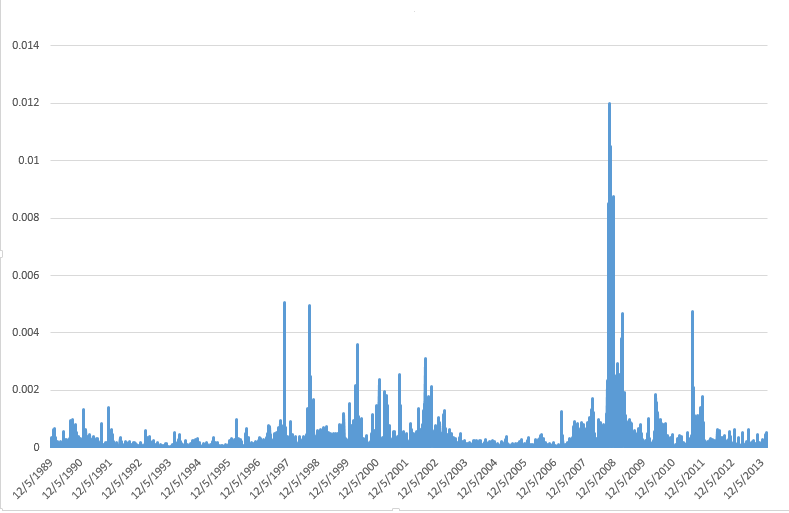
Well, by considering something like the variance of a set of prices, or time series of financial prices. For example, you might take daily closing prices of the S&P 500 Index, calculate the daily returns, and square them. This would provide a metric for the variability of the S&P 500 over a daily interval, and would give you a chart looking like the following, where I have squared the running differences of the log of the closing prices.
Clearly, prices get especially volatile just before and during periods of economic recession, when there is a clustering of higher volatility measurements.
This clustering effect is one of the two or three well-established stylized facts about financial volatility.
Can You Forecast Volatility?
This is the real question.
And, obviously, the existence of this clustering of high volatility events suggests that some forecastability does exist.
And, notice also, that we are looking at a key element of a variance of these financial prices – the other elements more or less dropping by the wayside since they add (or subtract) or divide the series in the above chart by constants.
One immediate conclusion, therefore, is that the variability of the S&P 500 daily returns is heteroscedastic, which is the opposite of the usual assumption in regression and other statistical research that a nice series to model is one in which all the variances of the errors are constant.
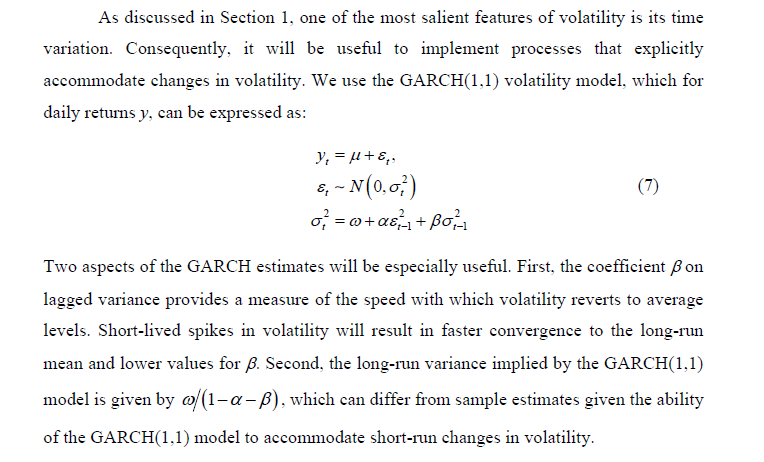
Anyway, a GARCH model, such as described in the following screen capture, is one of the most popular ways of modeling this changing variance of the volatility of financial returns.
GARCH stands for generalized autoregressive conditional heteroscedascity, and the screen capture comes from a valuable recent work called Futures Market Volatility: What Has Changed?
The VIX Index
There are many related acronyms and a whole cottage industry in financial econometrics, but I want to first mention here the Chicago Board Options Exchange (CBOE) VIX or Volatility Index.
The VIX provides a measure of the implied volatility of options with a maturity of 30 days on the S&P500 index from eight different SPX option series. It therefore is a measure of the market expectation of volatility over the next 30 days. Also known as the “fear gauge,” the VIX index tends to rise in times of market turmoil and large price movements.
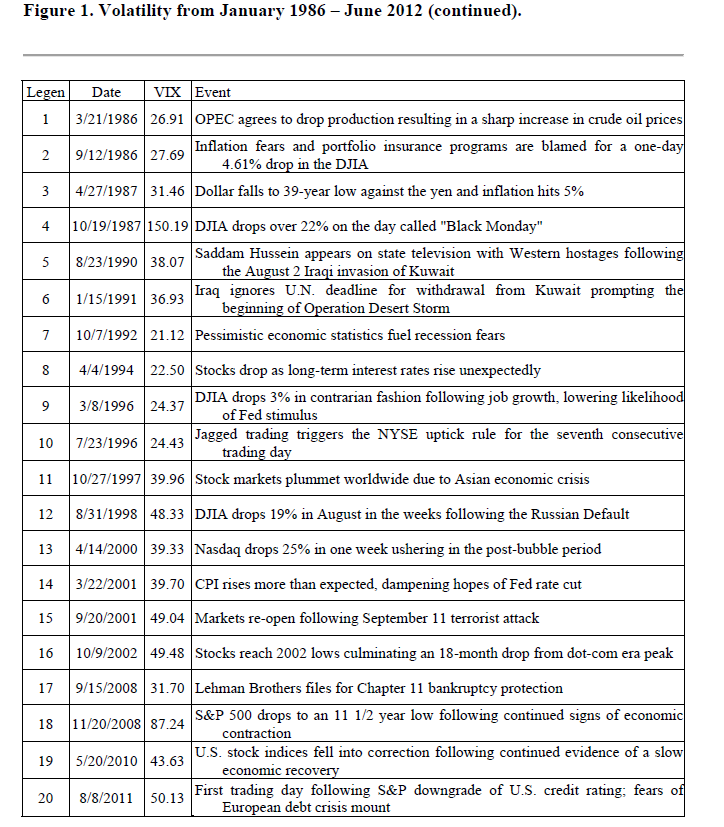
Futures Market Volatility: What Has Changed? Provides an overview of stock market volatility over time, and has an interesting accompanying table suggesting that upward spikes in the VIX are associated with unexpected macro or political developments.
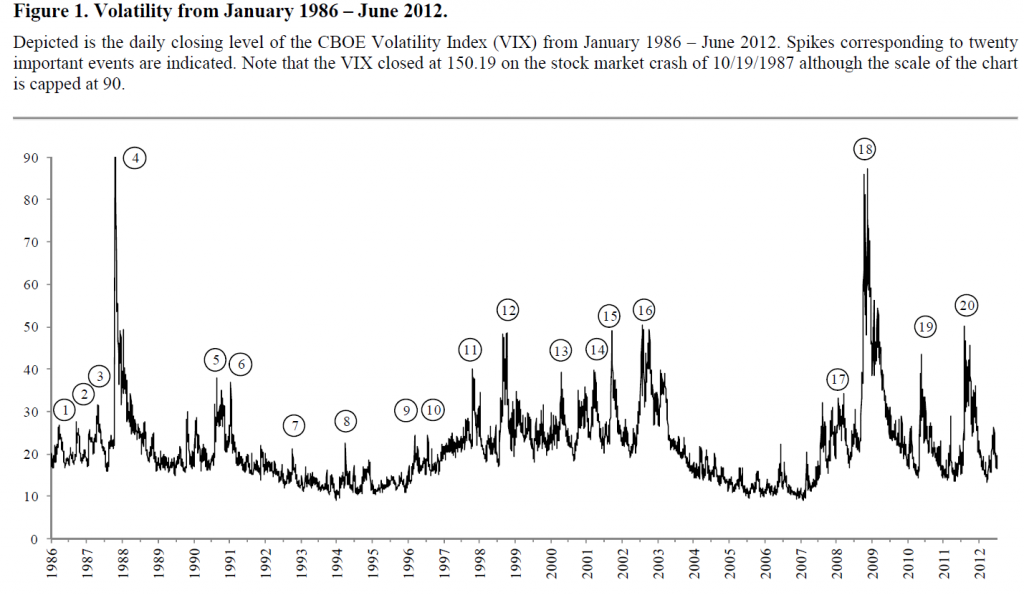 The 20-point table below is linked, of course, with the circled numbers in the chart.
Bottom Line
Obviously, if you could forcast volatility, that would probably provide useful information about the specific prediction of stock prices. Thus, I have developed models which indicate the direction of change on a one-day-ahead basis somewhat better than chance. If you could add a volatility forecast to this, you would have some idea of when a big change up or down might occur.
Similarly, forecasting the VIX might be helpful in forecasting stock market volatility generally.
At the present time, I might add, the VIX seems to have aroused itself from a slumber at low levels.
Stay tuned, and please, if you know something you would like to share, use the comments section, after you click on this particular post.
Lead graphic from Oyster Consulting
