Let’s ask what might seem to be a silly question, but which turns out to be challenging. What is an asset bubble? How can asset bubbles be identified quantitatively?
Let me highlight two definitions – major in terms of the economics and analytical literature. And remember when working through “definitions” that the last major asset bubbles that burst triggered the recessions of 2008-2009 globally, resulting in the loss of tens of trillions of dollars.
You know, a trillion here and a trillion there, and pretty soon you are talking about real money.
Bubbles as Deviations from Values Linked to Economic Fundamentals
The first is simply that –
This comes from Dreger and Zhang, who cite earlier work by Case and Shiller, including their historic paper – Is There A Bubble in the Housing Market (2003)
Basically, you need a statistical or an econometric model which “explains” price movements in an asset market. While prices can deviate from forecasts produced by this model on a temporary basis, they will return to the predicted relationship to the set of fundamental variables at some time in the future, or eventually, or in the long run.
The sustained speculative distortions of the asset market then can be measured with reference to benchmark projections with this type of relationship and current values of the “fundamentals.”
This is the language of co-integrating relationships. The trick, then, is to identify a relationship between the asset price and its fundamental drivers which net out residuals that are white noise, or at least, ARMA – autoregressive moving average – residuals. Good luck with that!
Bubbles as Faster-Than-Exponential Growth
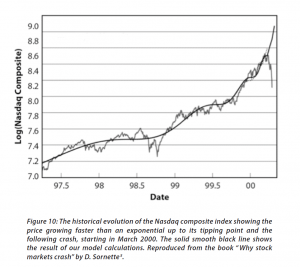
The second definition comes from Didier Sornette and basically is that an asset bubble exists when prices or values are accelerating at a faster-than-exponential rate.
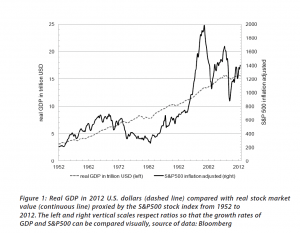
Fundamentals still benchmark asset prices in this approach, as illustrated by this chart.
Here GDP and U.S. stock market valuation grow at approximately the same rate, suggesting a “cointegrated relationship,” such as suggested with the first definition of a bubble introduced above.
However, the market has shown three multiple-year periods of excessive valuation, followed by periods of consolidation.
These periods of bubbly growth in prices are triggered by expectations of higher prices and the ability to speculate, and are given precise mathematical expression in the JLS (Johansen-Ledoit-Sornette) model.
The behavioral underpinnings are familiar and can explained with reference to housing, as follows.
The concept of “faster-than-exponential” growth also is explicated in this chart from a recent article (2011), and originally from Why Stock Markets Crash, published by Princeton.
In a recent methodological piece, Sornette and co-authors cite an extensive list of applications of their approach.
..the JLS model has been used widely to detect bubbles and crashes ex-ante (i.e., with advanced documented notice in real time) in various kinds of markets such as the 2006-2008 oil bubble [5], the Chinese index bubble in 2009 [6], the real estate market in Las Vegas [7], the U.K. and U.S. real estate bubbles [8, 9], the Nikkei index anti-bubble in 1990-1998 [10] and the S&P 500 index anti-bubble in 2000-2003 [11]. Other recent ex-post studies include the Dow Jones Industrial Average historical bubbles [12], the corporate bond spreads [13], the Polish stock market bubble [14], the western stock markets [15], the Brazilian real (R$) – US dollar (USD) exchange rate [16], the 2000-2010 world major stock indices [17], the South African stock market bubble [18] and the US repurchase agreements market [19].
I refer readers to the above link for the specifics of these references. Note, in general, most citations in this post are available as PDF files from a webpage maintained by the Swiss Federal Institute of Technology.
The Psychology of Asset Bubbles
After wrestling with this literature for several months, including some advanced math and econometrics, it seems to me that it all comes down, in the heat of the moment just before the bubble crashes, to psychology.
How does that go?
A recent paper coauthored by Sornette and Cauwels and others summarize the group psychology behind asset bubbles.
In its microeconomic formulation, the model assumes a hierarchical organization of the market, comprised of two groups of agents: a group with rational expectations (the value investors), and a group of “noise” agents, who are boundedly rational and exhibit herding behavior (the trend followers). Herding is assumed to be self-reinforcing, corresponding to a nonlinear trend following behavior, which creates price-to-price positive feedback loops that yield an accelerated growth process. The tension and competition between the rational agents and the noise traders produces deviations around the growing prices that take the form of low-frequency oscillations, which increase in frequency due to the acceleration of the price and the nonlinear feedback mechanisms, as the time of the crash approaches.
Examples of how “irrational” agents might proceed to fuel an asset bubble are given in a selective review of the asset bubble literature developed recently by Anna Scherbina from which I take several extracts below.
For example, there is “feedback trading” involving traders who react solely to past price movements (momentum traders?). Scherbina writes,
In response to positive news, an asset experiences a high initial return. This is noticed by a group of feedback traders who assume that the high return will continue and, therefore, buy the asset, pushing prices above fundamentals. The further price increase attracts additional feedback traders, who also buy the asset and push prices even higher, thereby attracting subsequent feedback traders, and so on. The price will keep rising as long as more capital is being invested. Once the rate of new capital inflow slows down, so does the rate of price growth; at this point, capital might start flowing out, causing the bubble to deflate.
Other mechanisms are biased self-attribution and the representativeness heuristic. In biased self-attribution,
..people to take into account signals that confirm their beliefs and dismiss as noise signals that contradict their beliefs…. Investors form their initial beliefs by receiving a noisy private signal about the value of a security.. for example, by researching the security. Subsequently, investors receive a noisy public signal…..[can be] assumed to be almost pure noise and therefore should be ignored. However, since investors suffer from biased self-attribution, they grow overconfident in their belief after the public signal confirms their private information and further revise their valuation in the direction of their private signal. When the public signal contradicts the investors’ private information, it is appropriately ignored and the price remains unchanged. Therefore, public signals, in expectation, lead to price movements in the same direction as the initial price response to the private signal. These subsequent price moves are not justified by fundamentals and represent a bubble. The bubble starts to deflate after the accumulated public signals force investors to eventually grow less confident in their private signal.
Scherbina describes the representativeness heuristic as follows.
The fourth model combines two behavioral phenomena, the representativeness heuristic and the conservatism bias. Both phenomena were previously documented in psychology and represent deviations from optimal Bayesian information processing. The representativeness heuristic leads investors to put too much weight on attention-grabbing (“strong”) news, which causes overreaction. In contrast, conservatism bias captures investors’ tendency to be too slow to revise their models, such that they underweight relevant but non-attention-grabbing (routine) evidence, which causes underreaction… In this setting, a positive bubble will arise purely by chance, for example, if a series of unexpected good outcomes have occurred, causing investors to over-extrapolate from the past trend. Investors make a mistake by ignoring the low unconditional probability that any company can grow or shrink for long periods of time. The mispricing will persist until an accumulation of signals forces investors to switch from the trending to the mean-reverting model of earnings.
Interesting, several of these “irrationalities” can generate negative, as well as positive bubbles.
Finally, Scherbina makes an important admission, namely that
The behavioral view of bubbles finds support in experimental studies. These studies set up artificial markets with finitely-lived assets and observe that price bubbles arise frequently. The presence of bubbles is often attributed to the lack of common knowledge of rationality among traders. Traders expect bubbles to arise because they believe that other traders may be irrational. Consequently, optimistic media stories and analyst reports may help create bubbles not because investors believe these views but because the optimistic stories may indicate the existence of other investors who do, destroying the common knowledge of rationality.
And let me pin that down further here.
Asset Bubbles – the Evidence From Experimental Economics
Vernon Smith is a pioneer in experimental economics. One of his most famous experiments concerns the genesis of asset bubbles.
Here is a short video about this widely replicated experiment.
Stefan Palan recently surveyed these experiments, and also has a downloadable working paper (2013) which collates data from them.
This article is based on the results of 33 published articles and 25 working papers using the experimental asset market design introduced by Smith, Suchanek and Williams (1988). It discusses the design of a baseline market and goes on to present a database of close to 1600 individual bubble measure observations from experiments in the literature, which may serve as a reference resource for the quantitative comparison of existing and future findings.
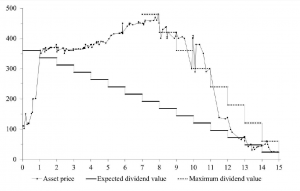
A typical pattern of asset bubble formation emerges in these experiments.
As Smith relates in the video, the experimental market is comprised of student subjects who can both buy and sell and asset which declines in value to zero over a fixed period. Students can earn real money at this, and cannot communicate with others in the experiment.
Noahpinion has further discussion of this type of bubble experiment, which, as Palan writes, is the best-documented experimental asset market design in existence and thus offers a superior base of comparison for new work.
There are convergent lines of evidence about the reality and dynamics of asset bubbles, and a growing appreciation that, empirically, asset bubbles share a number of characteristics.
That may not be enough to convince the mainstream economics profession, however, as a humorous piece by Hirshleifer (2001), quoted by a German researcher a few years back, suggests –
In the muddled days before the rise of modern finance, some otherwise-reputable economists, such as Adam Smith, Irving Fisher, John Maynard Keynes, and Harry Markowitz, thought that individual psychology affects prices. What if the creators of asset pricing theory had followed this thread? Picture a school of sociologists at the University of Chicago proposing the Deficient Markets Hypothesis: that prices inaccurately reflect all available information. A brilliant Stanford psychologist, call him Bill Blunte, invents the Deranged Anticipation and Perception Model (or DAPM), in which proxies for market misevaluation are used to predict security returns. Imagine the euphoria when researchers discovered that these mispricing proxies (such as book/market, earnings/price, and past returns) and mood indicators such as amount of sunlight, turned out to be strong predictors of future returns. At this point, it would seem that the deficient markets hypothesis was the best-confirmed theory in the social sciences.


