Data analysis and predictive analytics can support national and international responses to ebola.
One of the primary ways at present is by verifying and extrapolating the currently exponential growth of ebola in affected areas – especially in Monrovia, the capital of Liberia, as well as Sierra Leone, Guinea, Nigeria, and the Democratic Republic of the Congo.
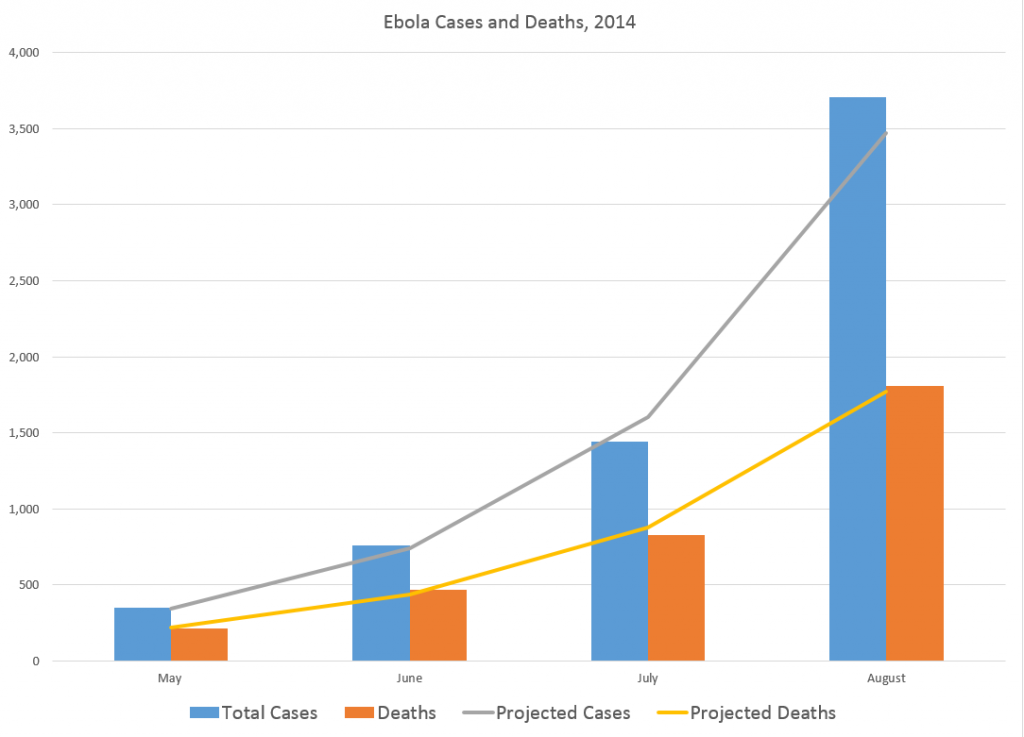
At this point, given data from the World Health Organization (WHO) and other agencies, predictive modeling can be as simple as in the following two charts, developed from the data compiled (and documented) in the Wikipedia site.
The first charts datapoints from the end of the months of May through August of this year.
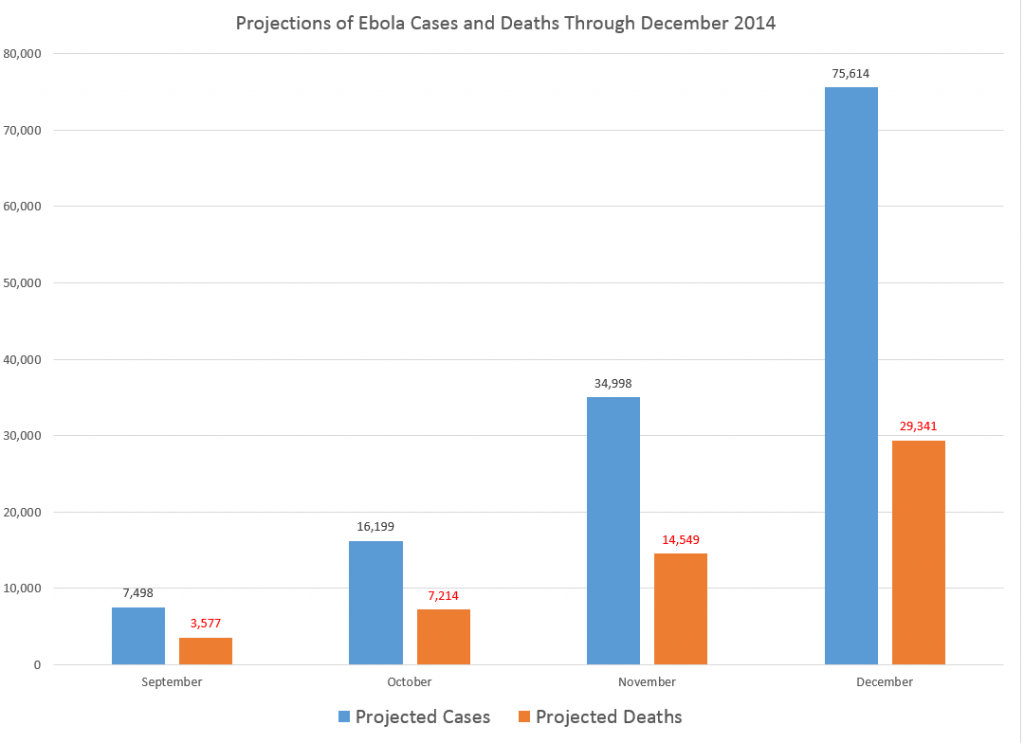
The second chart extrapolates an exponential fit to these cases, shown in the lines in the above figure, by month through December 2014.
So by the end of this year, if this epidemic courses unchecked, without the major public health investments necessary in terms of hospital beds, supplies, medical and supporting personnel, including military or police forces to maintain public order in some of the worst-hit areas – there will be nearly 80,000 cases and approximately 30,000 deaths, by this simple extrapolation.
A slightly more sophisticated analysis by Geert Barentsen, utilizing data within calendar months as well, concludes that currently Ebola cases have a doubling time of 29 days.
One possibly positive aspect of these projections is the death rate declines from around 60 to 40 percent, from May through December 2014.
However, if the epidemic continues through 2015 at this rate, the projections suggest there will be more than 300 million cases.
World Health Organization (WHO) estimates released the first week of September indicate nearly 2,400 deaths. Total numbers of cases from the same period in early September is 4,846. So the projections are on track so far.
And, if you wish, you can validate these crude data analytics with reference to modeling using the classic compartment approach and other more advanced setups. See, for example, Disease modelers project a rapidly rising toll from Ebola or the recent New York Times article.
Visual Analytics
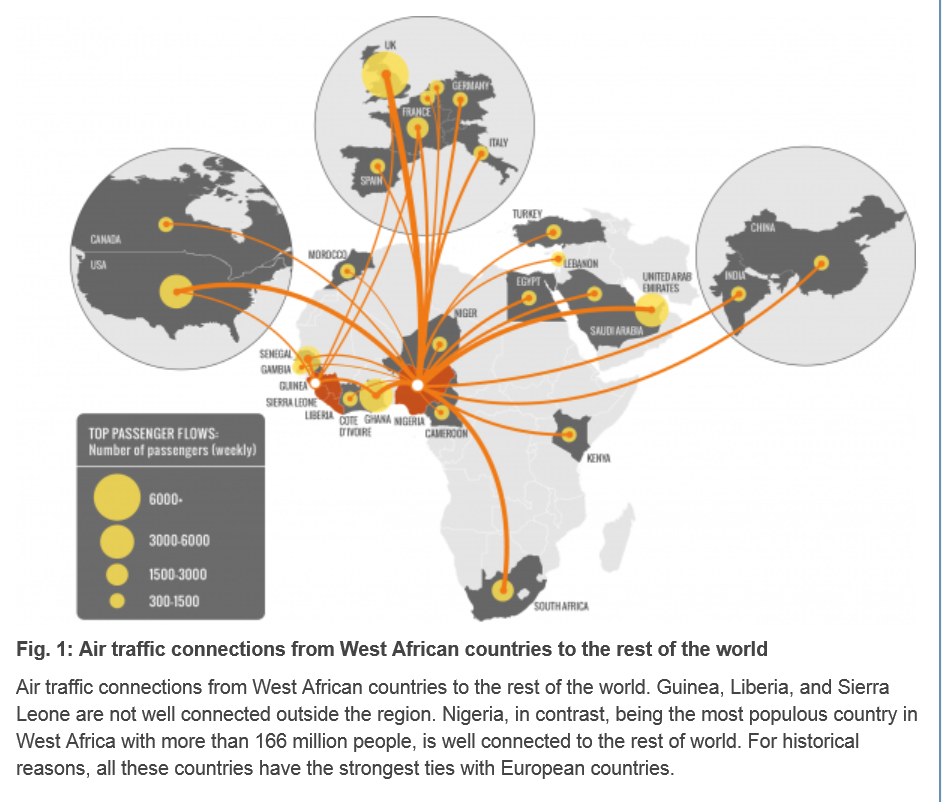
There have been advanced modeling efforts at discovering the possibilities of transmission of Ebola through persons traveling by air to other affected areas.
Here is a chart from Assessing the International Spreading Risk Associated with the 2014 West African Ebola Outbreak.
As a data and forecasting analyst, I am not specially equipped to comment on the conditions which make transmission of this disease particularly dangerous. But I think, to some extent, it’s not rocket science.
Crowded conditions in many African cities, low educational attainment, poverty, poor medical infrastructure, rapid population growth – all these factors contribute to the high basic reproductive number of the disease in this outbreak. And, if the numbers of cases increase toward 100,000, the probability that some of the affected individuals will travel elsewhere grows, particularly when efforts to quarantine areas seem heavy-handed and, given little understanding of modern disease models in the affected populations, possibly suspicious.
There is a growing response from agencies and places as widely ranging as the Gates Foundation and Cuba, but what I read is that a military-type operation will be necessary to bring the epidemic under control. I suppose this means command-and-control centers must be established, set procedures must be implemented when cases are identified, adequate field hospitals need to be established, enough medical personnel must be deployed, and so forth. And if there are potential vaccines, these probably will be expensive to administer in early stages.
These thoughts are suggested by the numbers. So far, the numbers speak for themselves.


