Well, here are some results on forecasting the daily low prices of the SPY exchange traded fund (ETF), complementing the previous post.
This line of inquiry has exploded into something much bigger, as I will relate shortly, but first ….
Predicting the Daily Low
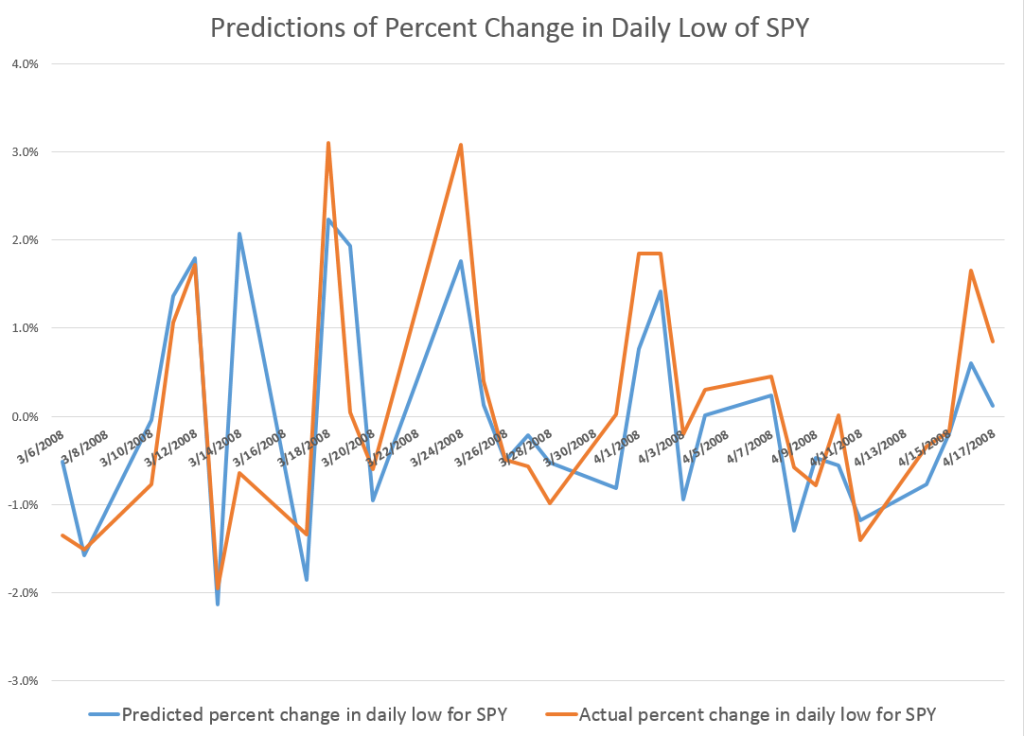
This graph gives a flavor of the accuracy of a very simple bivariate regression, estimated on the daily percent changes in the lows for SPY.
The blue line is the predicted percent change. And the orange line shows the actual percent changes of the daily lows for this period in early 2008.
These are out-of-sample results, in the sense the predicted percent changes in the lows are not included in the regression data used to develop the forecast model.
And considering we are predicting one component of volatility itself, the results are not bad.
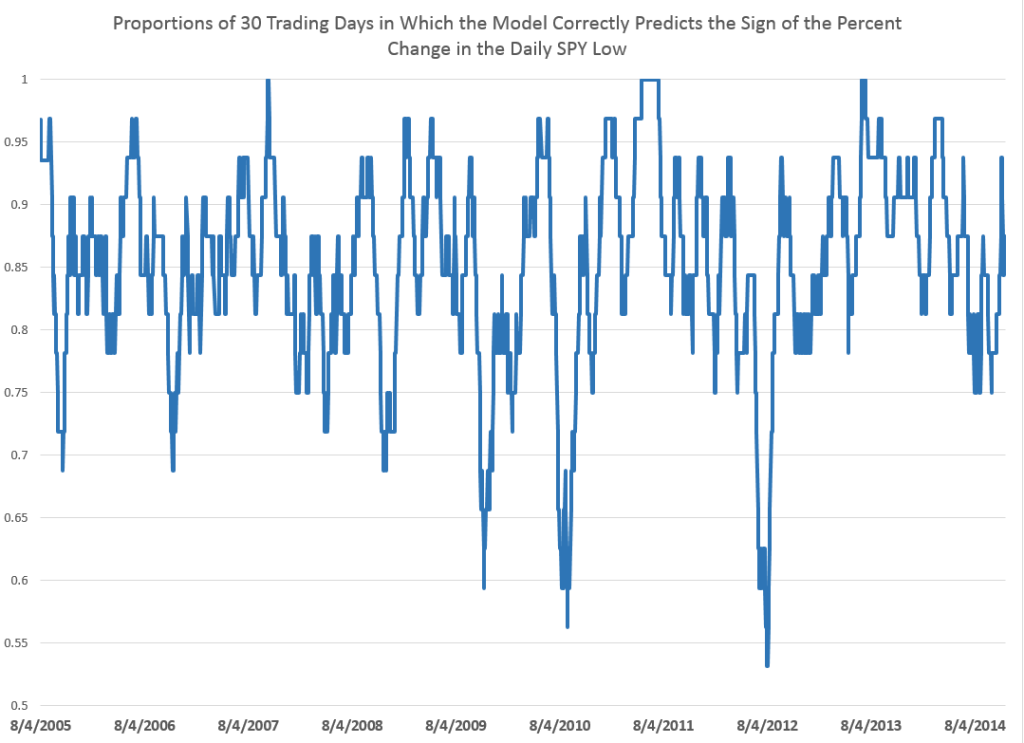
For this analysis, I develop dynamic or adaptive regressions that start in August 2005 and run up to the present. The models predict the direction of change in the daily lows, on average, about 85 percent of the time over nearly 15 years.
The following chart shows 30 day rolling averages of the proportion of time the models predict the correct sign of the percent change for this period.
This performance is produced by a simple bivariate regression of the daily percent change in the lows to the percent change in the previous low compared with the current daily opening price. So, of course, to get the explanatory variable you divide the previous trading day value for the low by the current day opening price and subtract 1 – and you can convert to percentages for purposes of display.
The equation is
PERCENT CHANGE IN CURRENT DAILY LOW = -0.00448 -0.951689(PERCENT CHANGE IN THE PREVIOUS DAILY LOW IN COMPARISON WITH THE CURRENT OPENING PRICE).
If the previous low is greater than the current opening price, the coefficient on this variable creates negative value which, added to the negative constant of the regression, would predict the daily low to drop.
If you have any role in instructing students, let me suggest this example. The data is readily accessible from Yahoo Finance (under SPY) and once you invert the calendar order of the data, the relevant percent changes are easy to compute, and then to plug into regressions with the Microsoft Excel Trend(.) function.
Now the amazing thing is that similar relationships operate over various time scales, both for predicting the low and the high in a group of trading days. I’m working up the post showing this right now.
There is, in other words, a remarkable thread running through daily, weekly, and monthly settings.
In closing here – a thought.
Often, when a predictive relationship relating to stock prices is put out there, you get the feeling the underlying regularities will evaporate, as traders jump on the opportunity.
But these predictive relationships for the high and low of the SPY may be examples of self-fulfiling prophesies.
In other words, if a trader learns that the daily, weekly, or monthly high or low is related to (a) the opening price, and (b) the high or low for the preceding period, whatever it may be, their actions could very well strengthen the relationship. So, predicting an increase in the daily high, a trader very well could go long, by buying the SPY at opening. The stock price should thereby go higher. Similarly, if a trader acts on information regarding predictions of a dropping low, they may short the SPY, which again could have the effect of causing the low to ratchet down further.
It would be fascinating if we could somehow establish that this is actually going on and sustaining this type of relationship.


If i wanted to predict this week’s market direction…. i would look at last friday’s low and if its higher then the opening on monday… its likely the market will go down?
Or do i check last week’s low and not just friday?
Something like that. The algorithm is evolving, but, basically, it’s important to understand that predicting the high and low prices in a period like a day or week is completely consistent with the random walk hypothesis.