Here are some remarkable findings relating to predicting the high and low prices of the SPDR S&P 500 ETF (SPY) in daily, weekly, and monthly periods.
Basically, the high and low prices for SPY can be forecast with some accuracy – especially with regards the sign of the percent change from the high or low of the previous period.
The simplicity of the predictive relationships are remarkable, and key off the ratio of the previous period high or low to the opening price for the new period under consideration. There is precedent in the work of George and Hwang, for example, who show picking portfolios of stocks whose price is near their 52-week high can generate superior returns (validated in 2010 for international portfolios). But my analysis concerns a specific exchange traded fund (ETF) which, of course, mirrors the S&P 500 Index.
Evidence
For data, I utilize daily, weekly, and monthly open, close, high, low, and volume data on the SPDR S&P 500 ETF SPY from Yahoo Finance from January 1993 to the present.
I estimate ordinary least squares (OLS) regression estimates on a rolling or adaptive basis.
So, for example, I begin weekly estimates to predict the high for a forecast horizon of one week on the period February 1, 1993 to December 12, 1994. The dependent variable is the growth in the highs from week to week – 97 observations on weekly data to begin with.
The initial regression has a coefficient of determination of 0.405 and indicates high statistical significance for the regression coefficients – although the underlying stochastic elements here are probably profoundly non-normal.
I use a similar setup to predict the weekly low of SPY, substituting the “growth” of the preceding low (in the previous week) to the current opening price in the set of explanatory variables. I continue using the lagged logarithm of the trading volume.
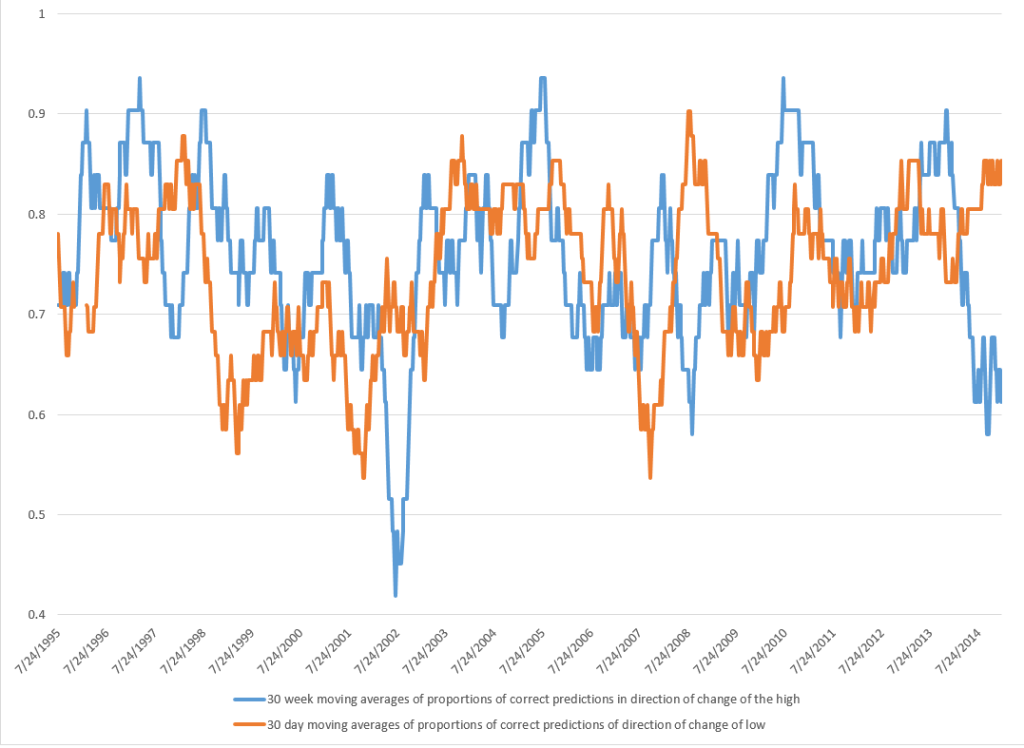
This chart shows the proportion of correct signs predicted by weekly models for the growth or percentage changes in the high and low prices in terms of 30 week moving averages (click to enlarge).
There is a lot to think about in this chart, clearly.
The basic truth, however, is that the predictive models, which are simple OLS regressions with two explanatory variables, predict the correct sign of the growth weekly percentage changes in the high and low SPY prices about 75 percent of the time.
Similar analysis of monthly data also leads to predictive models for the monthly high and lows. The predictive models for the high and low prices in monthly forecast horizons correctly predict more than 70 percent of the directions of change in these respective growth rates, with the model for the lows being more powerful statistically.
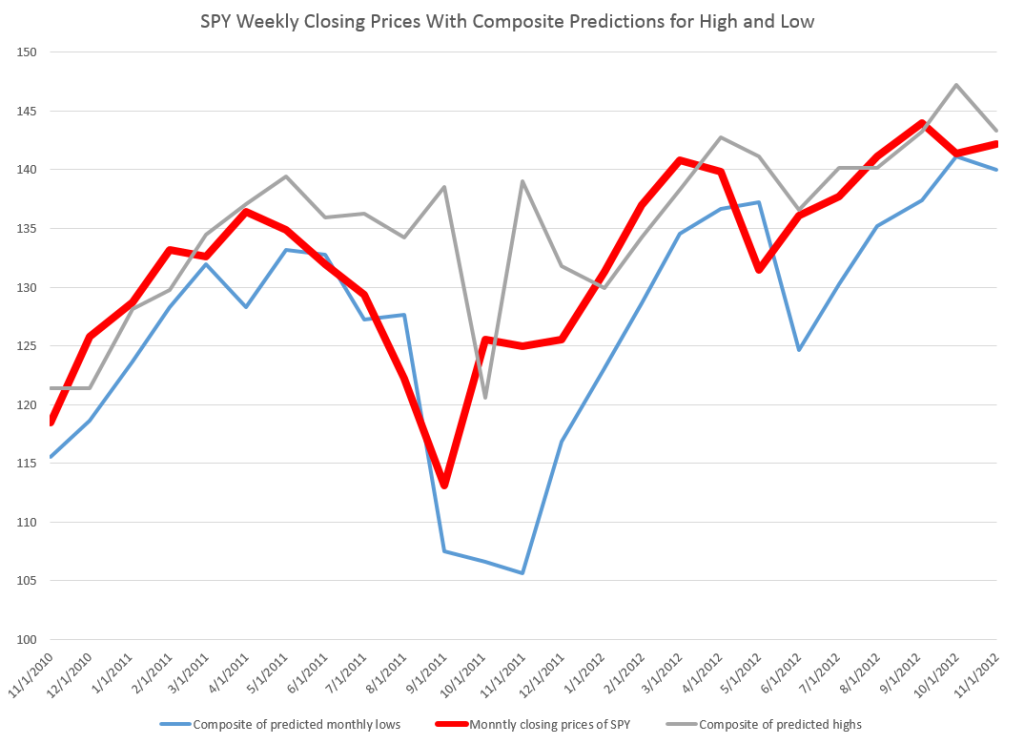
The actual forecasts of the growth in the monthly highs and lows may be helpful in discerning turning points in the SPY and, thus, the S&P 500, as the following chart suggests.
Here I apply the predicted high and low growth rates week-by-week to the previous week values for the high and low and also chart the SPY closing prices for the week (in bold red).
For discussion of the models for the daily highs and lows, see my previous blog posts here and here.
I might add that these findings relating to predicatability of the high and low of SPY on a daily, weekly, and monthly basis are among the strongest and simplest statistical relationships I have had the fortune to encounter.
Academic researchers are free to use and build on these results, but I would appreciate being credited with the underlying insight or as at least a source.
Discussion – Pathways of Predictability
Since this is not a refereed publication, I take the liberty of offering some conjectures on why this predictability exists.
My basic idea is that there are positive feedback loops for investing, based on fairly simple predictive models for the high of SPY that will be reached over a day, a week, or a month. So this would mean investors are aware of this relationship, and act upon it in real time. Their actions, furthermore, reinforce the strength of the relationship, creating pathways of predictability into the future in otherwise highly volatile, noisy data. Discovery of such pathways serves to reinforce their existence.
If this is true, it is real news and something relatively novel in economic forecasting.
And there is a second conjecture. I suspect that these “pathways of predictability” in the high and probably the low of SPY give us a window into turning points in the underlying stock index, the S&P 500. It should be possible to array daily, weekly, and monthly forecasts of the highs and lows for SPY and get some indication of a change in the direction of movement of the series.
These are a big claims, and eventually, may become shaded in colors of lighter and darker grey. However, I believe they work well as research hypotheses.


