
As a spinoff from blogging for the past several years, I’ve discovered a way to predict the high and low of stock prices over periods, like one or several days, a week, or other periods.
As a general rule, I can forecast the high and low of the SPY – the exchange traded fund (ETF) which tracks the S&P 500 – with average absolute errors around 1 percent.
Recently, friends asked me – “how did you do Monday?” – referring to June 29th when Greece closed its banks, punting on a scheduled loan payment to the International Monetary Fund (IMF) the following day.
SPY closing prices tumbled more than 2 percent June 30th, the largest daily drop since June 20, 2013.
Performance of the EVPA
I’m now calling my approach the EVPA or extreme value prediction algorithm. I’ve codified procedures and moved from spreadsheets to programming languages, like Matlab and R.
The performance of the EVPA June 29th depends on whether you allow the programs the Monday morning opening price – something I typically build in to the information set. That is, if I am forecasting a week ahead, I trigger the forecast after the opening of that week’s trading, obtaining the opening price for that week.
Given the June 29 opening price for the SPY ($208.05 a share), the EVPA predicts a Monday high and low of 209.25 and 207.11, for percent forecast errors of -0.6% and -1% respectively.
Of course, Monday’s opening price was significantly down from the previous Friday (by -1.1%).
Without Monday’s opening price, the performance of the EVPA degrades somewhat in the face of the surprising incompetence of Eurozone negotiators. The following chart shows forecast errors for predictions of the daily low price, using only the information available at the close of the trading day Friday June 26.
| Actual | Forecast | % Error | |
| 29-Jun | 205.33 | 208.71 | 1.6% |
| 30-Jun | 205.28 | 208.75 | 1.7% |
Forecasts of the high price for one and two-trading day periods average 1 percent errors (over actuals), when generated only with closing information from the previous week.
Where the Market Is Going
So where is the market going?
The following chart shows the high and low for Monday through Wednesday of the week of June 30 to July 3, and forecasts for the high and low which will be reached in a nested series of periods from one to ten trading days, starting Wednesday.
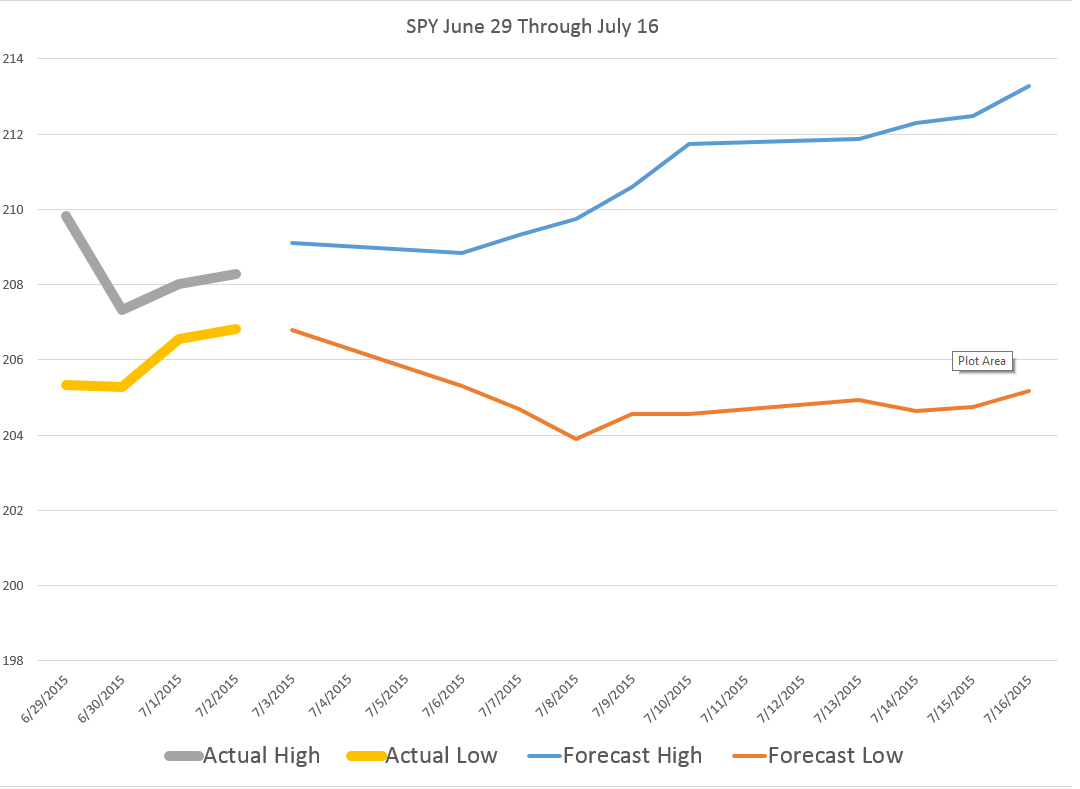
What makes interpretation of these predictions tricky is the fact that they do not pertain to 1, 2, and so forth trading days forward, per se. Rather, they are forecasts for 1 day periods, 2 day periods, 3 day periods, and so forth.
One classic pattern is the highs level, but predictions for the lows drop over increasing groups of trading days. That is a signal for a drop in the averages for the security in question, since highs can be reached initially and still stand for these periods of increasing trading days.
These forecasts offer some grounds for increases in the SPY averages going forward, after an initial decrease through the beginning of the coming week.
Of course the Greek tragedy is by no means over, and there can be more surprises.
Still, I’m frankly amazed at how well the EVPA does, in the humming, buzzing and chaotic confusion of global events.