Category Archives: accuracy of forecasts

Business Forecasting – Practical Problems and Solutions

Forecasts in business are unavoidable, since decisions must be made for annual budgets and shorter term operational plans, and investments must be made.

And regardless of approach, practical problems arise.

For example, should output from formal algorithms be massaged, so final numbers include judgmental revisions? What about error metrics? Is the mean absolute percent error (MAPE) best, because everybody is familiar with percents? What are plus’es and minus’es of various forecast error metrics? And, organizationally, where should forecasting teams sit – marketing, production, finance, or maybe in a free-standing unit?

The editors of Business Forecasting – Practical Problems and Solutions integrate dozens of selections to focus on these and other practical forecasting questions.

Here are some highlights.

In my experience, many corporate managers, even VP’s and executives, understand surprisingly little about fitting models to data.

So guidelines for reporting results are important.

In “Dos and Don’ts of Forecast Accuracy Measurement: A Tutorial,” Len Tashman advises “distinguish in-sample from out-of-sample accuracy,” calling it “the most basic issue.”

The acid test is how well the forecast model does “out-of-sample.” Holdout samples and cross-validation simulate how the forecast model will perform going forward. “If your average error in-sample is found to be 10%, it is very probable that forecast errors will average substantially more than 10%.” That’s because model parameters are calibrated to the sample over which they are estimated. There is a whole discussion of “over-fitting,” R2, and model complexity hinging on similar issues. Don’t fool yourself. Try to find ways to test your forecast model on out-of-sample data.

The discussion of fitting models when there is “extreme seasonality” broke new ground for me. In retail forecasting, there might be a toy or product that sells only at Christmastime. Demand is highly intermittent. As Udo Sglavo reveals, one solution is “time compression.” Collapse the time series data into two periods – the holiday season and the rest of the year. Then, the on-off characteristics of sales can be more adequately modeled. Clever.

John Mello’s “The Impact of Sales Forecast Game Playing on Supply Chains,” is probably destined to be a kind of classic, since it rolls up a lot of what we have all heard and observed about strategic behavior vis a vis forecasts.

Mello describes stratagems including

  • Enforcing – maintaining a higher forecast than actually anticipated, to keep forecasts in line with goals
  • Filtering – changing forecasts to reflect product on hand for sale
  • Hedging – overestimating sales to garner more product or production capability
  • Sandbagging – underestimating sales to set expectations lower than actually anticipated demand
  • Second-guessing – changing forecasts to reflect instinct or intuition
  • Spinning – manipulating forecasts to get favorable reactions from individuals or departments in the organization
  • Withholding – refusing to share current sales information

I’ve seen “sand-bagging” at work, when the salesforce is allowed to generate the forecasts, setting expectations for future sales lower than should, objectively, be the case. Purely by coincidence, of course, sales quotas are then easier to meet and bonuses easier to achieve.

I’ve always wondered why Gonik’s system, mentioned in an accompanying article by Michael Gilliland on the “Role of the Sales Force in Forecasting,” is not deployed more often. Gonik, in a classic article in the Harvard Business Review, ties sales bonuses jointly to the level of sales that are forecast by the field, and also to how well actual sales match the forecasts that were made. It literally provides incentives for field sales staff to come up with their best, objective estimate of sales in the coming period. (See Sales Forecasts and Incentives)

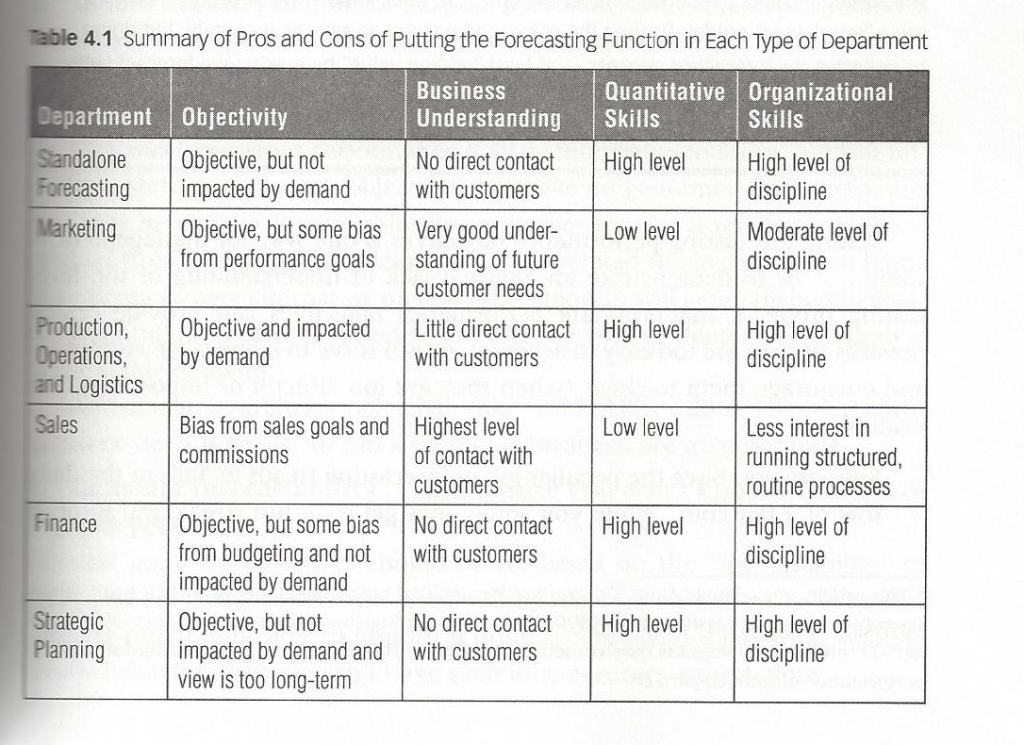
Finally, Larry Lapide’s “Where Should the Forecasting Function Reside?” asks a really good question.

The following graphic (apologies for the scan reproduction) summarizes some of his key points.

TTable

There is no fixed answer, Lapide provides a list of things to consider for each organization.

This book is a good accompaniment for Rob Hyndman and George Athanasopoulos’s online Forecasting: Principles and Practice.
Superforecasting – The Art and Science of Prediction

Philip Tetlock’s recent Superforecasting says, basically, some people do better at forecasting than others and, furthermore, networking higher performing forecasters, providing access to pooled data, can produce impressive results.

This is a change from Tetlock’s first study – Expert Political Judgment – which lasted about twenty years, concluding, famously, ‘the average expert was roughly as accurate as a dart-throwing chimpanzee.”

Tetlock’s recent research comes out of a tournament sponsored by the Intelligence Advanced Research Projects Activity (IARPA). This forecasting competition fits with the mission of IARPA, which is to improve assessments by the “intelligence community,” or IC. The IC is a generic label, according to Tetlock, for “the Central Intelligence Agency, the National Security Agency, the Defense Intelligence Agency, and thirteen other agencies.”

It is relevant that the IC is surmised (exact figures are classified) to have “a budget of more than $50 billion .. [and employ] one hundred thousand people.”

Thus, “Think how shocking it would be to the intelligence professionals who have spent their lives forecasting geopolical events – to be beaten by a few hundred ordinary people and some simple algorithms.”

Of course, Tetlock reports, this actually happened – “Thanks to IARPA, we now know a few hundred ordinary people and some simple math can not only compete with professionals supported by multibillion-dollar apparatus but also beat them.”

IARPA’s motivation, apparently, traces back to the “weapons of mass destruction (WMD)” uproar surrounding the Iraq war –

“After invading in 2003, the United States turned Iraq upside down looking for WMD’s but found nothing. It was one of the worst – arguable the worst – intelligence failure in modern history. The IC was humiliated. There were condemnations in the media, official investigations, and the familiar ritual of intelligence officials sitting in hearings ..”

So the IC needs improved methods, including utilizing “the wisdom of crowds” and practices of Tetlock’s “superforecaster” teams.

Unlike the famous M-competitions, the IARPA tournament collates subjective assessments of geopolitical risk, such as “will there be a fatal confrontation between vessels in the South China Sea” or “Will either the French or Swiss inquiries find elevated levels of polonium in the remains of Yasser Arafat’s body?”

Tetlock’s book is entertaining and thought-provoking, but many in business will page directly to the Appendix – Ten Commandments for Aspiring Superforecasters.

    1. Triage – focus on questions which are in the “Goldilocks” zone where effort pays off the most.
    2. Break seemingly intractable problems into tractable sub-problems. Tetlock really explicates this recommendation with his discussion of “Fermi-izing” questions such as “how many piano tuners there are in Chicago?.” The reference here, of course, is to Enrico Fermi, the nuclear physicist.
    3. Strike the right balance between inside and outside views. The outside view, as I understand it, is essentially “the big picture.” If you are trying to understand the likelihood of a terrorist attack, how many terrorist attacks have occurred in similar locations in the past ten years? Then, the inside view includes facts about this particular time and place that help adjust quantitative risk estimates.
    4. Strike the right balance between under- and overreacting to evidence. The problem with a precept like this is that turning it around makes it definitely false. Nobody would suggest “do not strike the right balance between under- and overreacting to evidence.” I guess keep the weight of evidence in mind.
    5. Look for clashing causal forces at work in each problem. This reminds me of one of my models of predicting real world developments – tracing out “threads” or causal pathways. When several “threads” or chains of events and developments converge, possibility can develop into likelihood. You have to be a “fox” (rather than a hedgehog) to do this effectively – being open to diverse perspectives on what drives people and how things happen.
    6. Strive to distinguish as many degrees of doubt as the problem permits but no more. Another precept that could be cast as a truism, but the reference is to an interesting discussion in the book about how the IC now brings quantitative probability estimates to the table, when developments – such as where Osama bin Laden lives – come under discussion.
    7. Strike the right balance between under- and overconfidence, between prudence and decisiveness. I really don’t see the particular value of this guideline, except to focus on whether you are being overconfident or indecisive. Give it some thought?
    8. Look for the errors behind your mistakes but beware of rearview-mirror hindsight biases. I had an intellectual mentor who served in the Marines and who was fond of saying, “we are always fighting the last war.” In this regard, I’m fond of the saying, “the only certain thing about the future is that there will be surprises.”
    9. Bring out the best in others and let others bring out the best in you. Tetlock’s following sentence is more to the point – “master the fine art of team management.”
  • Master the error-balancing cycle. Good to think about managing this, too.

Puckishly, Tetlocks adds an 11th Commandment – don’t treat commandments as commandments.

Great topic – forecasting subjective geopolitical developments in teams. Superforecasting touches on some fairly subtle points, illustrated with examples. I think it is well worth having on the bookshelf.

There are some corkers, too, like when Tetlock’s highlights the recommendations of 2nd Century physician to Roman emperors Galen, the medical authority for more than 1000 years.

Galen once wrote, apparently,

“All who drink of this treatment recover in a short time, except those whom it does not help, who all die…It is obvious, therefore, that it fails only in incurable cases.”

One Month Forecast of SPY ETF Price Level – Extreme Value Prediction Algorithm (EVPA)

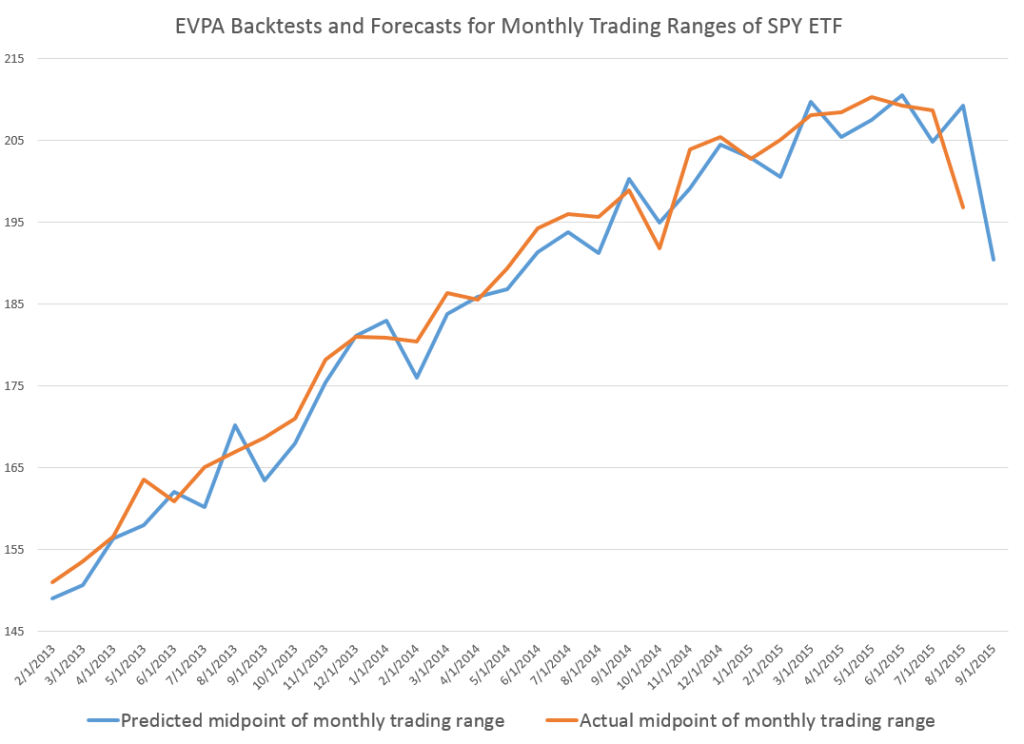
Here is a chart showing backtests and a prediction for the midpoints of the monthly trading ranges of the SPY exchange traded fund.

MonthSPY

The orange line traces out the sequence of actual monthly midpoints of the price range – the average of the high and low price for the month.

The blue line charts the backtests going back to 2013 and a forecast for September 2015 – which is the right-most endpoint of the blue line. The predicted September midpoint is $190.43.

The predictions come from the EVPA, an algorithm backtested to 1994 for the SPY. Since 1994, the forecast accuracy, measured by the MAPE or mean absolute percent error, is 2.4 percent. This significantly improves on a No Change model, one of the alternative forecast benchmarks for this series, and the OOS R2 of the forecast of the midpoint of the monthly trading range is a solid 0.33.

Just from eyeballing the graph above, it seems like there are systematic errors to the downside in the forecasts.

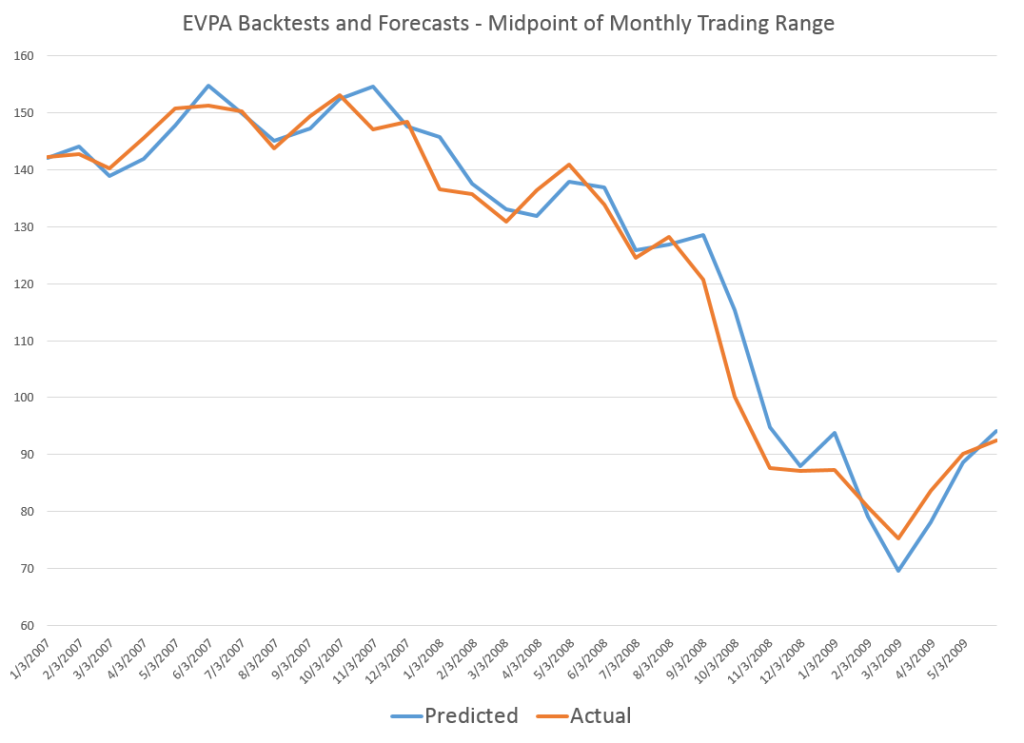
However, the reverse appears to happen, when the SPY prices are falling over a longer period of time.

2008SPYMonth

I would suggest, therefore, that the prediction of about $190 for September is probably going to be higher than the actual number.

Now – disclaimer. This discussion is provided for scientific and entertainment purposes only. We assume no responsibility for any trading actions taken, based on this information. The stock market, particularly now, is volatile. There are lots of balls in the air – China, potential Fed actions on interest rates, more companies missing profit expectations, and so forth – so literally anything may happen.

The EVPA is purely probabilistic. It is right more often than wrong. Its metrics are better than those of alternative forecast models in the cases I have studied. But, withal, it still is a gamble to act on its predictions.

But the performance of the EVPA is remarkable, and I believe further improvements are within reach.

Today’s Stock Market

Shakespeare’s Hamlet says at one point, “There are more things Horatio, than are dreamt of in your philosophy.” This is also a worthy thought when it comes to stock market forecasts.

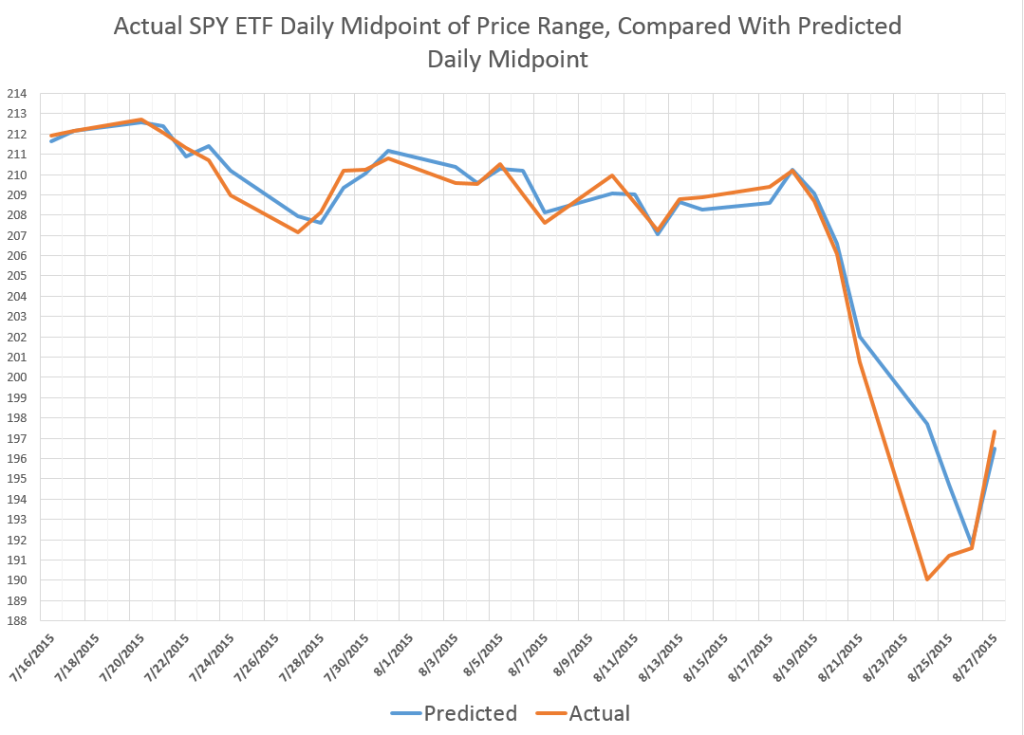
So here is a chart showing recent daily predictions of the midpoint (MP) of the daily price ranges for the SPY exchange traded fund (ETF), compared with the actual dollar value of the midpoint of the trading range for each day.

FlashCrash

The predictions are generated by the EVPA – extreme value prediction algorithm. This is a grown-up version of the idea that ratios, like the ratio between the opening price and the previous high or low, can give us a leg up in predicting the high or low prices (or midpoint) for a trading day.

Note the EVPA is quite accurate up to recent days, when forecast errors amplify at the end of the week of August 21. In fact, in backtests to 1994, EVPA forecasts the daily MP with a mean absolute percent error (MAPE) less that 0.4%.

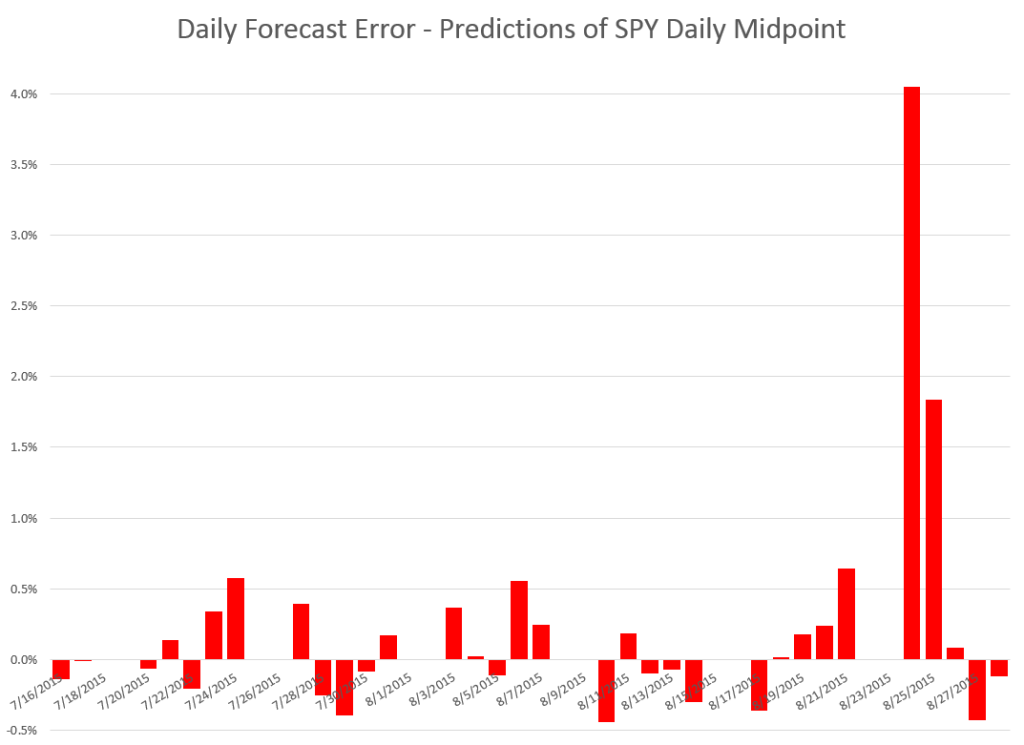
Here is a chart of the forecast errors corresponding to the predicted and actuals in the first chart above.

FCerror

Note the apparently missing bars for some dates are just those forecasts which show such tiny errors they don’t even make it to the display, which is dominated by the forecast error August 24 at about 4 percent.

Note also, the EVPA adjusts quickly, so that by Monday August 28th – when the most dramatic drop in the midpoint (closing price, etc.) occurs – the forecasts (or backcasts) show much lower forecast error (-0.1%).

Where This Is All Going

The EVPA keys off the opening price, which this morning is listed as 198.11 – lower than Friday’s closing price of 199.24.

This should tell you that the predictions for the day are not particularly rosy, and, indeed, the EVPA forecast for the week’s MP of the trading range is almost flat, compared to the midpoint of the trading range for last week. My forecast of the MP for this week is up 0.13%.

What that means, I am not quite sure.

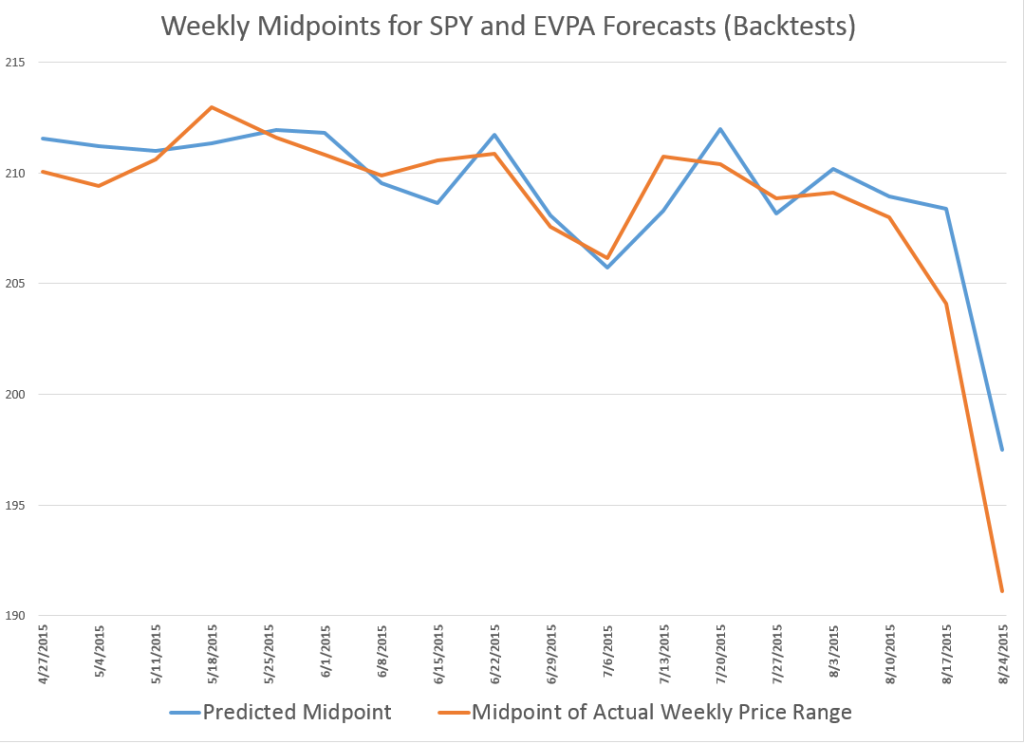
Here is a chart showing the performance of the weekly EVPA forecasts of the SPY MP for recent weeks.

WeeklySPYMP

This chart does not include the forecast for the current week.

What I find really interesting is that, according to this model, the slide in the SPY might have been spotted as early as the second week in August.

The EVPA is an amazing piece of data analytics, but it exists in an environment of enormous complexity. Studies showing that various international stock markets are cointegrated, and the sense of this clearly applies to Chinese and US stock markets. Also, there is talk of pulling the punchbowl of “free money” or zero interest rates, and that seems to have a dampening effect on the trading outlook.

Quite frankly, in recent weeks I have been so absorbed in R programming, testing various approaches, and, as noted in my previous post, weddings, that I have neglected these simple series. No longer. I plan to make these two prediction series automatic with my systems.

We will see.

Back to the Drawing Board

Well, not exactly, since I never left it.

But the US and other markets opened higher today, after round-the-clock negotiations on the Greek debt.

I notice that Jeff Miller of Dash of Insight frequently writes stuff like, We would all like to know the direction of the market in advance. Good luck with that! Second best is planning what to look for and how to react.

Running the EVPA with this morning’s pop up in the opening price of the SPY, I get a predicted high for the day of 210.17 and a predicted low of 207.5. The predicted low for the day will be spot-on, if the current actual low for the trading range holds.

I can think of any number of arguments to the point that the stock market is basically not predictable, because unanticipated events constantly make an impact on prices. I think it would even be possible to invoke Goedel’s Theorem – you know, the one that uses meta-mathematics to show that every axiomatic system of complexity greater than a group is essentially incomplete. There are always new truths.

On the other hand, backtesting the EVPA – extreme value prediction algorithm – is opening up new vistas. I’m appreciative of helpful comments of and discussions with professionals in the finance and stock market investing field.

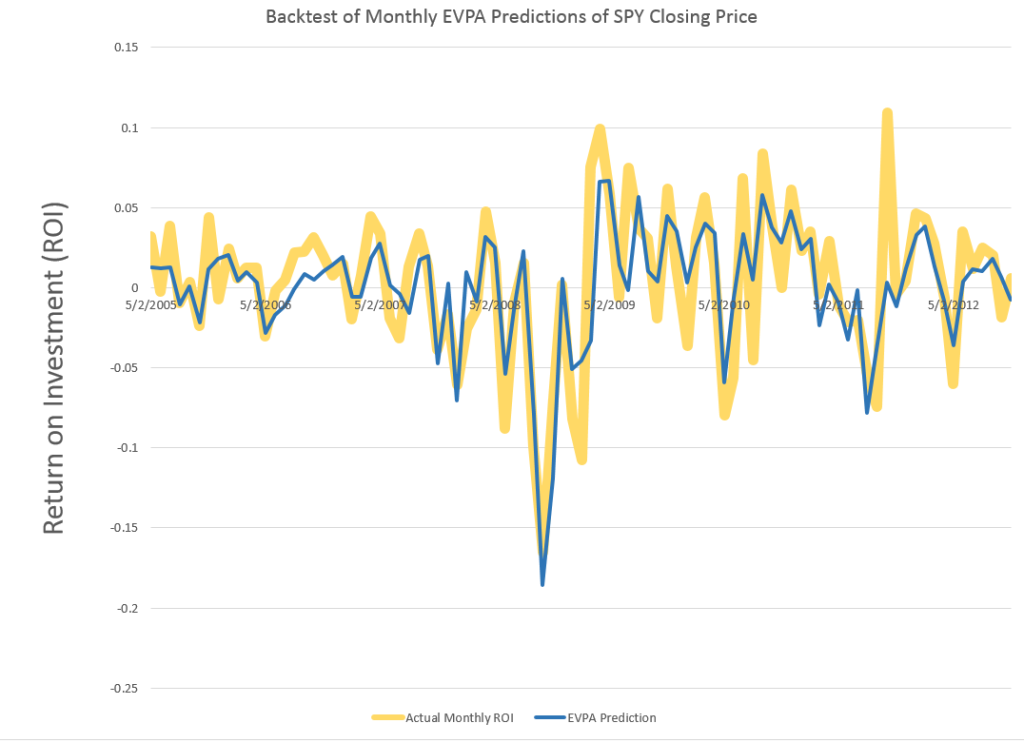
I strain every resource to develop backtests which are out-of-sample (OOS), and recently have found a way to predict closing prices with resources from the EVPA.

MOnthlyROISPYevpa

Great chart. The wider gold lines are the actual monthly ROI for the SPY, based on monthly closing prices. The blue line shows the OOS prediction of these closing prices, based on EVPA metrics. As you can see, the blue line predictions flat out miss or under-predict some developments in the closing prices. At the same time, in other cases, the EVPA predictions show uncanny accuracy, particularly in some of the big dips down.

Recognize this is something new. Rather than, say, predicting developments likely over a range of trading days – the high and low of a month, the  chart above shows predictions for stock prices at specific times, at the closing bell of the market the last trading day of each month.

I calculate the OOS R2 at 0.63 for the above series, which I understand is better than can be achieved with an autoregressive model for the closing prices and associated ROI’s.

I’ve also developed spreadsheets showing profits, after broker fees and short term capital gains taxes, from trading based on forecasts of the EVPA.

But, in addition to guidance for my personal trading, I’m interested in following out the implications of how much the historic prices predict about the prices to come.

Direction of the Market Next Week – July 13

Last Friday, before July 4th, I ran some numbers on the SPY exchange traded fund, looking at backcasts from the EVPA (extreme value prediction algorithm) for the Monday and Tuesday before, when Greece kept the banks closed and defaulted on its IMF payment. I also put up a ten day look forward on the EVPA predictions.

Of course, the SPY is an ETF which tracks the S&P 500.

The EVPA predicted the SPY high and low would drop at the beginning of the following week, beginning July 6, but seemed to suggest some rebound by the end of this week – that is today, July 10.

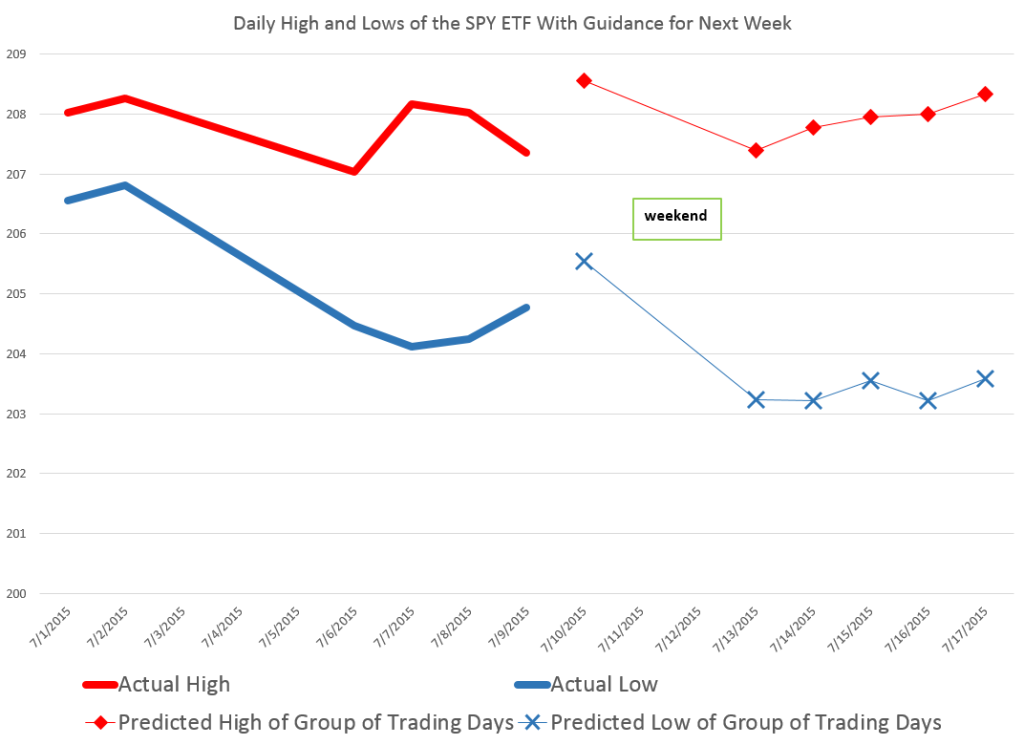
Here is a chart for today and next week with comments on interpreting the forecasts.

NextWeek

So the EVPA predicts the high and low over the current trading day, and aggregations of 2,3,4,.. trading days going forward.

The red diamonds in the chart map out forecasts for the high price of the SPY today, July 10, and for groups of trading days beginning today and ending Monday, July 13, and the rest of the days of next week.

Similarly, the blue crosses map out forecasts for the SPY low prices which are predicted to be reached over 1 day, the next two trading days, the next three trading days, and so forth.

Attentive readers will notice an apparent glitch in the forecasts for the high prices to come – namely that the predicted high of the next two trading days is lower than the predicted high for today – which is, of course, logically impossible.

But, hey, this is econometrics, not logic, and what we need to do is interpret the output of the models against what it is we are looking for.

In this case, a solid reduction in the predicted high of the coming two day period, compared with the prediction of today’s high signals that the high of the SPY is likely to be lower Monday than today.

This is consistent with predictions for the low today and for the next two trading days shown in blue – which indicates lower lows will be reached the second day.

Following that, the EVPA predictions for higher groupings of trading days are inconclusive, given statistical tolerances of the approach.

Note that the predictions of the high and low for today, Friday, July 10, are quite accurate, assuming these bounds have been reached by this point – two o’clock on Wall Street. In percentage error terms, the EVAP forecasts are over-forecasting 0.3% for the high and 0.2% for the low.

Again, the EVPA always keys off the opening price of the period being forecast.

I also have a version of the EVPA which forecasts ahead for the coming week, for two week periods, and so forth.

Leading up to the financial crisis of 2008 and then after the worst in October of that year, the EVPA weekly forecasts clearly highlight turning points.

Currently, weekly forecasts going up to monthly durations do not signal any clear trend in the market, but rather signal increasing volatility.

How Did BusinessForecastBlog’s Stock Market Forecast Algorithm Perform June 20 and July 1?

As a spinoff from blogging for the past several years, I’ve discovered a way to predict the high and low of stock prices over periods, like one or several days, a week, or other periods.

As a general rule, I can forecast the high and low of the SPY – the exchange traded fund (ETF) which tracks the S&P 500 – with average absolute errors around 1 percent.

Recently, friends asked me – “how did you do Monday?” – referring to June 29th when Greece closed its banks, punting on a scheduled loan payment to the International Monetary Fund (IMF) the following day.

SPY closing prices tumbled more than 2 percent June 30th, the largest daily drop since June 20, 2013.

Performance of the EVPA

I’m now calling my approach the EVPA or extreme value prediction algorithm. I’ve codified procedures and moved from spreadsheets to programming languages, like Matlab and R.

The performance of the EVPA June 29th depends on whether you allow the programs the Monday morning opening price – something I typically build in to the information set. That is, if I am forecasting a week ahead, I trigger the forecast after the opening of that week’s trading, obtaining the opening price for that week.

Given the June 29 opening price for the SPY ($208.05 a share), the EVPA predicts a Monday high and low of 209.25 and 207.11, for percent forecast errors of -0.6% and -1% respectively.

Of course, Monday’s opening price was significantly down from the previous Friday (by -1.1%).

Without Monday’s opening price, the performance of the EVPA degrades somewhat in the face of the surprising incompetence of Eurozone negotiators. The following chart shows forecast errors for predictions of the daily low price, using only the information available at the close of the trading day Friday June 26.

Actual Forecast % Error
29-Jun 205.33 208.71 1.6%
30-Jun 205.28 208.75 1.7%

Forecasts of the high price for one and two-trading day periods average 1 percent errors (over actuals), when generated only with closing information from the previous week.

Where the Market Is Going

So where is the market going?

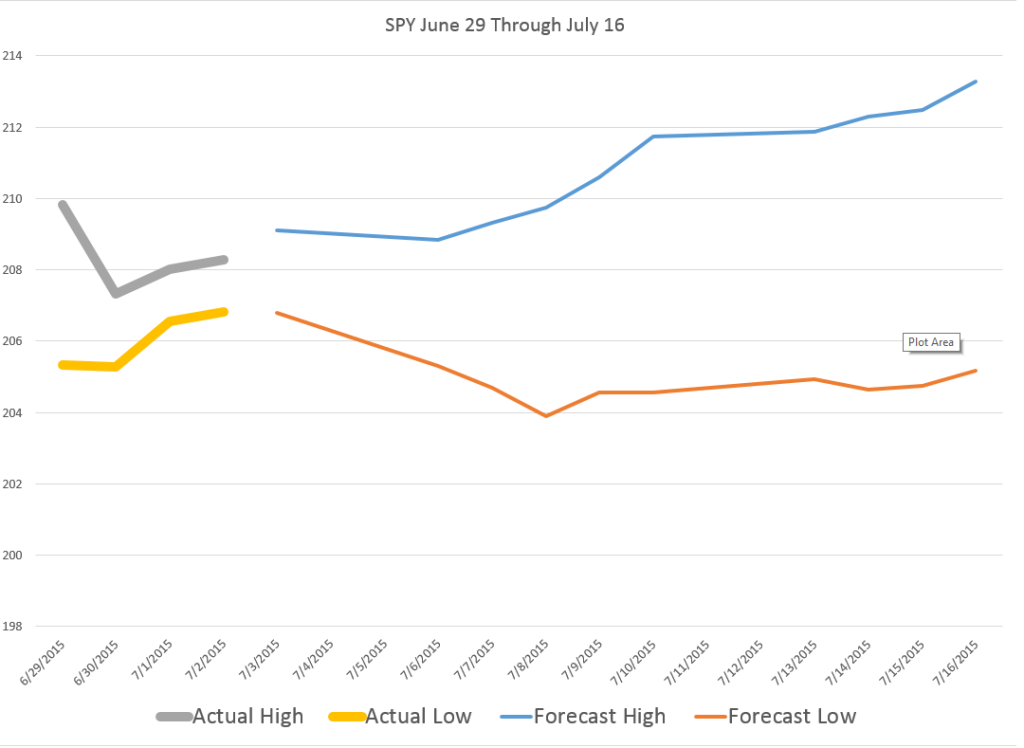
The following chart shows the high and low for Monday through Wednesday of the week of June 30 to July 3, and forecasts for the high and low which will be reached in a nested series of periods from one to ten trading days, starting Wednesday.

WhereGoing

What makes interpretation of these predictions tricky is the fact that they do not pertain to 1, 2, and so forth trading days forward, per se. Rather, they are forecasts for 1 day periods, 2 day periods, 3 day periods, and so forth.

One classic pattern is the highs level, but predictions for the lows drop over increasing groups of trading days. That is a signal for a drop in the averages for the security in question, since highs can be reached initially and still stand for these periods of increasing trading days.

These forecasts offer some grounds for increases in the SPY averages going forward, after an initial decrease through the beginning of the coming week.

Of course the Greek tragedy is by no means over, and there can be more surprises.

Still, I’m frankly amazed at how well the EVPA does, in the humming, buzzing and chaotic confusion of global events.

One-Month-Ahead Stock Market Forecasts

I have been spending a lot of time analyzing stock market forecast algorithms I stumbled on several months ago which I call the New Proximity Algorithms (NPA’s).

There is a white paper on the University of Munich archive called Predictability of the Daily High and Low of the S&P 500 Index. This provides a snapshot of the NPA at one stage of development, and is rock solid in terms of replicability. For example, an analyst replicated my results with Python, and I’ll probably will provide his code here at some point.

I now have moved on to longer forecast periods and more complex models, and today want to discuss month-ahead forecasts of high and low prices of the S&P 500 for this month – June.

Current Month Forecast for S&P 500

For the current month – June 2015 – things look steady with no topping out or crash in sight

With opening price data from June 1, the NPA month-ahead forecast indicates a high of 2144 and a low of 2030. These are slightly above the high and low for May 2015, 2,134.72 and 2,067.93, respectively.

But, of course, a week of data for June already is in, so, strictly speaking, we need a three week forecast, rather than a forecast for a full month ahead, to be sure of things. And, so far, during June, daily high and low prices have approached the predicted values, already.

In the interests of gaining better understanding of the model, however, I am going to “talk this out” without further computations at this moment.

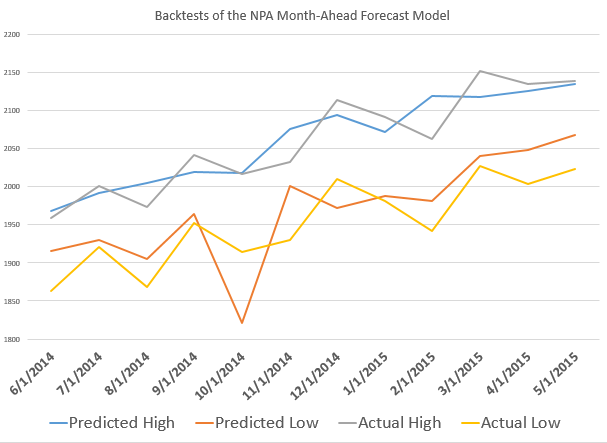
So, one point is that the model for the low is less reliable than the high price forecast on a month-ahead basis. Here, for example, is the track record of the NPA month-ahead forecasts for the past 12 months or so with S&P 500 data.

12MOSNPA

The forecast model for the high tracks along with the actuals within around 1 percent forecast error, plus or minus. The forecast model for the low, however, has a big miss with around 7 percent forecast error in late 2014.

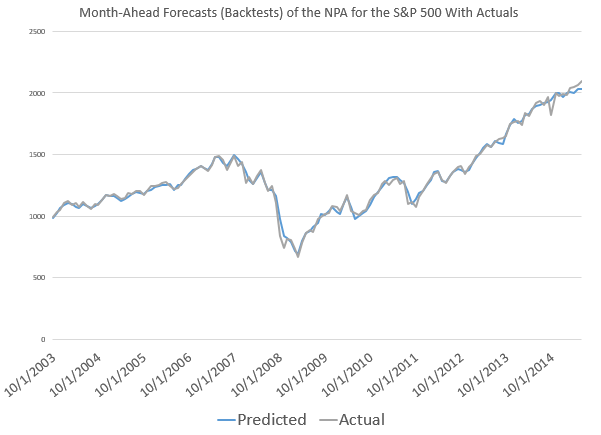
This sort of “wobble” for the NPA forecast of low prices is not unusual, as the following chart, showing backtests to 2003, shows.

LowMonthAheadBig

What’s encouraging is the NPA model for the low price adjusts quickly. If large errors signal a new direction in price movement, the model catches that quickly. More often, the wobble in the actual low prices seems to be transitory.

Predicting Turning Points

One reason why the NPA monthly forecast for June might be significant, is that the underlying method does a good job of predicting major turning points.

If a crash were coming in June, it seems likely, based on backtesting, that the model would signal something more than a slight upward trend in both the high and low prices.

Here are some examples.

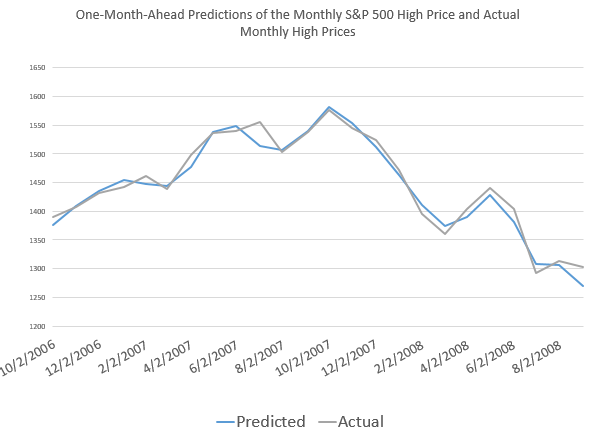
First, the NPA forecast model for the high price of the S&P 500 caught the turning point in 2007 when the market began to go into reverse.

S&P2008high

But that is not all.

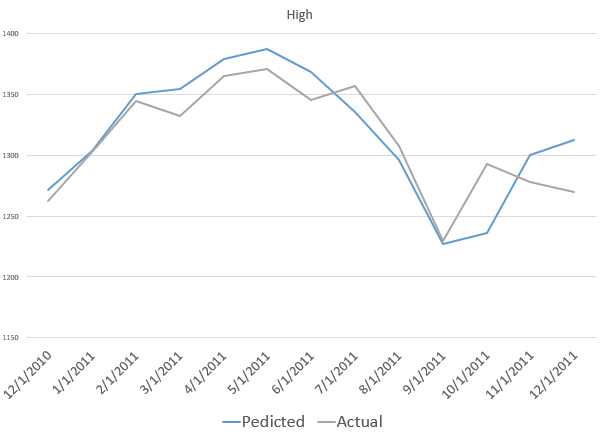
The NPA model for the month-ahead high price also captures a more recent reversal in the S&P 500.

laterHighS&P500


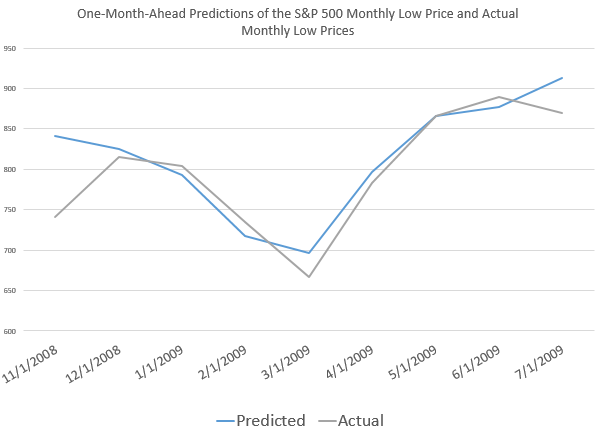
Also, the model for the low did capture the bottom in the S&P 500 in 2009, when the direction of the market changed from decline to increase.

2008High

This type of accuracy in timing in forecast modeling is quite remarkable.

It’s something I also saw earlier with the Hong Kong Hang Seng Index, but which seemed at that stage of model development to be confined to Chinese market data.

Now I am confident the NPA forecasts have some capability to predict turning points quite widely across many major indexes, ETF’s, and markets.

Note that all the charts shown above are based on out-of-sample extrapolations of the NPA model. In other words, one set of historical data are used to estimate the parameters of the NPA model, and other data, outside this sample, are then plugged in to get the month-ahead forecasts of the high and low prices.

Where This Is Going

I am compiling materials for presentations relating to the NPA, its capabilities, its forecast accuracy.

The NPA forecasts, as the above exhibits show, work well when markets are going down or turning directions, as when in a steady period of trending growth.

But don’t mistake my focus on these stock market forecasting algorithms for a last minute conversion to the view that nothing but the market is important. In fact, a lot of signals from business and global data suggest we could be in store for some big changes later in 2015 or in 2016.

What I want to do, I think, is understand how stock markets function as sort of prisms for these external developments – perhaps involving Greek withdrawal from the Eurozone, major geopolitical shifts affecting oil prices, and the onset of the crazy political season in the US.

Multivariate GARCH and Portfolio Risk Management

Why get involved with the complexity of multivariate GARCH models?

Well, because you may want to exploit systematic and persisting changes in the correlations of stocks and bonds, and other major classes of financial assets. If you know how these correlations change over, say, a forecast horizon of one month, you can do a better job of balancing risk in portfolios.

This a lively area of applied forecasting, as I discovered recently from Henry Bee of Cassia Research – based in Vancouver, British Columbia (and affiliated with CONCERT Capital Management of San Jose, California). Cassia Research provides Institutional Quant Technology for Investment Advisors.

HenryBee

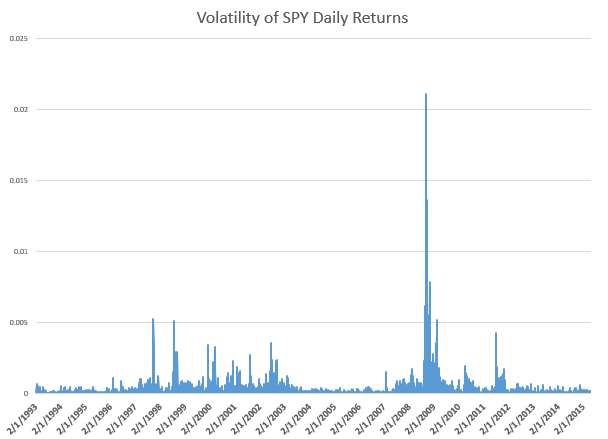
Basic Idea The key idea is that the volatility of stock prices cluster in time, and most definitely is not a random walk. Just to underline this – volatility is classically measured as the square of daily stock returns. It’s absolutely straight-forward to make a calculation and show that volatility clusters, as for example with this more than year series for the SPY exchange traded fund.

SPYVolatility

Then, if you consider a range of assets, calculating not only their daily volatilities, in terms of their own prices, but how these prices covary – you will find similar clustering of covariances.

Multivariate GARCH models provide an integrated solution for fitting and predicting these variances and covariances. For a key survey article, check out – Multivariate GARCH Models A Survey.

Some quotes from the company site provide details: We use a high-frequency multivariate GARCH model to control for volatility clustering and spillover effects, reducing drawdowns by 50% vs. historical variance. …We are able to tailor our systems to target client risk preferences and stay within their tolerance levels in any market condition…. [Dynamic Rebalancing can]..adapt quickly to market shifts and reduce drawdowns by dynamically changing rebalance frequency based on market behavior.

The COO of Cassia Research also is a younger guy – Jesse Chen. As I understand it, Jesse handles a lot of the hands-on programming for computations and is the COO.

JesseChen

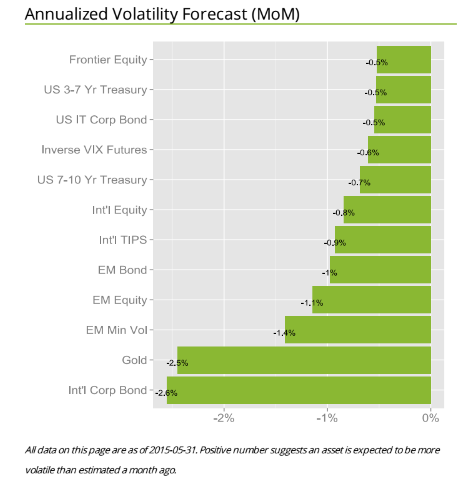
I asked Bee what he saw as the direction of stock market and investment volatility currently, and got a surprising answer. He pointed me to the following exhibit on the company site.

Bee1 The point is that for most assets considered in one of the main portfolios targeted by Cassia Research, volatilities have been dropping – as indicated by the negative signs in the chart. These are volatilities projected ahead by one month, developed by the proprietary multivariate GARCH modeling of this company – an approach which exploits intraday data for additional accuracy.

There is a wonderful 2013 article by Kirilenko and Lo called Moore’s Law versus Murphy’s Law: Algorithmic Trading and Its Discontents. Look on Google Scholar for this title and you will find a downloadable PDF file from MIT.

The Quant revolution in financial analysis is here to stay, and, if you pay attention, provides many examples of successful application of forecasting algorithms.

Thoughts on Stock Market Forecasting

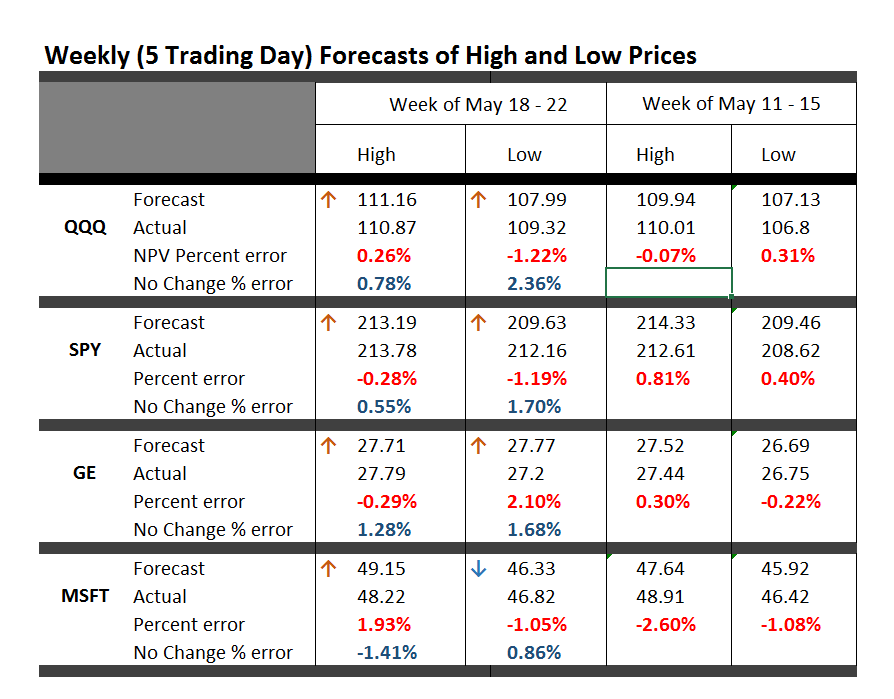
Here is an update on the forecasts from last Monday – forecasts of the high and low of SPY, QQQ, GE, and MSFT.

This table is easy to read, even though it is a little” busy”.

TableMay22

One key is to look at the numbers highlighted in red and blue (click to enlarge).

These are the errors from the week’s forecast based on the NPV algorithm (explained further below) and a No Change forecast.

So if you tried to forecast the high for the week to come, based on nothing more than the high achieved last week – you would be using a No Change model. This is a benchmark in many forecasting discussions, since it is optimal (subject to some qualifications) for a random walk. Of course, the idea stock prices are a random walk came into favor several decades ago, and now gradually is being rejected of modified, based on findings such as those above.

The NPV forecasts are more accurate for this last week than No Change projections 62.5 percent of the time, or in 5 out of the 8 forecasts in the table for the week of May 18-22. Furthermore, in all three cases in which the No Change forecasts were better, the NPV forecast error was roughly comparable in absolute size. On the other hand, there were big relative differences in the absolute size of errors in the situations in which the NPV forecasts proved more accurate, for what that is worth.

The NPV algorithm, by the way, deploys various price ratios (nearby prices) and their transformations as predictors. Originally, the approach focused on ratios of the opening price in a period and the high or low prices in the previous period. The word “new” indicates a generalization has been made from this original specification.

Ridge Regression

I have been struggling with Visual Basic and various matrix programming code for ridge regression with the NPV specifications.

Using cross validation of the λ parameter, ridge regression can improve forecast accuracy on the order of 5 to 10 percent. For forecasts of the low prices, this brings forecast errors closer to acceptable error ranges.

Having shown this, however, I am now obligated to deploy ridge regression in several of the forecasts I provide for a week or perhaps a month ahead.

This requires additional programming to be convenient and transparent to validation.

So, I plan to work on that this coming week, delaying other tables with weekly or maybe monthly forecasts for a week or so.

I will post further during the coming week, however, on the work of Andrew Lo (MIT Financial Engineering Center) and high frequency data sources in business forecasts.

Probable Basis of Success of NPV Forecasts

Suppose you are an observer of a market in which securities are traded. Initially, tests show strong evidence stock prices in this market follow random walk processes.

Then, someone comes along with a theory that certain price ratios provide a guide to when stock prices will move higher.

Furthermore, by accident, that configuration of price ratios occurs and is associated with higher prices at some date, or maybe a couple dates in succession.

Subsequently, whenever price ratios fall into this configuration, traders pile into a stock, anticipating its price will rise during the next trading day or trading period.

Question – isn’t this entirely plausible, and would it not be an example of a self-confirming prediction?

I have a draft paper pulling together evidence for this, and have shared some findings in previous posts. For example, take a look at the weird mirror symmetry of the forecast errors for the high and low.

And, I suspect, the absence or ambivalence of this underlying dynamic is why closing prices are harder to predict than period high or low prices of a stock. If I tell you the closing price will be higher, you do not necessarily buy the stock. Instead, you might sell it, since the next morning opening prices could jump down. Or there are other possibilities.

Of course, there are all kinds of systems traders employ to decide whether to buy or sell a stock, so you have to cast your net pretty widely to capture effects of the main methods.

Long Term Versus Short Term

I am getting mixed results about extending the NPV approach to longer forecast horizons – like a quarter or a year or more.

Essentially, it looks to me as if the No Change model becomes harder and harder to beat over longer forecast horizons – although there may be long run persistence in returns or other features that I see  other researchers (such as Andrew Lo) have noted.