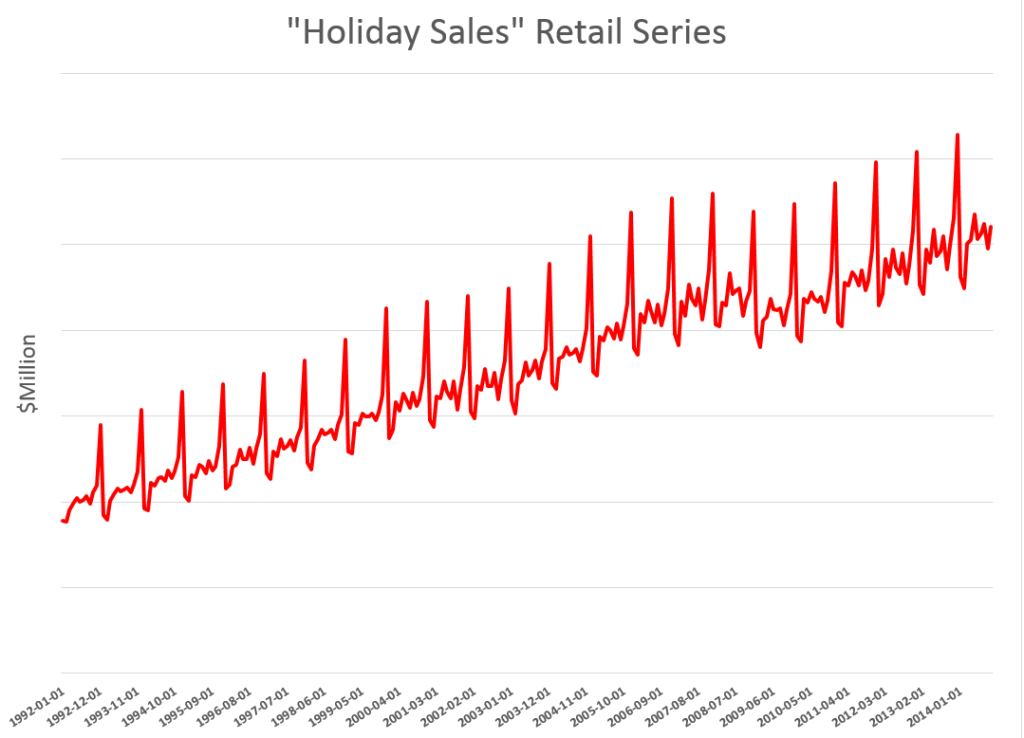
Holiday retail sales are a really “spikey” time series, illustrated by the following graph (click to enlarge).
These are monthly data from FRED and are not seasonally adjusted.
Following the National Retail Federation (NRF) convention, I define holiday retail sales to exclude retail sales by automobile dealers, gasoline stations and restaurants. The graph above includes all months of the year, but we can again follow the NRF convention and define “sales from the Holiday period” as being November and December sales.
Current Forecasts
The National Retail Federation (NRF) issues its forecast for the Holiday sales period in late October.
This year, it seems they were a tad optimistic, opting for
..sales in November and December (excluding autos, gas and restaurant sales) to increase a healthy 4.1 percent to $616.9 billion, higher than 2013’s actual 3.1 percent increase during that same time frame.
As the news release for this forecast observed, this would make the Holiday Season 2014 the first time in many years to see more than 4 percent growth – comparing to the year previous holiday periods.
The NRF is still holding to its bet (See https://nrf.com/news/retail-sales-increase-06-percent-november-line-nrf-holiday-forecast), noting that November 2014 sales come in around 3.2 percent over the total for November in 2013.
This means that December sales have to grow by about 4.8 percent on a month-over-year-previous-month basis to meet the overall, two month 4.1 percent growth.
You don’t get to this number by applying univariate automatic forecasting software. Forecast Pro, for example, suggests overall year-over-year growth this holiday season will be more like 3.3 percent, or a little lower than the 2013 growth of 3.7 percent.
Clearly, the argument for higher growth is the extra cash in consumer pockets from lower gas prices, as well as the strengthening employment outlook.
The 4.1 percent growth, incidentally, is within the 97.5 percent confidence interval for the Forecast Pro forecast, shown in the following chart.
This forecast follows from a Box-Jenkins model with the parameters –
ARIMA(1, 1, 3)*(0, 1, 2)
In other words, Forecast Pro differences the “Holiday Sales” Retail Series and finds moving average and autoregressive terms, as well as seasonality. For a crib on ARIMA modeling and the above notation, a Duke University site is good.
I guess we will see which is right – the NRF or Forecast Pro forecast.
Components of US Retail Sales
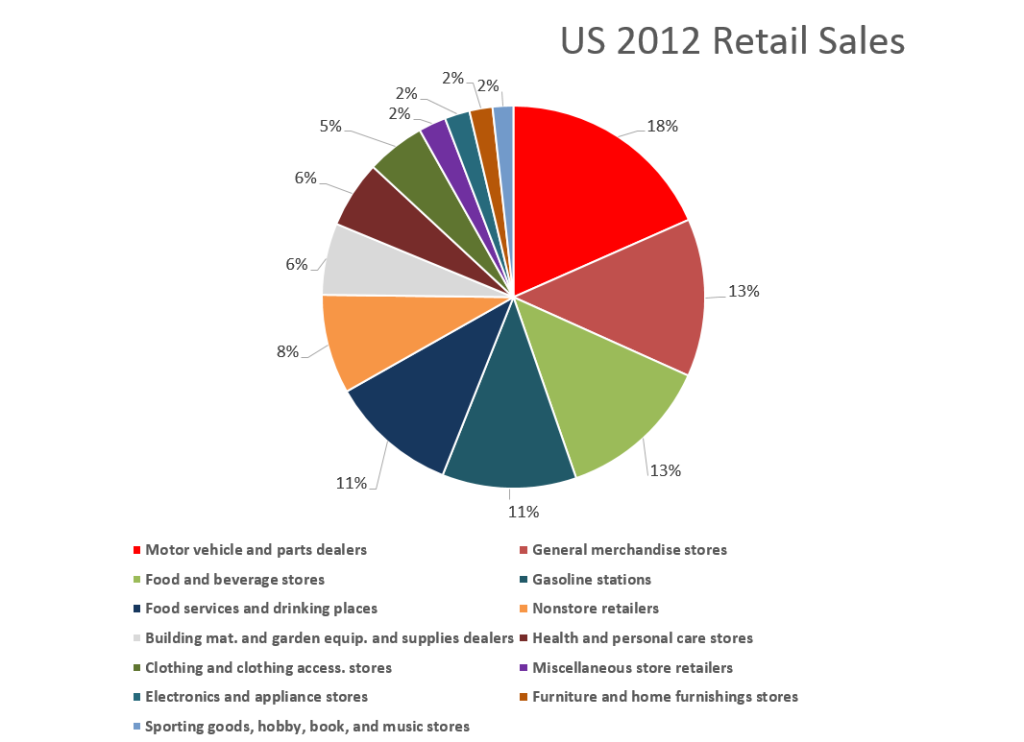
The following graphic shows the composition of total US retail sales, and the relative sizes of the main components.
Retail and food service sales totaled around $5 trillion in 2012. Taking out motor vehicle and parts dealers, gas stations, and food services and drinking places considerably reduces the size of the relevant Holiday retail time series.
Forecasting Issues and Opportunities
I have not yet done the exercise, but it would be interesting to forecast the individual series in the above pie chart, and compare the sum of those forecasts with a forecast of the total.
For example, if some of the component series are best forecast with exponential smoothing, while others are best forecast with Box-Jenkins time series models, aggregation could be interesting.
Of course, in 2007-09, application of univariate methods would have performed poorly. What we cry out for here is a multivariate model, perhaps based on the Kalman filter, which specifies leading indicators. That way, we could get one or two month ahead forecasts without having to forecast the drivers or explanatory variables.
In any case, barring unforeseen catastrophes, this Holiday Season should show comfortable growth for retailers, especially online retail (more on that in a subsequent post.)
Heading picture from New York Times


