Kernel ridge regression (KRR) is a promising technique in forecasting and other applications, when there are “fat” databases. It’s intrinsically “Big Data” and can accommodate nonlinearity, in addition to many predictors.
Kernel ridge regression, however, is shrouded in mathematical complexity. While this is certainly not window-dressing, it can obscure the fact that the method is no different from ordinary ridge regression on transformations of regressors, except for an algebraic trick to improve computational efficiency.
This post develops a spreadsheet example illustrating this key point – kernel ridge regression is no different from ordinary ridge regression…except for an algebraic trick.
Background
Most applications of KRR have been in the area of machine learning, especially optical character recognition.
To date, the primary forecasting application involves a well-known “fat” macroeconomic database. Using this data, researchers from the Tinbergen Institute and Erasmus University develop KRR models which outperform principal component regressions in out-of-sample forecasts of variables, such as real industrial production and employment.
You might want to tab and review several white papers on applying KRR to business/economic forecasting, including,
Nonlinear Forecasting with Many Predictors using Kernel Ridge Regression
Modelling Issues in Kernel Ridge Regression
Model Selection in Kernel Ridge Regression
This research holds out great promise for KRR, concluding, in one of these selections that,
The empirical application to forecasting four key U.S. macroeconomic variables — production, income, sales, and employment — shows that kernel-based methods are often preferable to, and always competitive with, well-established autoregressive and principal-components-based methods. Kernel techniques also outperform previously proposed extensions of the standard PC-based approach to accommodate nonlinearity.
Calculating a Ridge Regression (and Kernel Ridge Regression)
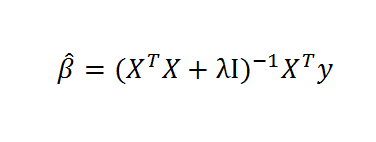
Recall the formula for ridge regression,
Here, X is the data matrix, XT is the transpose of X, λ is the conditioning factor, I is the identify matrix, and y is a vector of values of the dependent or target variable. The “beta-hats” are estimated β’s or coefficient values in the conventional linear regression equation,
y = β1x1+ β2x2+… βNxN
The conditioning factor λ is determined by cross-validation or holdout samples (see Hal Varian’s discussion of this in his recent paper).
Just for the record, ridge regression is a data regularization method which works wonders when there are glitches – such as multicollinearity – which explode the variance of estimated coefficients.
Ridge regression, and kernel ridge regression, also can handle the situation where there are more predictors or explanatory variables than cases or observations.
A Specialized Dataset
Now let us consider ridge regression with the following specialized dataset.
By construction, the equation,
y = 2x1 + 5x2+0.25x1x2+0.5x12+1.5x22+0.5x1x22+0.4x12x2+0.2x13+0.3x23
generates the six values of y from the sums of ten terms in x1 and x2, their powers, and cross-products.
Although we really only have two explanatory variables, x1 and x2, the equation, as a sum of 10 terms, can be considered to be constructed out of ten, rather than two, variables.
However, adopting this convenience, it means we have more explanatory variables (10) than observations on the dependent variable (6).
Thus, it will be impossible to estimate the beta’s by OLS.
Of course, we can develop estimates of the values of the coefficients of the true relationship between y and the data on the explanatory variables with ridge regression.
Then, we will find that we can map all ten of these apparent variables in the equation onto a kernel of two variables, simplifying the matrix computations in a fundamental way, using this so-called algebraic trick.
The ordinary ridge regression data matrix X is 6 rows by 10 columns, since there are six observations or cases and ten explanatory variables. Thus, the transpose XT is a 10 by 6 matrix. Accordingly, the product XTX is a 10 by 10 matrix, resulting in a 10 by 10 inverse matrix after the conditioning factor and identity matrix is added in to XTX.
In fact, the matrix equation for ridge regression can be calculated within a spreadsheet using the Excel functions mmult(.,) and minverse() and the transpose operation from Copy. The conditioning factor λ can be determined by trial and error, or by writing a Visual Basic algorithm to explore the mean square error of parameter values associated with different values λ.
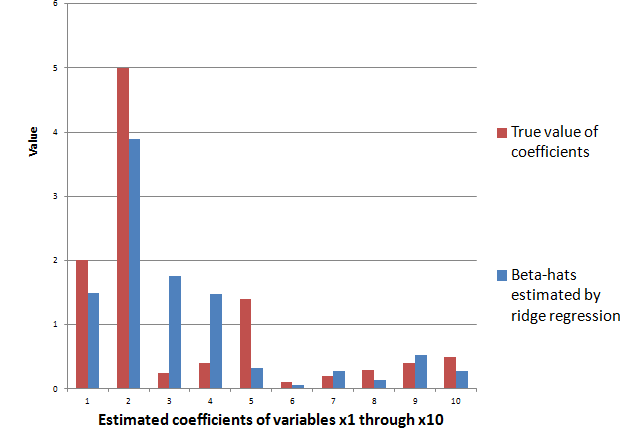
The ridge regression formula above, therefore, gives us estimates for ten beta-hats, as indicated in the following chart, using a λ or conditioning coefficient of .005.
The red bars indicate the true coefficient values, and the blue bars are the beta-hats estimated by the ridge regression formula.
As you can see, ridge regression “gets in the ballpark” in terms of the true values of the coefficients of this linear expression. However, with only 6 observations, the estimate is highly approximate.
The Kernel Trick
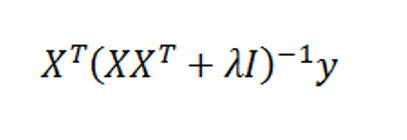
Now with suitable pre- and post-multiplications and resorting, it is possible to switch things around to another matrix formula,
Exterkate et al show the matrix algebra in a section of their “Nonlinear..” white paper using somewhat different symbolism.
Key point – the matrix formula listed just above involves inverting a smaller matrix, than the original formula – in our example, a 6 by 6, rather than a 10 by 10 matrix.
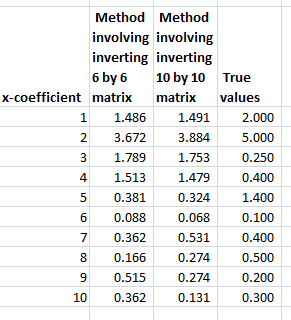
The following Table shows the beta-hats estimated by these two formulas are similar and compares them with the “true” values of the coefficients.
Differences in the estimates by these formally identical formulas relate strictly to issues at the level of numerical analysis and computation.
Kernels
Notice that the ten variables could correspond to a Taylor expansion which might be used to estimate the value of a nonlinear function. This is a key fact and illustrates the concept of a “kernel”.
Thus, designating K = XXT,we find that the elements of K can be obtained without going through the indicated multiplication of these two matrices. This is because K is a polynomial kernel.
There is a great deal more that can be said about this example and the technique in general. Two big areas are (a) arriving at the estimate of the conditioning factor λ and (b) discussing the range of possible kernels that can be used, what makes a kernel a kernel, how to generate kernels from existing kernels, where Hilbert spaces come into the picture, and so forth.
But hopefully this simple example can point the way.
For additional insight and the source for the headline Homer Simpson graphic, see The Kernel Trick.


