Category Archives: forecasting trade balances

What Mr. Trump May Be Thinking About US Trade

It’s often said a few pictures are worth thousands of words. But pictures can be a little misleading, when everything is globally interconnected.

First, look at the standard view of the ever-widening US trade deficit and negative US balance of payments. Then, focusing on Mexico – a Trump whipping boy – let’s pry open the box and look inside to see what is traded back and forth. What the numbers suggest is that the greatest part of the US trade deficit is involved with “trade by related parties”, i.e. multinational companies importing parts and other goods to the US, sometimes for assembly here and export. Many of these are US companies who have used international operations to cut production costs, but then gain access to US customers on favorable terms through their time-honored sales channels.

The Standard Picture

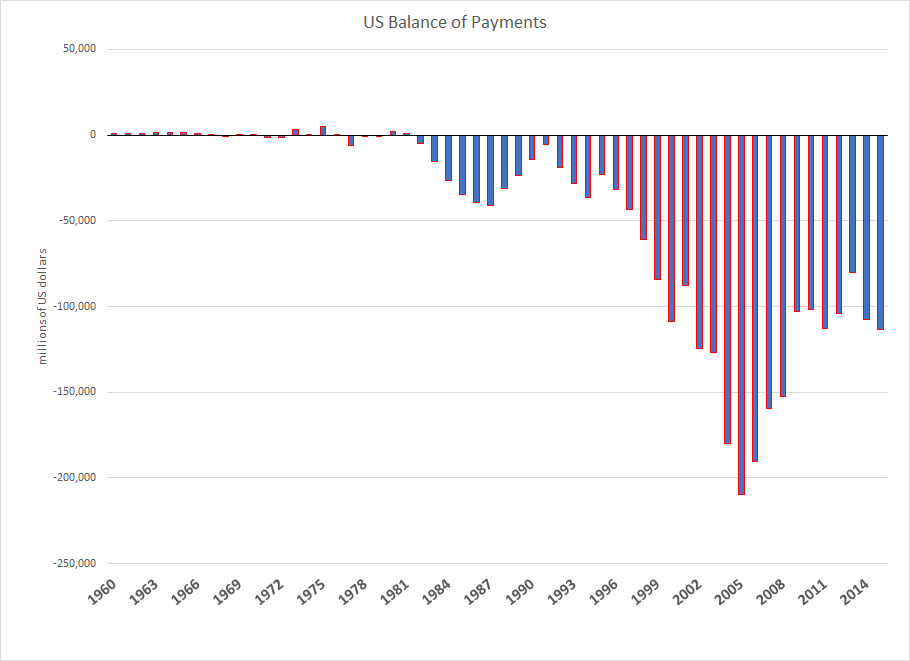
Just looking at the standard US trade statistics, the story is grim. Imports to the US have persistently exceeded US exports since the 1980’s, with the negative balance soaring just before the Great Recession of 2008-2009 to around $200 billion.

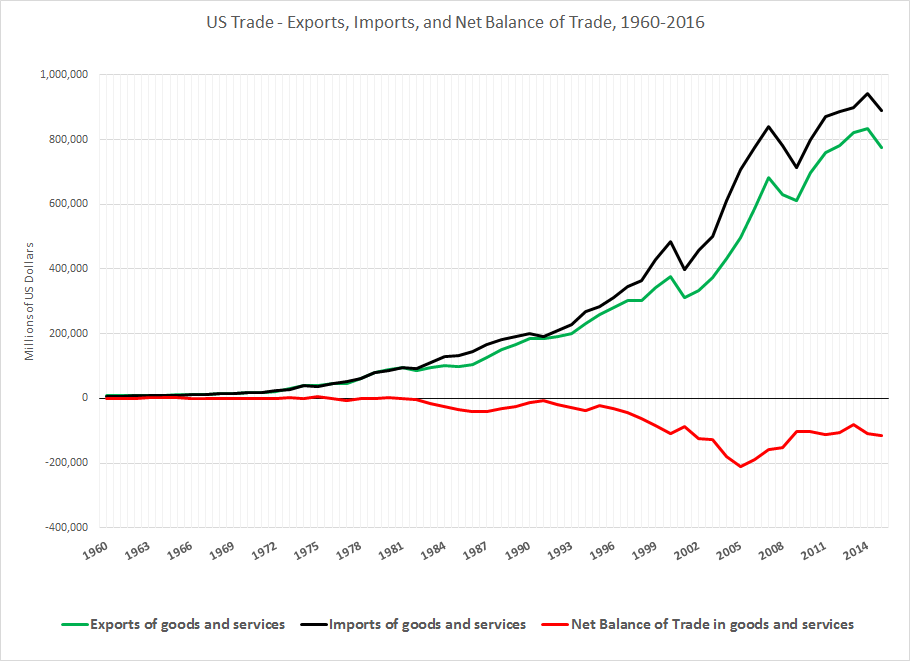
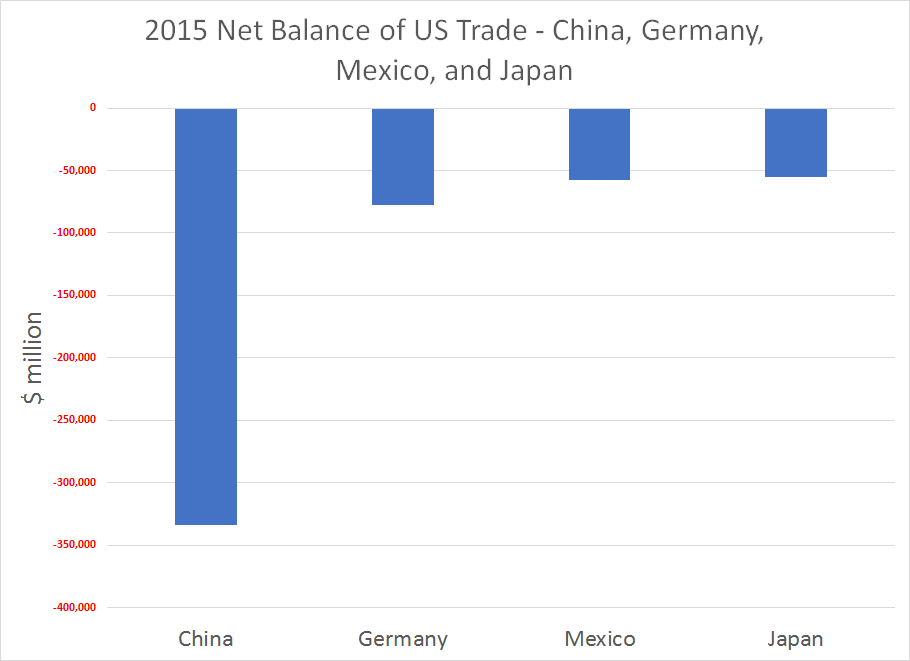
Four countries, China, Germany, Mexico, and Japan are the largest contributors to the US trade deficit, as the following chart shows.

Sharp erosion in the US balance of international payments accompanies these import and export curves.

But What Does Mexico Import Into the US?

This is where we have to adopt a new way of looking at these facts.

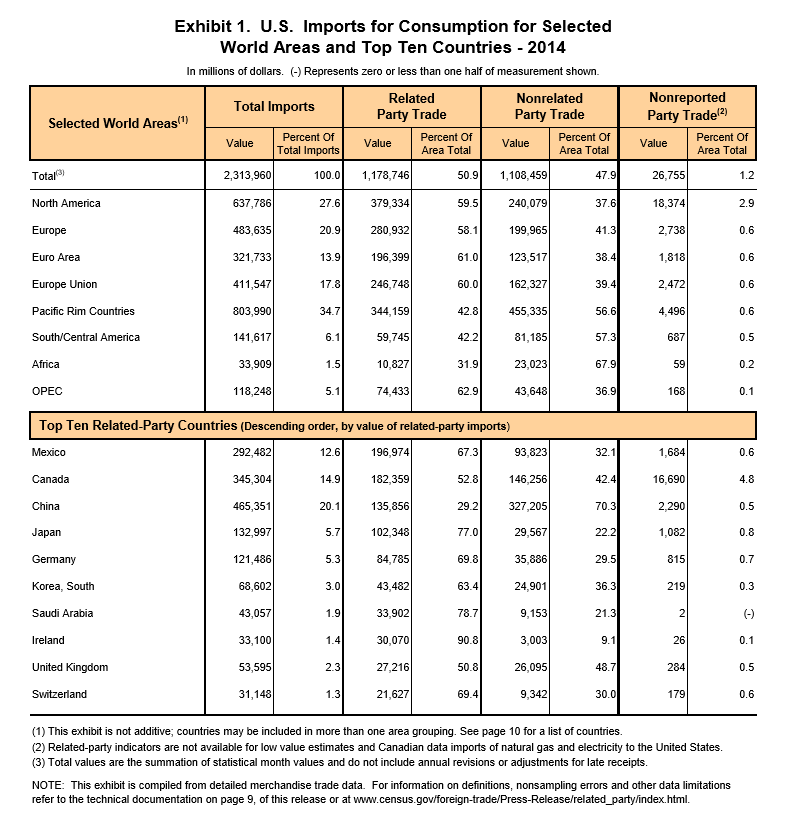
So, in recent years, US Trade authorities have begun to maintain a new kind of statistical data, relating to trade by related parties, a.k.a. trade between parts of the same (multinational) company.

Mexico, in fact, has a large portion of this trade by related parties, as the following Table indicates.

Readers may also want to consult J.W. Mason’s The Slack Wire What Exactly Does Mexico Export to the US? 

Now there are all sorts of measurement issues involved in measuring trade by related parties, and, of course, the import prices for within-company trade can be somewhat suspect.

But, its interesting some years ago, the Middle Class Political Economist calculated that –

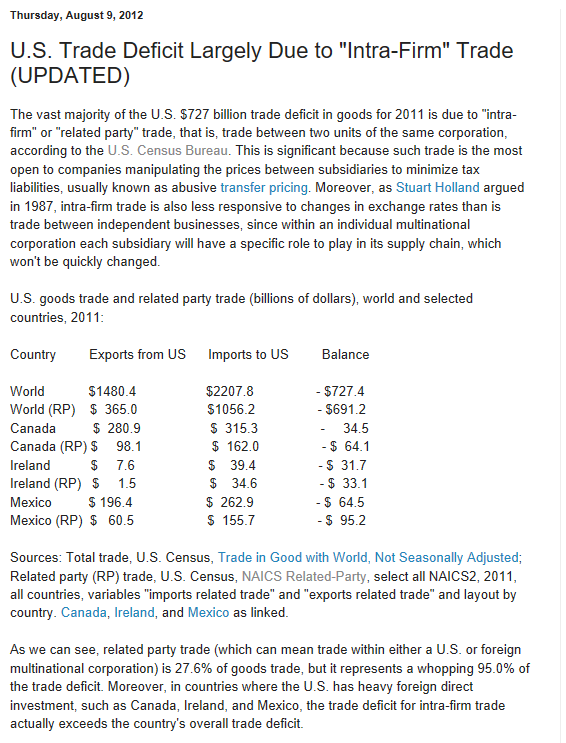
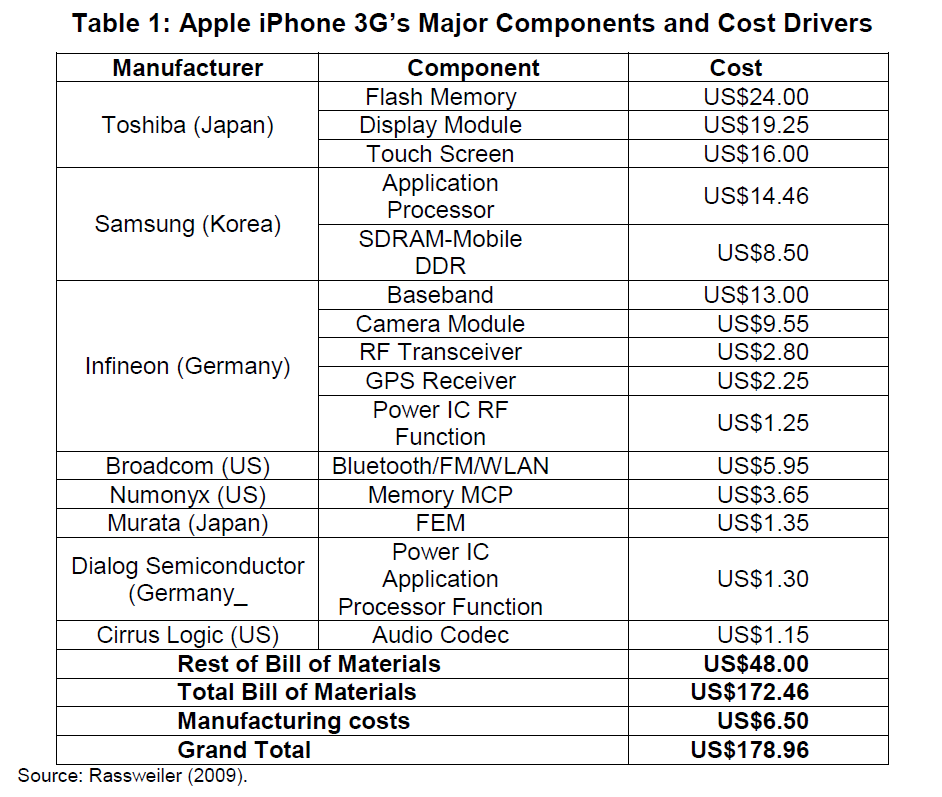
Thus, things are more complicated than suggested by trade in wine from Portugal and textiles from Old Blighty.

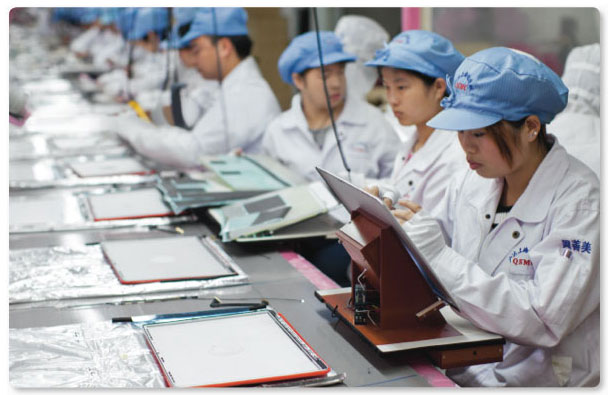
In fact, a scholar at Harvard has one of the most compelling pictures highlighting the global supply chain.

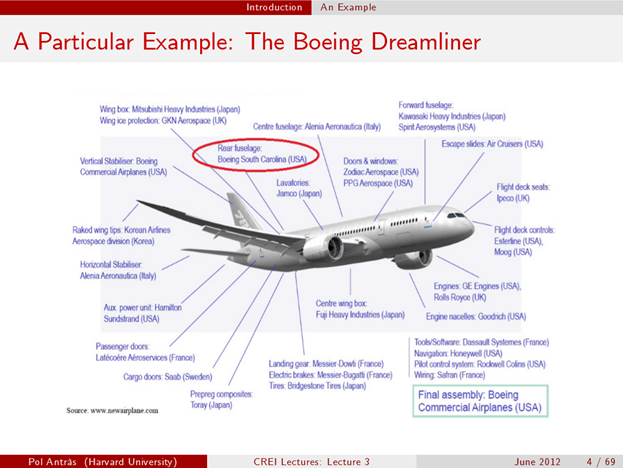
Thus, the 787 Development Team encompasses 50 suppliers located in 9 countries (Australia, France, Germany, Italy, Japan, Korea, Sweden, the United Kingdom and the United States). 70 percent of the 787s parts are produced abroad.

 From Pol Antras’ CREI Lectures in Macroeconomics Contracts and the Global Organization of Production, June 2012

So, this is the sort of complexity which enfuriates the “stranded white working class,” left behind when the factories move abroad, but the company marketing organization builds new offices in the nearby metropole.

From which I also deduce that the conflict between Mr. Trump, Mr. Bannon, and powerful interests on the other side is likely to be a serious battle. This is not a win-win, as global trade always was presented (even though it has “distributional impacts”). Border taxes will intervene in these global commodity chains which have been constructed to further the pursuit of profits by multinationals. So border taxes will in fact also have distributional consequences, but these impacts will extend to company profits and involve reorganization of production.

I mean this is like going to be a pitched battle.

China – Trade Colossus or Assembly Site?

There is a fascinating paper – How the iPhone Widens the United States Trade Deficit with the People’s Republic of China. In this Asian Bank Development Institute (ADBI) white paper, Yuqing Ying and his coauthor document the value chain for an Apple iPhone:

IPhone

The source for this breakout, incidentally, is a “teardown” performed by the IT market research company iSupply, still accessible at –https://technology.ihs.com/389273/iphone-3g-s-carries-17896-bom-and-manufacturing-cost-isuppli-teardown-reveals. In other words, iSupply physically took apart an iPhone to identify the manufacturers of the components.

The Paradox

After estimating that, in

2009 iPhones contributed US$1.9 billion to the trade deficit, equivalent to about 0.8% of the total US trade deficit with the PRC,

the authors go on to point out that

..most of the export value and the deficit due to the iPhone are attributed to imported parts and components from third countries and have nothing to do with the PRC. Chinese workers simply put all these parts and components together and contribute only US$6.5 to each iPhone, about 3.6% of the total manufacturing cost (e.g., the shipping price). The traditional way of measuring trade credits all of the US$178.96 to the PRC when an iPhone is shipped to the US, thus exaggerating the export volume as well as the imbalance. Decomposing the value added along the value chain of iPhone manufacturing suggests that, of the US$2.0 billion worth of iPhones exported from the PRC, 96.4% in fact amounts to transfers from Germany (US$326 million), Japan (US$670 million), Korea (US$259 million), the US (US$108 million), and other countries (US$ 542 million). All of these countries are involved in the iPhone production chain.

Yuqing Xing builds on the paradox in his more recent China’s High-Tech Exports: The Myth and Reality published in 2014 in MIT’s Asian Economic Papers.

Prevailing trade statistics are inconsistent with trade based on global supply chains and mistakenly credit entire values of assembled high-tech products to China. China’s real contribution to the reported 82 percent high-tech exports is labor not technology. High-tech products, mainly made of imported parts and components, should be called “Assembled High-tech.” To accurately measure high-tech exports, the value-added approach should be utilized with detailed analysis on the value chains distributions across countries. Furthermore, if assembly is the only source of value-added by Chinese workers, in terms of technological contribution these assembled high-tech exports are indifferent to labor-intensive products, and so they should be excluded from the high-tech classification.

MNEs, in particular Taiwanese IT firms in China, have performed an important role in the rapid expansion of high-tech exports. The trend of production fragmentation and outsourcing activities of MNEs in information and communication technology has benefitted China significantly, because of its huge labor endowment. The small share of indigenous firms in high-tech exports implies that China has yet to become a real competitor of the United States, EU, and Japan. That China is the number one high-tech exporter is thus a myth rather than a reality.

Ying and Yang

This perspective – that it is really “value-added” that we should focus on, rather than the total dollar volume of trade coming in or going out of a country – is interesting, but I can’t help but think there is a disconnect when you consider actual Chinese foreign exchange reserves, shown below (source – http://www.stats.gov.cn/tjsj/ndsj/2013/indexeh.htm).

ChinaFER

So currently China holds nearly 3.5 trillion dollars in foreign exchange reserves – most of which, but not all, is comprised of US dollars.

This is a huge amount of money, on the order of five percent of total global GDP.

How could China have accumulated this merely by being an assembly site for high tech and other products (see Five Facts about Value-Added Exports and Implications for Macroeconomics and Trade Research)? How can this be attributable just to mistakes in counting the origin of the many components in goods coming from China? Don’t those products have to come in and be counted as imports?

There is a mystery here, which it would be good to resolve.

Assembly photo at top from Apple Insider