Tag Archives: US macroeconomic forecasts

What Mr. Trump May Be Thinking About US Trade

It’s often said a few pictures are worth thousands of words. But pictures can be a little misleading, when everything is globally interconnected.

First, look at the standard view of the ever-widening US trade deficit and negative US balance of payments. Then, focusing on Mexico – a Trump whipping boy – let’s pry open the box and look inside to see what is traded back and forth. What the numbers suggest is that the greatest part of the US trade deficit is involved with “trade by related parties”, i.e. multinational companies importing parts and other goods to the US, sometimes for assembly here and export. Many of these are US companies who have used international operations to cut production costs, but then gain access to US customers on favorable terms through their time-honored sales channels.

The Standard Picture

Just looking at the standard US trade statistics, the story is grim. Imports to the US have persistently exceeded US exports since the 1980’s, with the negative balance soaring just before the Great Recession of 2008-2009 to around $200 billion.

Four countries, China, Germany, Mexico, and Japan are the largest contributors to the US trade deficit, as the following chart shows.

Sharp erosion in the US balance of international payments accompanies these import and export curves.

But What Does Mexico Import Into the US?

This is where we have to adopt a new way of looking at these facts.

So, in recent years, US Trade authorities have begun to maintain a new kind of statistical data, relating to trade by related parties, a.k.a. trade between parts of the same (multinational) company.

Mexico, in fact, has a large portion of this trade by related parties, as the following Table indicates.

Readers may also want to consult J.W. Mason’s The Slack Wire What Exactly Does Mexico Export to the US? 

Now there are all sorts of measurement issues involved in measuring trade by related parties, and, of course, the import prices for within-company trade can be somewhat suspect.

But, its interesting some years ago, the Middle Class Political Economist calculated that –

Thus, things are more complicated than suggested by trade in wine from Portugal and textiles from Old Blighty.

In fact, a scholar at Harvard has one of the most compelling pictures highlighting the global supply chain.

Thus, the 787 Development Team encompasses 50 suppliers located in 9 countries (Australia, France, Germany, Italy, Japan, Korea, Sweden, the United Kingdom and the United States). 70 percent of the 787s parts are produced abroad.

 From Pol Antras’ CREI Lectures in Macroeconomics Contracts and the Global Organization of Production, June 2012

So, this is the sort of complexity which enfuriates the “stranded white working class,” left behind when the factories move abroad, but the company marketing organization builds new offices in the nearby metropole.

From which I also deduce that the conflict between Mr. Trump, Mr. Bannon, and powerful interests on the other side is likely to be a serious battle. This is not a win-win, as global trade always was presented (even though it has “distributional impacts”). Border taxes will intervene in these global commodity chains which have been constructed to further the pursuit of profits by multinationals. So border taxes will in fact also have distributional consequences, but these impacts will extend to company profits and involve reorganization of production.

I mean this is like going to be a pitched battle.

Is the Economy Moving Toward Recession?

Generally, a recession occurs when real, or inflation-adjusted Gross Domestic Product (GDP) shows negative growth for at least two consecutive quarters. But GDP estimates are available only at a lag, so it’s possible for a recession to be underway without confirmation from the national statistics.

Bottom line – go to the US Bureau of Economics Analysis website, click on the “National” tab, and you can get the latest official GDP estimates. Today, (January 25, 2016) this box announces “3rd Quarter 2015 GDP,” and we must wait until January 29th for “advance numbers” on the fourth quarter 2015 – numbers to be revised perhaps twice in two later monthly releases.

This means higher frequency data must be deployed for real-time information about GDP growth. And while there are many places with whole bunches of charts, what we really want is systematic analysis, or nowcasting.

A couple of initiatives at nowcasting US real GDP show that, as of December 2015, a recession is not underway, although the indications are growth is below trend and may be slowing.

This information comes from research departments of the US Federal Reserve Bank – the Chicago Fed National Activity Index (CFNAI) and the Federal Reserve Bank of Atlanta GDPNow model.

CFNAI

The Chicago Fed National Activity Index (CFNAI) for December 2015, released January 22nd, shows an improvement over November. The CFNAI moved –0.22 in December, up from –0.36 in November, and, in the big picture (see below) this number does not signal recession.

FREDCFNAI

The index is a weighted average of 85 existing monthly indicators of national economic activity from four general categories – production and income; employment, unemployment, and hours; personal consumption and housing; and sales, orders, and inventories.

It’s built – with Big Data techniques, incidentally- to have an average value of zero and a standard deviation of one.

Since economic activity trends up over time, generally, the zero for the CFNAI actually indicates growth above trend, while a negative index indicates growth below trend.

Recession levels are lower than the December 2015 number – probably starting around -0.7.

GDPNow Model

The GDPNow Model is developed at the Federal Reserve bank of Atlanta.

On January 20, the GDPNow site announced,

The GDPNow model forecast for real GDP growth (seasonally adjusted annual rate) in the fourth quarter of 2015 is 0.7 percent on January 20, up from 0.6 percent on January 15. The forecasts for fourth quarter real consumer spending growth and real residential investment growth each increased slightly after this morning’s Consumer Price Index release from the U.S. Bureau of Labor Statistics and the report on new residential construction from the U.S. Census Bureau.

The chart accompanying this accouncement shows a somewhat less sanguine possibility – namely that consensus estimates and the output of the GDPNow model have been on a downward trend if you look at things back to September 2015.

GDPNow

Federal Reserve Plans to Raise Interest Rates

It is widely expected the US Federal Reserve Bank will raise the federal funds rate from its seven-year low below 0.25 percent to maybe 0.50 percent. Then, further increases will bring this key short term rate back in line with its historic profile gradually, depending on the health of the US economy and international factors.

This will probably occur next week at the meeting of the Federal Open Market Committee (FOMC), December 15-16.

Here’s a chart from the excellent St. Louis Federal Reserve data site (FRED) showing how unusual recent years are in terms of this key interest rate.

FedFundsRate2

Shading in the chart indicates periods of recession.

Thus, the federal funds rate – which is the rate charged on overnight loans to banking members of the Federal Reserve system – was pushed to the zero bound as a response to the financial crisis and recession 2008-2009.

A December increase has been discussed by prominent members of the Federal Open Market Committee and, of course, in Janet Yellen’s testimony before the US Congress, December 3.

Yet discussion still considers the balance between ‘doves’ and ‘hawks’ on the FOMC. Next year, apparently, FOMC membership may shift toward more ‘hawks’ in voting positions – bankers who see inflation risks from the current recovery. See, for example, Richard Grossman’s Birdwatching at the Federal Reserve.

How far will interest rates rise? One way to address this is by considering the Fed funds futures contract. Currently, the CME futures data indicate a rise to 1.73% over the next 36 months.

All this seems long overdue, based on historical interest rate levels, but that does not stop some alarmist talk.

BIS Warns The Fed Rate Hike May Unleash The Biggest Dollar Margin Call In History

As a result, our only question for the upcoming Fed rate hike is how long it will take before the Fed, shortly after increasing rates by a modest 25 bps to “prove” to itself if not so much anyone else that the US economy is fine, will be forced to mainline trillions of dollars around the globe via swap lines for the second time in a row as the world experiences the biggest USD margin call in history.

By the end of next week or probably just after the first of 2016, interest rates may move a little from the zero bound, and from then on, one fulcrum of all business and economic forecasts will be the pace of further increases.

Fractal Markets, Fractional Integration, and Long Memory in Financial Time Series – I

The concepts – ‘fractal market hypothesis,’ ‘fractional integration of time series,’ and ‘long memory and persistence in time series’ – are related in terms of their proponents and history.

I’m going to put up ideas, videos, observations, and analysis relating to these concepts over the next several posts, since, more and more, I think they lead to really fundamental things, which, possibly, have not yet been fully explicated.

And there are all sorts of clear connections with practical business and financial forecasting – for example, if macroeconomic or financial time series have “long memory,” why isn’t this characteristic being exploited in applied forecasting contexts?

And, since it is Friday, here are a couple of relevant videos to start the ball rolling.

Benoit Mandelbrot, maverick mathematician and discoverer of ‘fractals,’ stands at the crossroads in the 1970’s, contributing or suggesting many of the concepts still being intensively researched.

In economics, business, and finance, the self-similarity at all scales idea is trimmed in various ways, since none of the relevant time series are infinitely divisible.

A lot of energy has gone into following Mandelbrot suggestions on the estimation of Hurst exponents for stock market returns.

This YouTube by a Parallax Financial in Redmond, WA gives you a good flavor of how Hurst exponents are being used in technical analysis. Later, I will put up materials on the econometrics involved.

Blog posts are a really good way to get into this material, by the way. There is a kind of formalism – such as all the stuff in time series about backward shift operators and conventional Box-Jenkins – which is necessary to get into the discussion. And the analytics are by no means standardized yet.

Economic Outlook – July 2015

For my money, Janet Yellen’s speech July 10 – parts of which I quote below – is important.

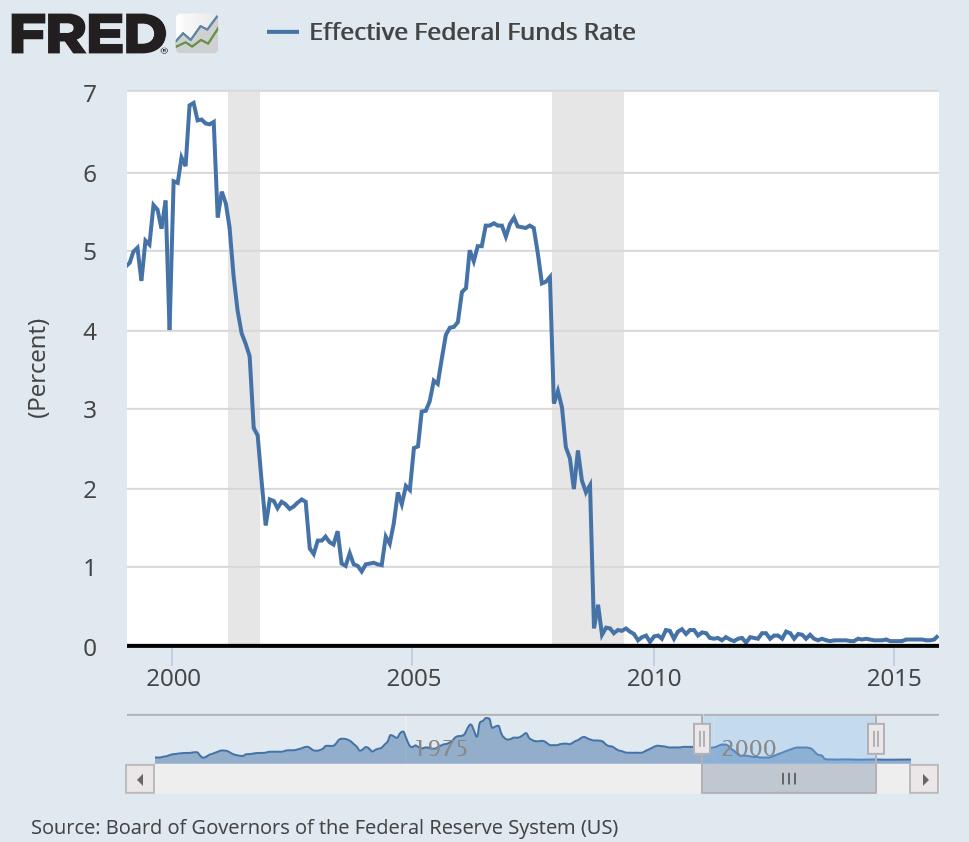
Yellen says the Fed plans the first increase in interest rates this year – in September or December, given Fed meeting schedules.

I believe the fact that we have virtually zero interest rates, and have for some time, creates distortions in economic discussions, not to mention its bizarre effects on the real economy.

On the one hand, the US Federal Reserve must realize that if it does not raise interest rates in this phase of the business cycle, it may be a very long time before we get off the zero lower bound. This creates a tendency to “happy talk” from monetary officials, although not Ms. Yellen specifically, papering over weakness in the US and global economy.

On the other hand, I suspect there are now economic interests invested in continuation of low rates, and their contribution going forward may be to sound the alarm at the slightest sign of economic troubles.

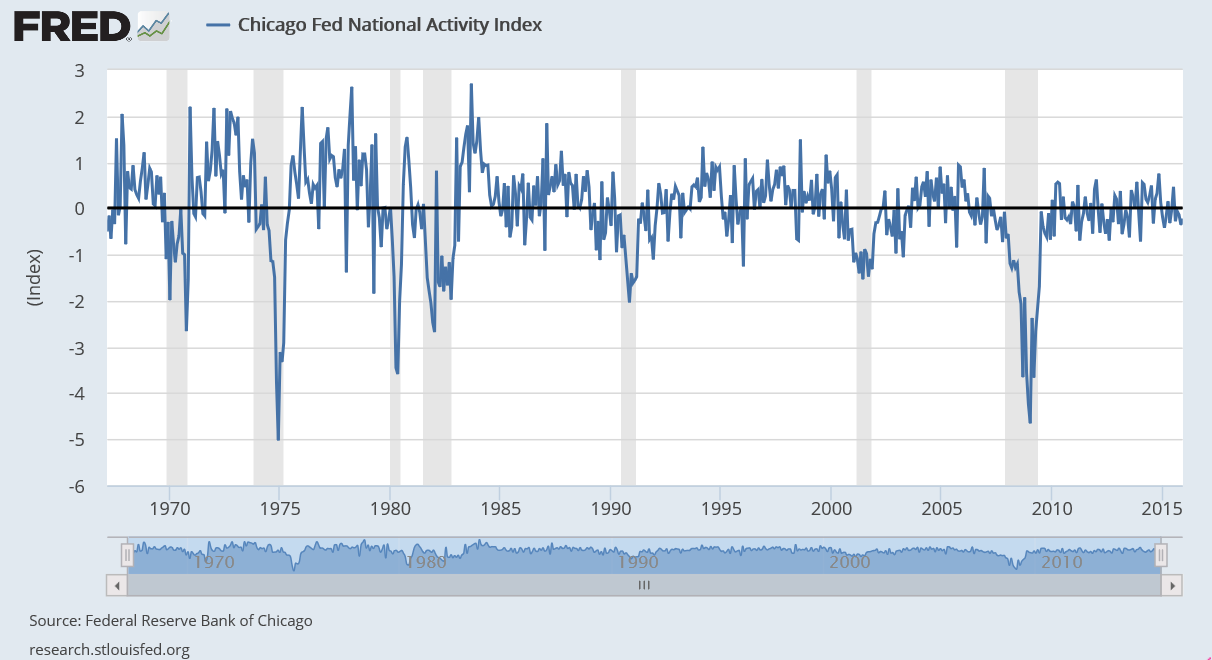
And, truly, this expansion phase of the current business cycle is “growing long in the tooth.” It began, according to the National Bureau of Economic Research, in summer 2009. This makes for 96 months from the previous trough of the business cycle to the current time. Only two previous US business expansions historically are longer than this, and only by one or two years.

The price of (economic) freedom is eternal vigilance. With that in mind, consider some of the datapoints on the current economic outlook.

United States

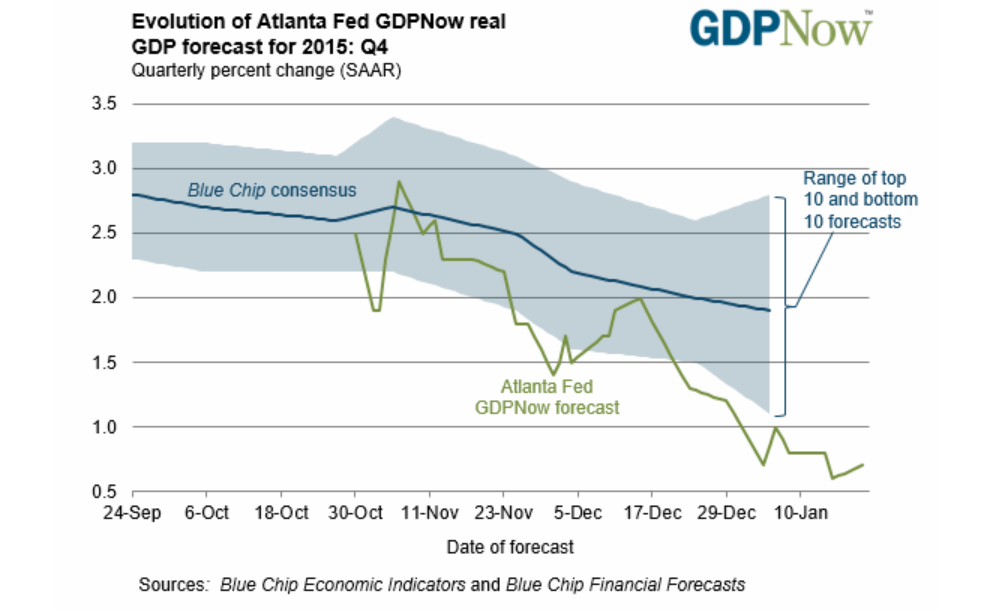
There is an extensive extract from Ms. Yellen’s speech, assessing US economic conditions, the latest report indicating retail sales softened, and the earlier May 2015 consensus forecast of the Survey of Professional Forecasters, indicating lower economic growth expectations.

Janet Yellen’s Speech at the City Club of Cleveland, Ohio

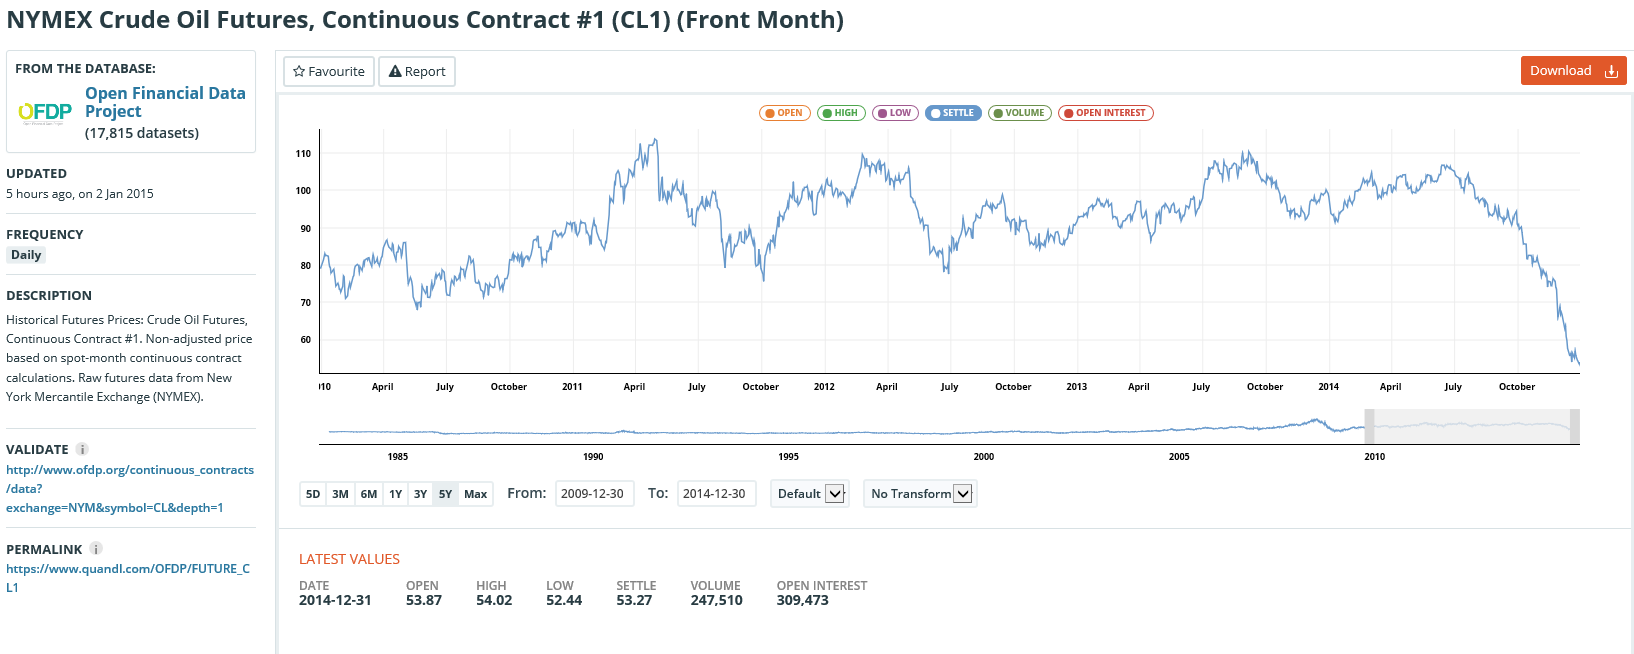
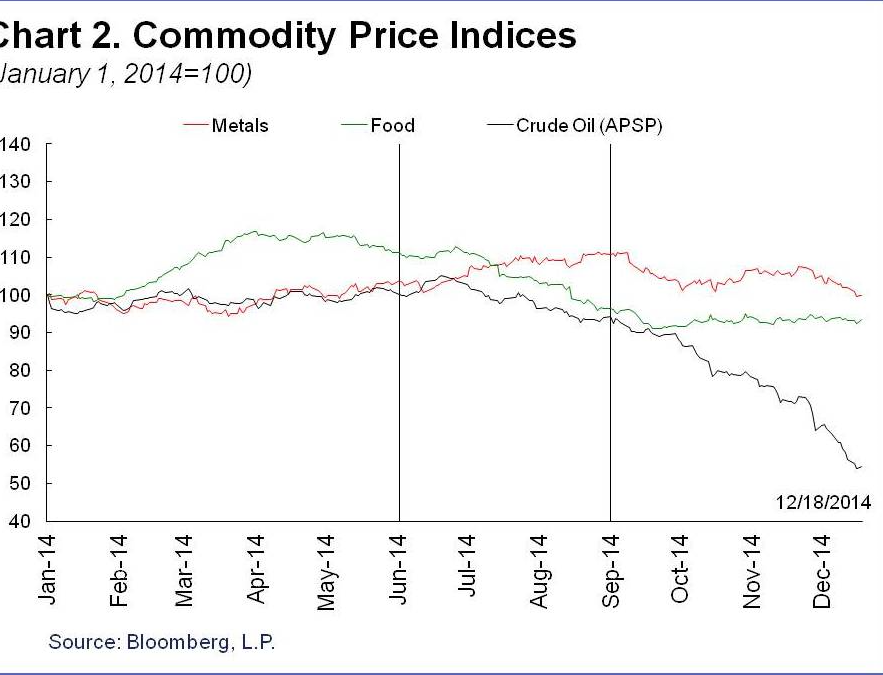
Let me turn now to where I think the economy is headed over the next several years. The latest estimates show that both real GDP and industrial production actually edged down in the first quarter of this year. Some of this weakness appears to be the result of factors that I expect will be only transitory, such as the unusually harsh winter weather in some regions of the country and the West Coast port labor dispute that briefly restrained international trade and caused disruptions in manufacturing supply chains. Also, statistical noise or measurement issues may have played some role. This is not the first time in recent years that real GDP has been reported to decline, or grow unusually slowly, in the first quarter of the year. There is a healthy debate among economists–many within the Federal Reserve System–about some of the technical factors that may lie behind this pattern.4 Nevertheless, at least a couple of other more persistent factors also likely weighed on economic output and industrial production in the first quarter. In particular, the higher foreign exchange value of the dollar that I mentioned, as well as weak growth in some foreign economies, has restrained the demand for U.S. exports. Moreover, lower crude oil prices have significantly depressed business investment in the domestic energy sector. Indeed, industrial production continued to decline somewhat in April and May. We expect the drag on domestic economic activity from these factors to ease over the course of this year, as the value of the dollar and crude oil prices stabilize, and I anticipate moderate economic growth, on balance, for this year as a whole. As always, however, the economic outlook is uncertain. Notably, although the economic recovery in the euro area appears to have gained a firmer footing, the situation in Greece remains unresolved.

JenetYellen

Looking further ahead, I think that many of the fundamental factors underlying U.S. economic activity are solid and should lead to some pickup in the pace of economic growth in the coming years. In particular, I anticipate that employment will continue to expand and the unemployment rate will decline further.

An improving job market should, in turn, help support a faster pace of household spending growth. Additional jobs and potentially faster wage growth bolster household incomes, and lower energy prices mean consumers have more money to spend on other goods and services. In addition, growing employment and wages should make consumers more comfortable in spending a greater portion of their incomes than they have been in the aftermath of the Great Recession. Moreover, increases in house values and stock market prices, along with reductions in debt in recent years, have pushed up households’ net worth, which also should support more spending. Finally, interest rates faced by borrowers remain low, reflecting the FOMC’s highly accommodative monetary policies. Indeed, recent encouraging data about retail sales and light motor vehicle purchases in the beginning of the second quarter could be an indication that the pace of consumer spending is picking up.

Another positive factor for the outlook is that the drag on economic growth in recent years from changes in federal fiscal policies appears to have waned. Temporary fiscal stimulus measures supported economic output during the recession and early in the recovery, but those stimulus measures have since expired, and additional policy actions were taken to reduce the federal budget deficit. By 2011, these changes in fiscal policies were holding back economic growth. However, the effects of those fiscal policy actions now seem to be mostly behind us.5

There are a couple of factors, however, that I expect could restrain economic growth. First, business owners and managers remain cautious and have not substantially increased their capital expenditures despite the solid fundamentals and brighter prospects for consumer spending. Businesses are holding large amounts of cash on their balance sheets, which may suggest that greater risk aversion is playing a role. Indeed, some economic analysis suggests that uncertainty about the strength of the recovery and about government economic policies could be contributing to the restraint in business investment.6

A second factor that could restrain economic growth regards housing. While national home prices have been rising for a few years and home sales have improved recently, residential construction has remained quite soft. Many households still find it difficult to obtain mortgage credit, but, more generally, the weak job market and slow wage gains in recent years appear to have induced people to double-up on housing. For example, many young adults continue to live with their parents. Population growth is creating a need for more housing, whether to rent or to own, and I do expect that continuing job and wage gains will encourage more people to form new households. Nevertheless, activity in the housing sector seems likely to improve only gradually.

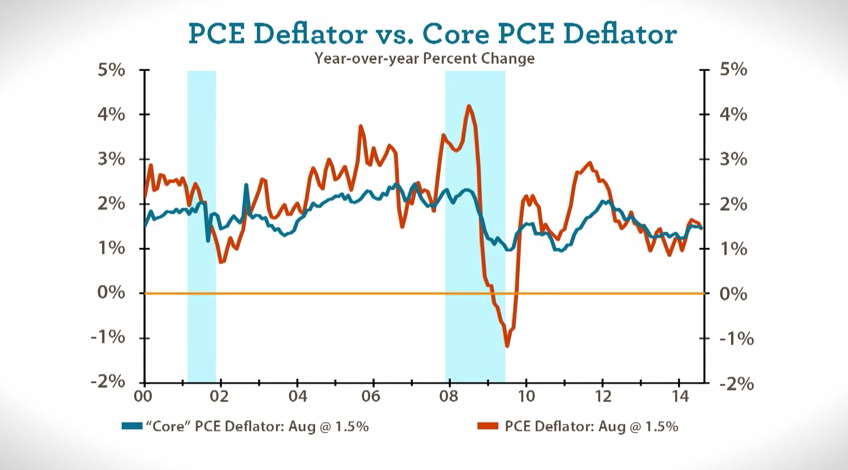
Regarding inflation, as I mentioned earlier, the recent effects of lower prices for crude oil and for imports on overall inflation are expected to wane during this year. Combined with further tightening in labor and product markets, I expect inflation will move toward the FOMC’s 2 percent objective over the next few years. Importantly, a number of different surveys indicate that longer-term inflation expectations have remained stable even as recent readings on inflation have fallen. If inflation expectations had not remained stable, I would be more concerned because consumer and business expectations about inflation can become self-fulfilling.

From the New York Times – To my ears, most of Ms. Yellen’s speech expertly laid out why the economy is not ready for interest rate increases anytime soon. Then, toward the end, she said that based on her views, she expected to begin raising rates “at some point later this year.” That would mean a rate hike in three months, at the Fed’s next meeting in September, or six months hence at its December meeting.

ADVANCE MONTHLY SALES FOR RETAIL AND FOOD SERVICES

The U.S. Census Bureau announced today that advance estimates of U.S. retail and food services sales for June, adjusted for seasonal variation and holiday and trading-day differences, but not for price changes, were $442.0 billion, a decrease of 0.3 percent (±0.5%)* from the previous month, but up 1.4 percent (±0.9%) above June 2014. Total sales for the April 2015 through June 2015 period were up 1.7 percent (±0.7%) from the same period a year ago. The April 2015 to May 2015 percent change was revised from +1.2 percent (±0.5%) to +1.0 percent (±0.3%).

Retail trade sales were down 0.3 percent (±0.5%)* from May 2015, but up 0.6 percent (±0.7%)* above last year. Food services and drinking places were up 7.7 percent (±3.3%) from June 2014 and sporting goods, hobby, books and music were up 6.6 percent (±1.9%) from last year. Gasoline stations were down 17.1% (±1.4%) from the previous year.

Second Quarter 2015 Survey of Professional Forecasters

(Release Date: May 15, 2015) Weaker Outlook for Growth

The outlook for growth in the U.S. economy over the next three years looks weaker now than it did in February, according to 44 forecasters surveyed by the Federal Reserve Bank of Philadelphia. The forecasters predict real GDP will grow at an annual rate of 2.5 percent this quarter and 3.1 percent next quarter. On an annual-average over annual-average basis, real GDP will grow 2.4 percent in 2015, down 0.8 percentage point from the previous estimate. The forecasters predict real GDP will grow 2.8 percent each in 2016 and 2017, and 2.5 percent in 2018.

Global

Emerging markets made up some of the slack in the global economy after 2008-2009, but today are everywhere slowing, as the latest revision of the International Monetary Fund (IMF) World Economic Outlook indicates.

IMF July World Economic Outlook – Slower Growth in Emerging Markets, a Gradual Pickup in Advanced Economies

Global growth is projected at 3.3 percent in 2015, marginally lower than in 2014, with a gradual pickup in advanced economies and a slowdown in emerging market and developing economies. In 2016, growth is expected to strengthen to 3.8 percent.

  • A setback to activity in the first quarter of 2015, mostly in North America, has resulted in a small downward revision to global growth for 2015 relative to the April 2015 World Economic Outlook (WEO). Nevertheless, the underlying drivers for a gradual acceleration in economic activity in advanced economies—easy financial conditions, more neutral fiscal policy in the euro area, lower fuel prices, and improving confidence and labor market conditions—remain intact.
  • In emerging market economies, the continued growth slowdown reflects several factors, including lower commodity prices and tighter external financial conditions, structural bottlenecks, rebalancing in China, and economic distress related to geopolitical factors. A rebound in activity in a number of distressed economies is expected to result in a pickup in growth in 2016.
  • The distribution of risks to global economic activity is still tilted to the downside. Near-term risks include increased financial market volatility and disruptive asset price shifts, while lower potential output growth remains an important medium-term risk in both advanced and emerging market economies. Lower commodity prices also pose risks to the outlook in low-income developing economies after many years of strong growth.

Link to Blanchard video

China May Tip World Into Recession: Morgan Stanley

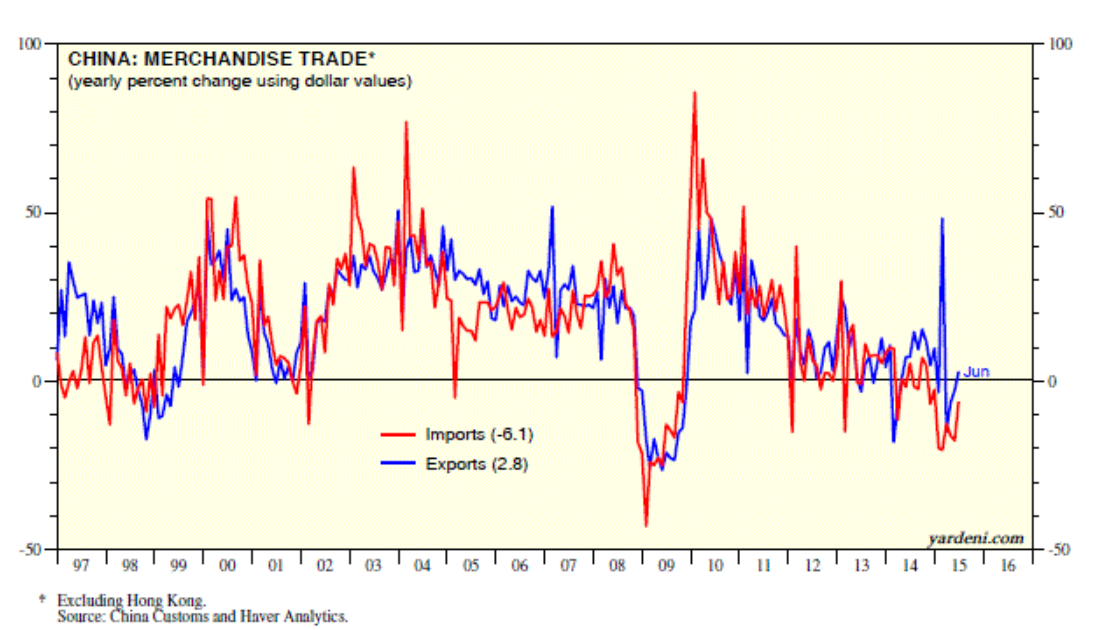
Also there is this interesting chart From Dr. Ed’s Blog

ChinaTrade

Impending Disaster In Greece

My take is that the harsh dealing with Greece led by, apparently, the Germans is more symbolic than directly material to global economic conditions. Nevertheless, it is an ugly symbol, representing, it seems, the end of dreamy thoughts about European integration and the onset of recognition of new German hegemony in Europe.

I am an admirer of modern Germany, having struggled to relearn enough German to read newspapers recently and ask for items in German bakeries. I see the German perspective, but I deeply regret its narrow scope. I think more conservative Germans are missing the big picture here. Of course, the plight of the Greeks is desperate and lamentable.

One final remark – forecasting comes to the fore at junctures such as these. Are we on the cusp, have we started to slide down, or is there still some upside? Compelling questions.

Video Friday

Here are some short takes on topics of the day related to the economic outlook for the rest of 2015, nationally and globally.

First a couple of videos on the poor performance of the US economy in the first quarter 2015, when real GDP contracted slightly. This also happened last year, and so there may be a rebound, and, of course, the estimates are released at a significant lag – so we won’t know for a while.

US economy shrank in the first quarter of 2015

U.S. Economy Shrank in First Quarter

Then, a couple of videos on the Chinese stock market crash and condition of the Chinese economy – worrisome since China plays a bigger and bigger role in global business. Bear with the halting English in the first video; there is a payoff in terms of a look from the inside. The second is from a couple of months ago, but is extremely informative vis a vis the big picture.

Stock market of China Falls 16, June 2015

China’s Economy: The Numbers Look Scary

And finally Greece.

Greek crisis in 90 seconds | FT Markets

In closing, I have a comments on technical forecasting issues suggested by the above.

First, “nowcasting” with mixed frequency data should always be applied to these prognostications of what will happen to past economic growth, e.g. the 2nd quarter of 2015. My sense is this is not being done widely, but it’s easy to show its efficacy. There is no reason to drawl on about imponderables, when you can just apply available weekly and monthly data, maybe using MIDAS, to get a better idea of what number we are likely see for the 2nd quarter 2015.

Secondly, I doubt data analytics can provide much light on the situation in China, precisely because there is a lot of evidence the data being announced are suspect. You can go too far in claiming this, but there are warning signs about Chinese data these days. It’s probably comparable to assessing the integrity of Chinese company financials – which see very creative accounting. in certain cases.

As far as Greece goes, I think the outcome is completely unpredictable. Greece is a small economy. If turning Greece away means catastrophic consequences, assistance should be forthcoming, and there are resources available for the size of the problem.  Events, however, may have moved beyond rationality.

The crux of the matter seems to be that there needs to be a way to recirculate funds from the surplus exporters (Germany, largely) to the deficit importers (peripheral Europe).

One proposal is for Germany to create a kind of “New Deal” to invest in the European periphery, so that down the line, their economies can become more balanced and competitive. Another approach, which seems to be that of the Christian Democratic Union (CDU) of Germany, is the neoliberal “solution.” Essentially, force wages and living standards down in debtor countries to the point where they again become globally competitive.

Top Forecasters of the US Economy, 2013-2014

Once again, Christophe Barraud, a French economist based in Paris, is ranked as the “best forecaster of the US economy” by Bloomberg (see here).

This is quite an accomplishment, considering that it is based on forecasts for 14 key monthly indicators including CPI, Durable Goods Orders, Existing Home Sales, Housing Starts, IP, ISM Manufacturing, ISM Nonmanufacturing, New Home Sales, Nonfarm Payrolls, Personal Income, Personal Spending, Retail Sales, Unemployment and GDP.

For this round, Bloomberg considered two years of data ending ended November 2014.

Barraud was #1 in the rankings for 2011-2012 also.

In case you wanted to take the measure of such talent, here is a recent interview with Barraud conducted by Figaro (in French).

The #2 slot in the Bloomberg rankings of best forecasters of the US economy went to Jim O’Sullivan of High Frequency Economics.

Here just an excerpt from an interview by subscription with O’Sullivan – again to take the measure of the man.

While I have been absorbed in analyzing a statistical/econometric problem, a lot has transpired – in Switzerland, in Greece and the Ukraine, and in various global regions. While I am optimistic in outlook presently, I suspect 2015 may prove to be a year of surprises.

Wither the Price of Oil?

Crude oil futures continue their descent, as the chart below from January 2, 2015 shows.

oilfuturesJan215

What is going to happen here?

Discussions organize around several issues, pretty well nailed recently by IMF bloggers (including Chief Economist Oliver Blanchard) in Seven Questions About The Recent Oil Price Slump.

  1. What are the respective roles of demand and supply factors?
  2. How persistent is this supply shift likely to be?
  3. What are the effects likely to be on the global economy?
  4. What are likely to be the effects on oil importers?
  5. What are likely to be the effects on oil exporters?
  6. What are the financial implications?
  7. What should be the policy response of oil importers and exporters?

The first point to note is the drop in oil prices involves both supply and demand – and is not just the result of increased pumping by Saudi Arabia.

The IMF discussion includes this interesting comparison between oil and other commodity price indices.

commoditypriceindeices

So over 2014, there have been drops in other commodity prices – probably due to weakened global demand – but not nearly much as oil.

Overall, the IMF counts lower oil prices as a net positive to the global economy, resulting in a gain for world GDP between 0.3 and 0.7 percent in 2015, compared to a scenario without the drop in oil prices.

There are big losers, of course. These include oil exporters with higher production costs, such as Russia, Iran, and Venezuela.

To take some examples, energy accounts for 25 percent of Russia’s GDP, 70 percent of its exports, and 50 percent of federal revenues. In the Middle East, the share of oil in federal government revenue is 22.5 percent of GDP and 63.6 percent of exports for the Gulf Cooperation Council countries. In Africa, oil exports accounts for 40-50 percent of GDP for Gabon, Angola and the Republic of Congo, and 80 percent of GDP for Equatorial Guinea. Oil also accounts for 75 percent of government revenues in Angola, Republic of Congo and Equatorial Guinea. In Latin America, oil contributes respectively about 30 percent and 46.6 percent to public sector revenues, and about 55 percent and 94 percent of exports for Ecuador and Venezuela.[8] This shows the dimension of the challenge facing these countries.

How long the Saudi’s can hold the line, maintaining higher production? Is it true, for example, that Saudi Arabia has a $750bn war chest of foreign currency reserves that will be burned through quickly by propping up the shortfall in export revenues? There are speculations that the health of King Abdullah, a strong supporter of the current Saudi Oil Minister, could come into play in coming months.

Interestingly, low oil prices maintained long enough could be self-correcting. This is probably the bet the Saudi’s are making – that their policy can eventually trigger faster growth and enable them to maintain or increase their market share.

As I’ve said before, I think it’s a game changer. The trick is to figure out the linkages and connections, backwards and forwards along the supply chains.

Image of King Abdullah from Telegraph.

Economic Outlook 2015 – I

Well, it’s that time – end of one calendar year and, soon, the beginning of another, and that means major banks and financial institutions are releasing their big picture “economic outlooks” for 2015.

Here are two well worth watching.

Jan Hatzius of Goldman Sachs provides an interesting, short discussion of the US economic outlook for 2015.

Huw Pills, also of Goldman Sachs, gives a nuanced discussion of Europe’s more vulnerable economic position for 2015.

For other regions, see Outlook 2015.

Barron’s Outlook 2015: Stick With the Bull focuses on stocks and is based on a survey of investment advisors; its outlook is decidedly upbeat.

Born in March 2009, today’s bull market is the fourth longest in history—and it isn’t about to end, despite last week’s shellacking. That’s the word from Wall Street’s top strategists, who expect the Standard & Poor’s 500 stock index to rise 10% in 2015. A gain of that magnitude surely would merit applause, coming atop an 8% rally year to date, not to mention 2013’s 30% advance. Almost six years in, the old bull still seems sprightly….

U.S. stocks are neither cheap nor expensive, based on the market’s current price/earnings ratio of 15.8 times future four-quarter earnings. Few strategists expect the multiple to expand much in the coming year.

“In isolation, U.S. stocks are on the expensive side,” says Jeffrey Knight, head of global asset allocation at Columbia Management. But measured against other financial assets—whether emerging-market equities or developed-market bonds—U.S. shares look strong, he adds.

And, in researching this article, I found Janet Yellen’s Dashboard available from the Brookings Institution website.

A lot of what happens in 2015 has to do with whether, when, and then how much the Fed raises interest rates.

I’m aiming to be as inclusive as I can in putting up these videos of the various celebrity forecasters and their outlook for 2015, so stay tuned.

Investment and Other Bank Macro Forecasts and Outlooks – 2

Today, I take a brief look at economic forecasts available from Morgan Stanley, Wells Fargo, and the French concern Credit Agricole. As readers will note, Morgan Stanley has a lively discussion of the implications of the US midterms, while Wells Fargo has a very comprehensive and easy-to-access series of economic projections, ranging from weekly, to monthly and annual. Credit Agricole (apologies for omitting the accent mark) is the first European bank profiled in these brief looks, and has quarterly updates of fairly comprehensive economic projections across a range of variables.

And I might mention that these publications, which date back into September in many cases, are interesting to review both because of their projections and because of what they miss – notably the drop in oil prices and aggressive new round of quantitative easing by the Bank of Japan.

The fact these developments are missed in these September and even later releases qualifies them as genuine surprises. Thus, their impacts are not discounted in past market developments, and, going forward, oil prices and Japan QE could exert significant, discrete effects on markets.

Morgan Stanley

According to the Federal Reserve’s National Information Center, Morgan Stanley is the nation’s 6th largest bank.

JPMorgan

The Global Investment Committee (GOC) Weekly for November 10 is notable for some straight talk on the Implications of the US midterms, which Morgan Stanley see as slightly pro-growth, positive for equities, with constructive compromises, characteristic of lame duck presidencies. I quote fairly extensively, because the frankness of the insights and suggestions is refreshing.

The maxim that gridlock in Washington is good for markets has certainly held true during the “do nothing” Congress of the past two years. Now, with the Republicans winning control of the Senate and adding 15 seats to their House majority, the outlook appears to be for more of the same. Happily for investors, an analysis going back to 1900 shows that equity markets have averaged annualized 15% returns when the Congress is controlled by Republicans and the White House by a Democrat.

Although many pundits have suggested that the GOP sweep creates a mandate, the Global Investment Committee (GIC) sees the results as a mandate for change in the functioning and compromise in Washington rather than the embrace of a specific agenda. On that score, unlike the deeply partisan divide between the House and the Senate of the last four years that prevented any compromise bills from getting off the Hill, legislation may actually get to the president’s desk. While President Obama will be free to veto, he is now playing for his legacy and may be apt to compromise on some issues.

The Republicans’ challenge is to demonstrate leadership and competence in governing, a task that will require corralling the Tea Party caucus and, as Morgan Stanley & Co. Chief US Economist Vincent Reinhart wrote last week, “sequencing priorities” in a constructive way. Lacking a coherent issue-driven platform, most Republicans simply ran against Obama. Party infighting or an immediate battle about the debt ceiling and budget authorizations would likely be disastrous for the GOP—and the markets. From the GIC’s perspective, a better result would be for Congress to focus on job-creating initiatives and not on eviscerating the Affordable Care Act (ACA).

Agreement should be easiest around initiatives involving the energy sector, where this year’s 25% decline in oil prices has been front and center. American energy independence is no longer a dream but a real prospect with profound geopolitical as well as economic consequences (see Chart of the Week, page 3). Heretofore, the Keystone XL pipeline, a six-year-old proposal to connect Canadian oil with US Gulf Coast refineries, has been stalled amid wrangling with environmentalists. We believe the pipeline is now likely to win approval, creating a large national infrastructure project. Similarly, the growth of US energy supply is likely to reignite a debate on oil exports, which have been banned since the Arab oil embargoes of the 1970s. With US dollar strength likely to crimp other exports, expanding energy exports is a way to maintain economic growth. There is likely to be similar debate about exports of liquefied natural gas as the US is the world’s largest and lowest-cost producer. We believe that energy exports would be a major beneficiary focus if the new Congress approves the Trans-Pacific Partnership, a free trade agreement that would give the president authority to negotiate deals with 11 Asian nations.

Beyond energy, we expect repeal of the medical-device tax; expansion of defense spending, which has been curtailed under sequestration; and a debate on corporate tax reform, especially given the noise around tax-driven international mergers. Revisions to the ACA, to the extent they are pursued, will likely focus on measures that impact the number of insured and thus, hospitals and managed-care companies. The employer mandate, which requires employers with more than 100 workers to make available health insurance for any employee working more than 30 hours per week, is most likely to be revised, in our view.

As a final note, a review of state and local ballot initiatives suggest that voters are far from embracing an ideological position on fiscal austerity. Minimum-wage increases were passed in each state where they were on the ballot as did several large new-money infrastructure projects in New York and California—a development that MS & Co. Municipals Strategist, Michael Zezas, notes will likely increase bond supplies in 2015.

It looks like the august Global Economic Forum is being being published more infrequently than in the past, the last edition being March 5 of this year.

Wells Fargo

Wells Fargo, accounting to Wikipedia is –

an American multinational banking and financial services holding company which is headquartered in San Francisco, California, with “hubquarters” throughout the country… It is the fourth largest bank in the U.S. by assets and the largest bank by market capitalization…Wells Fargo is the second largest bank in deposits, home mortgage servicing, and debit cards. In 2011, Wells Fargo was the 23rd largest company in the United States.

The Wells Fargo website has a suite of forecasting reports, ranging from weekly, to monthly, to the big annual report, all downloadable in PDF format.

In October, the bank also released this video interview about their economic outlook.


In case you did not get time to watch that, one of the key graphics is the PCE deflator, which has been trending down recently, raising the spectre of deflation in the minds of some.

PCEdeflator

Credit Agricole

Credit Agricole is an international full services banking company, headquartered in France, with historical ties to French farming,

Their website offers at least two quarterly macroeconomic forecasting publications.

The publication Economic and Financial Forecasts presents a series of tabular forecasts for interest rates, exchange rates and commodity prices, together with the Crédit Agricole Group’s central economic projections. This is a kind of “just the numbers ma’am report.”

Macro Prospects is more discursive and with short highlights on key countries, such as, in the September issue, Brazil and China.

I signed up for emails from Credit Agricole, announcing updates of these documents.